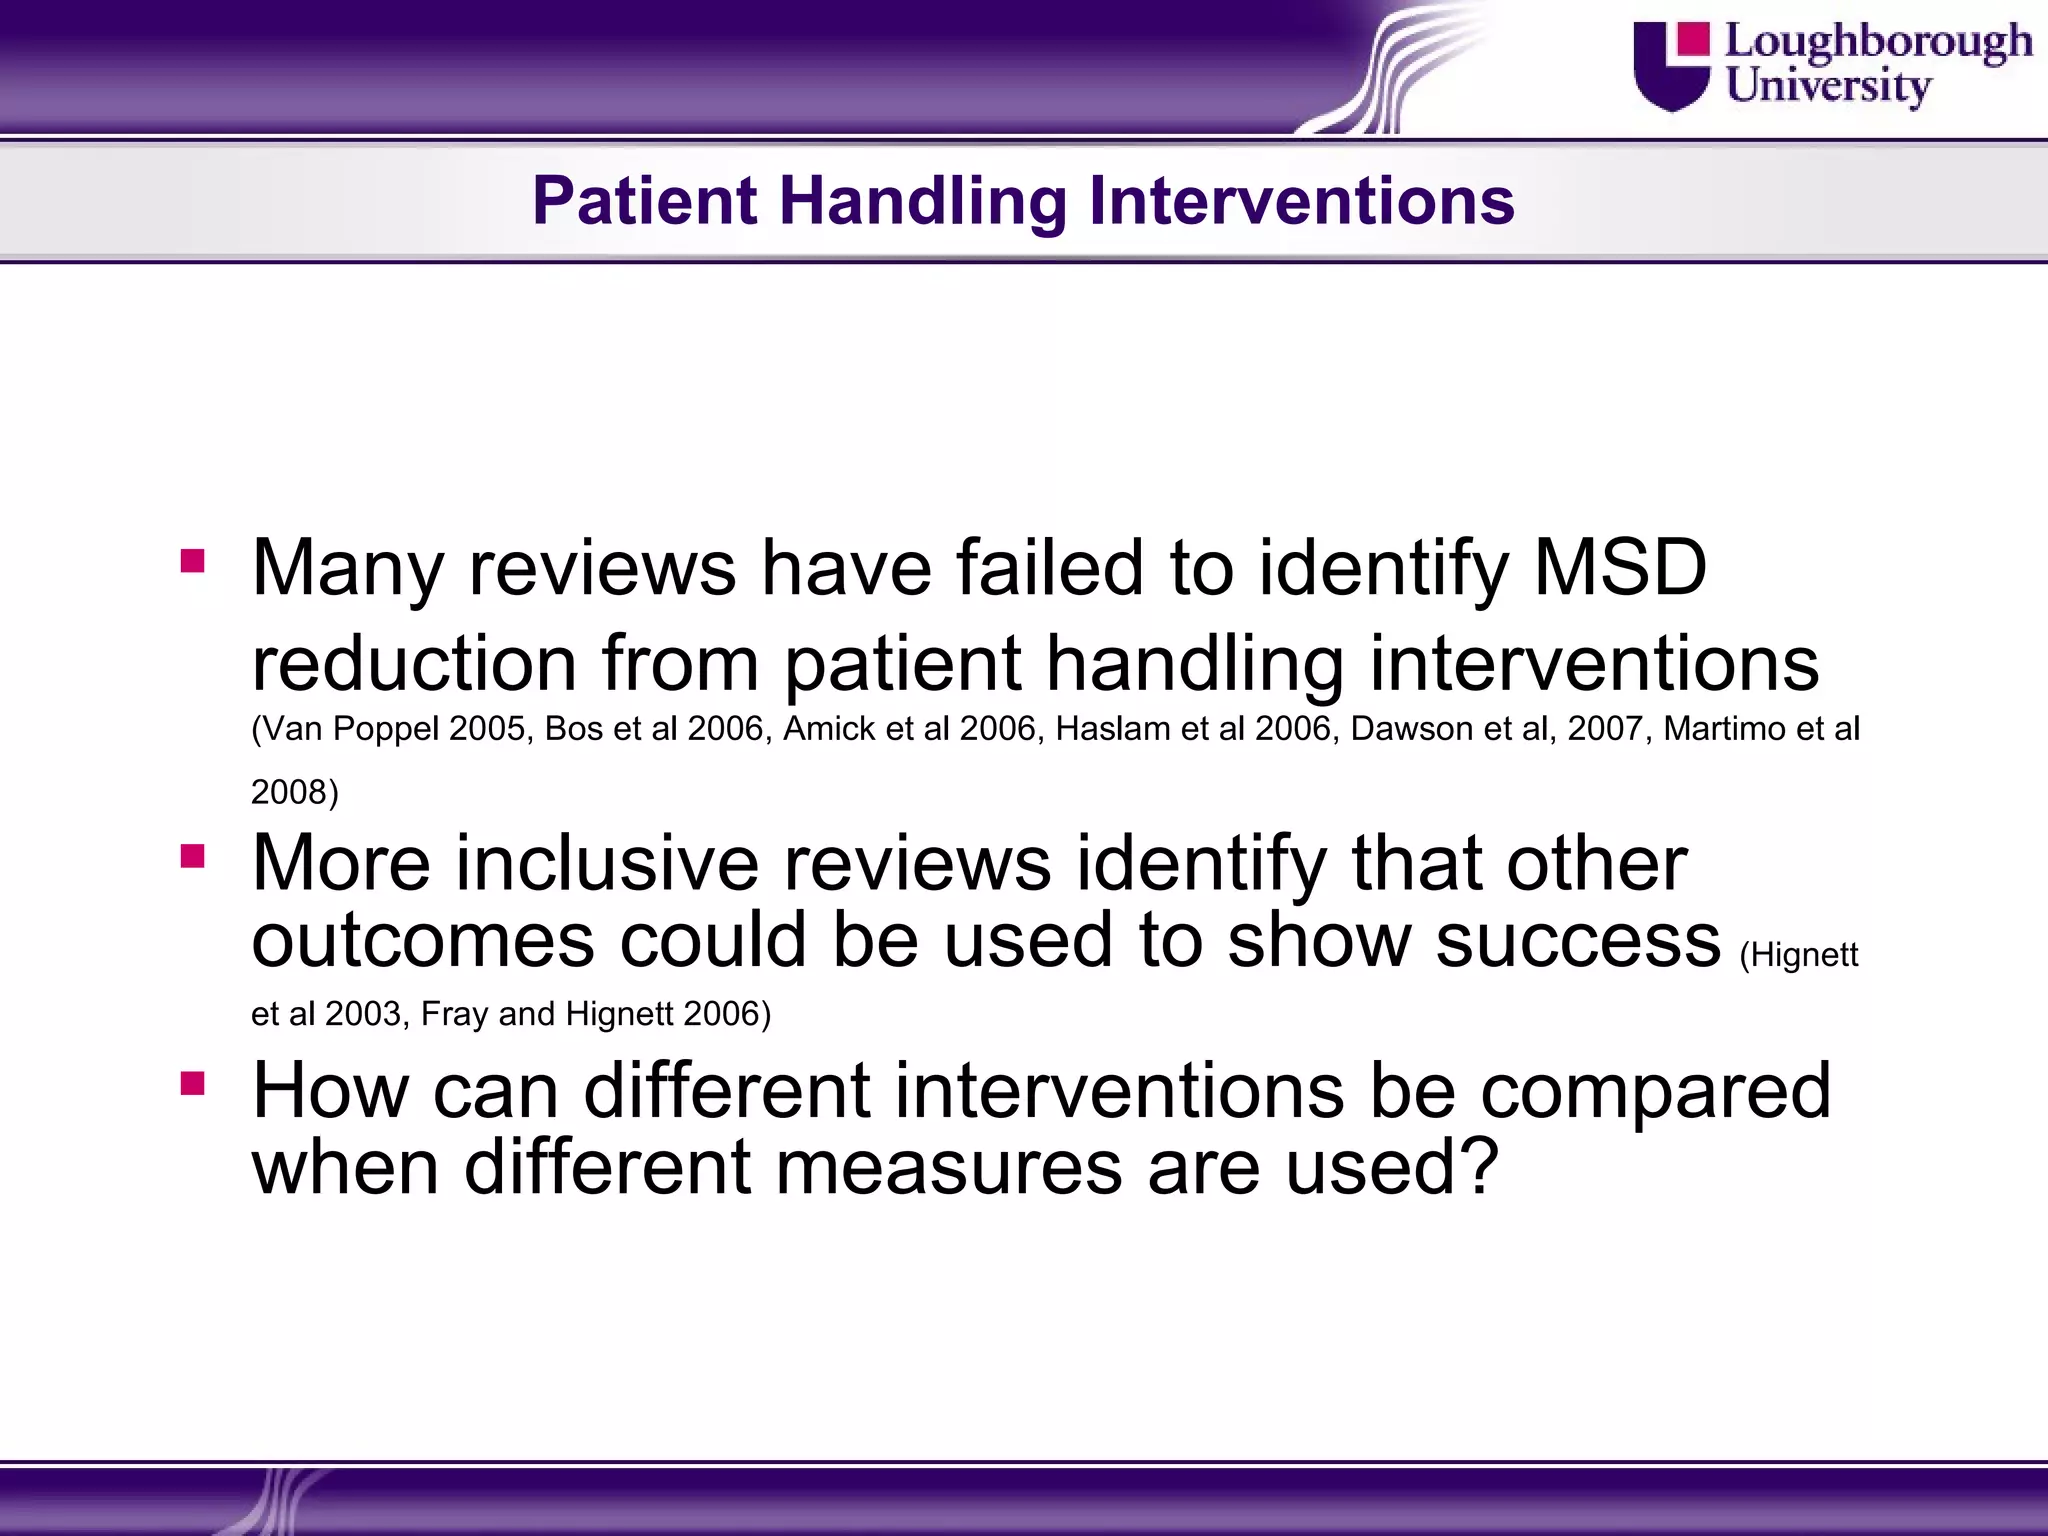
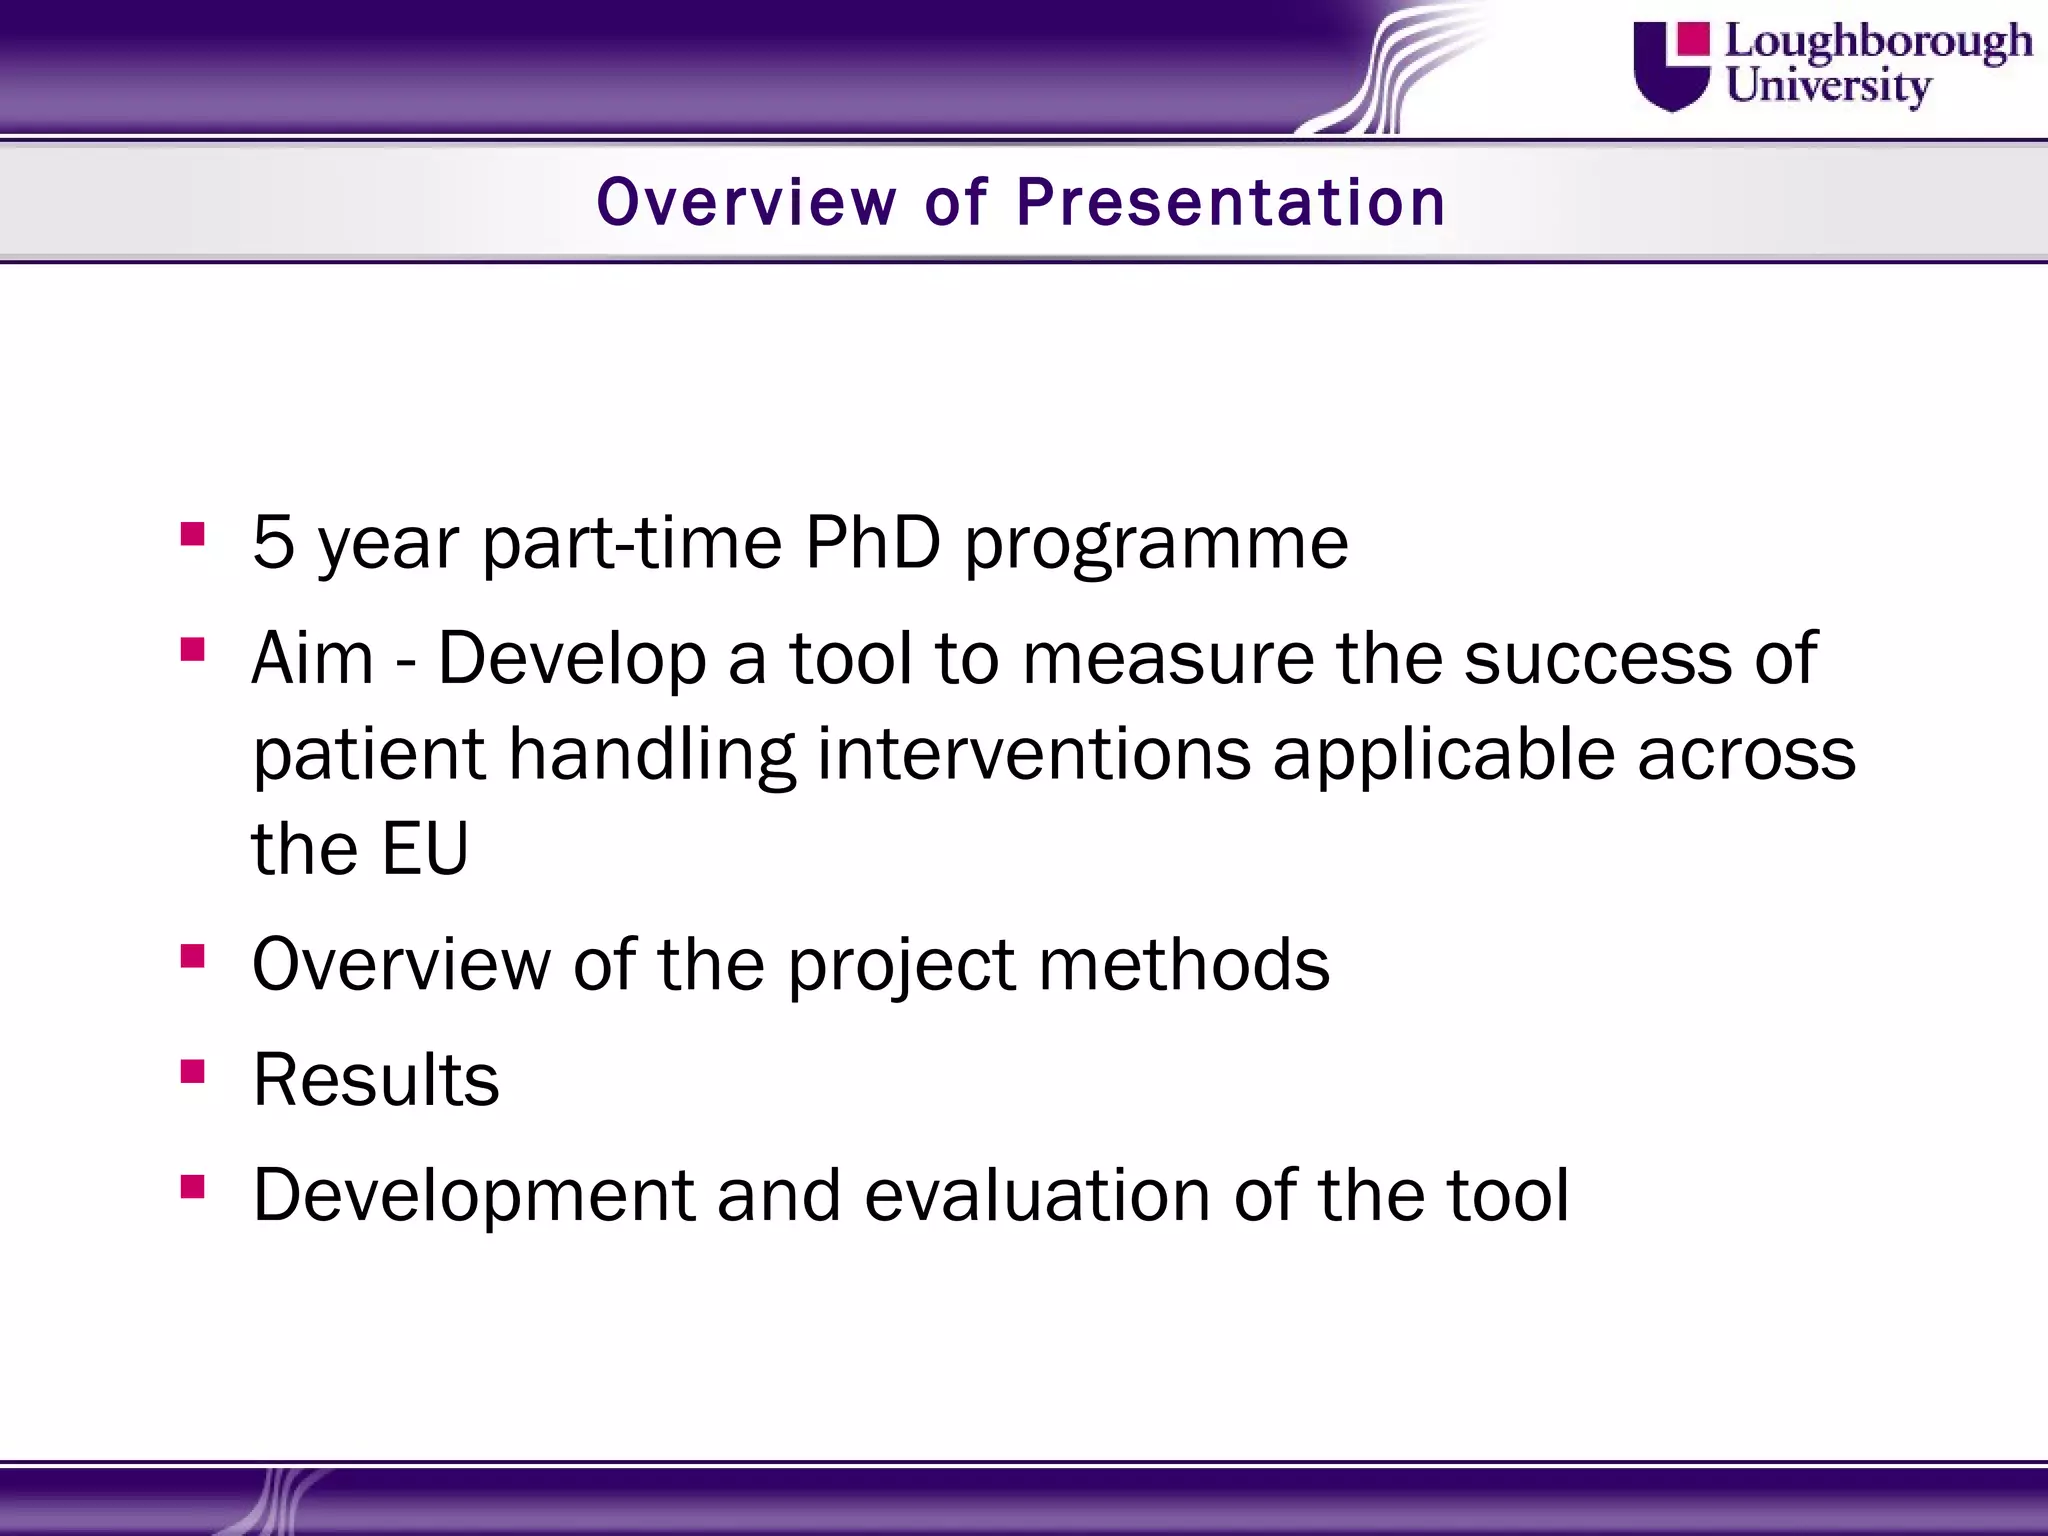
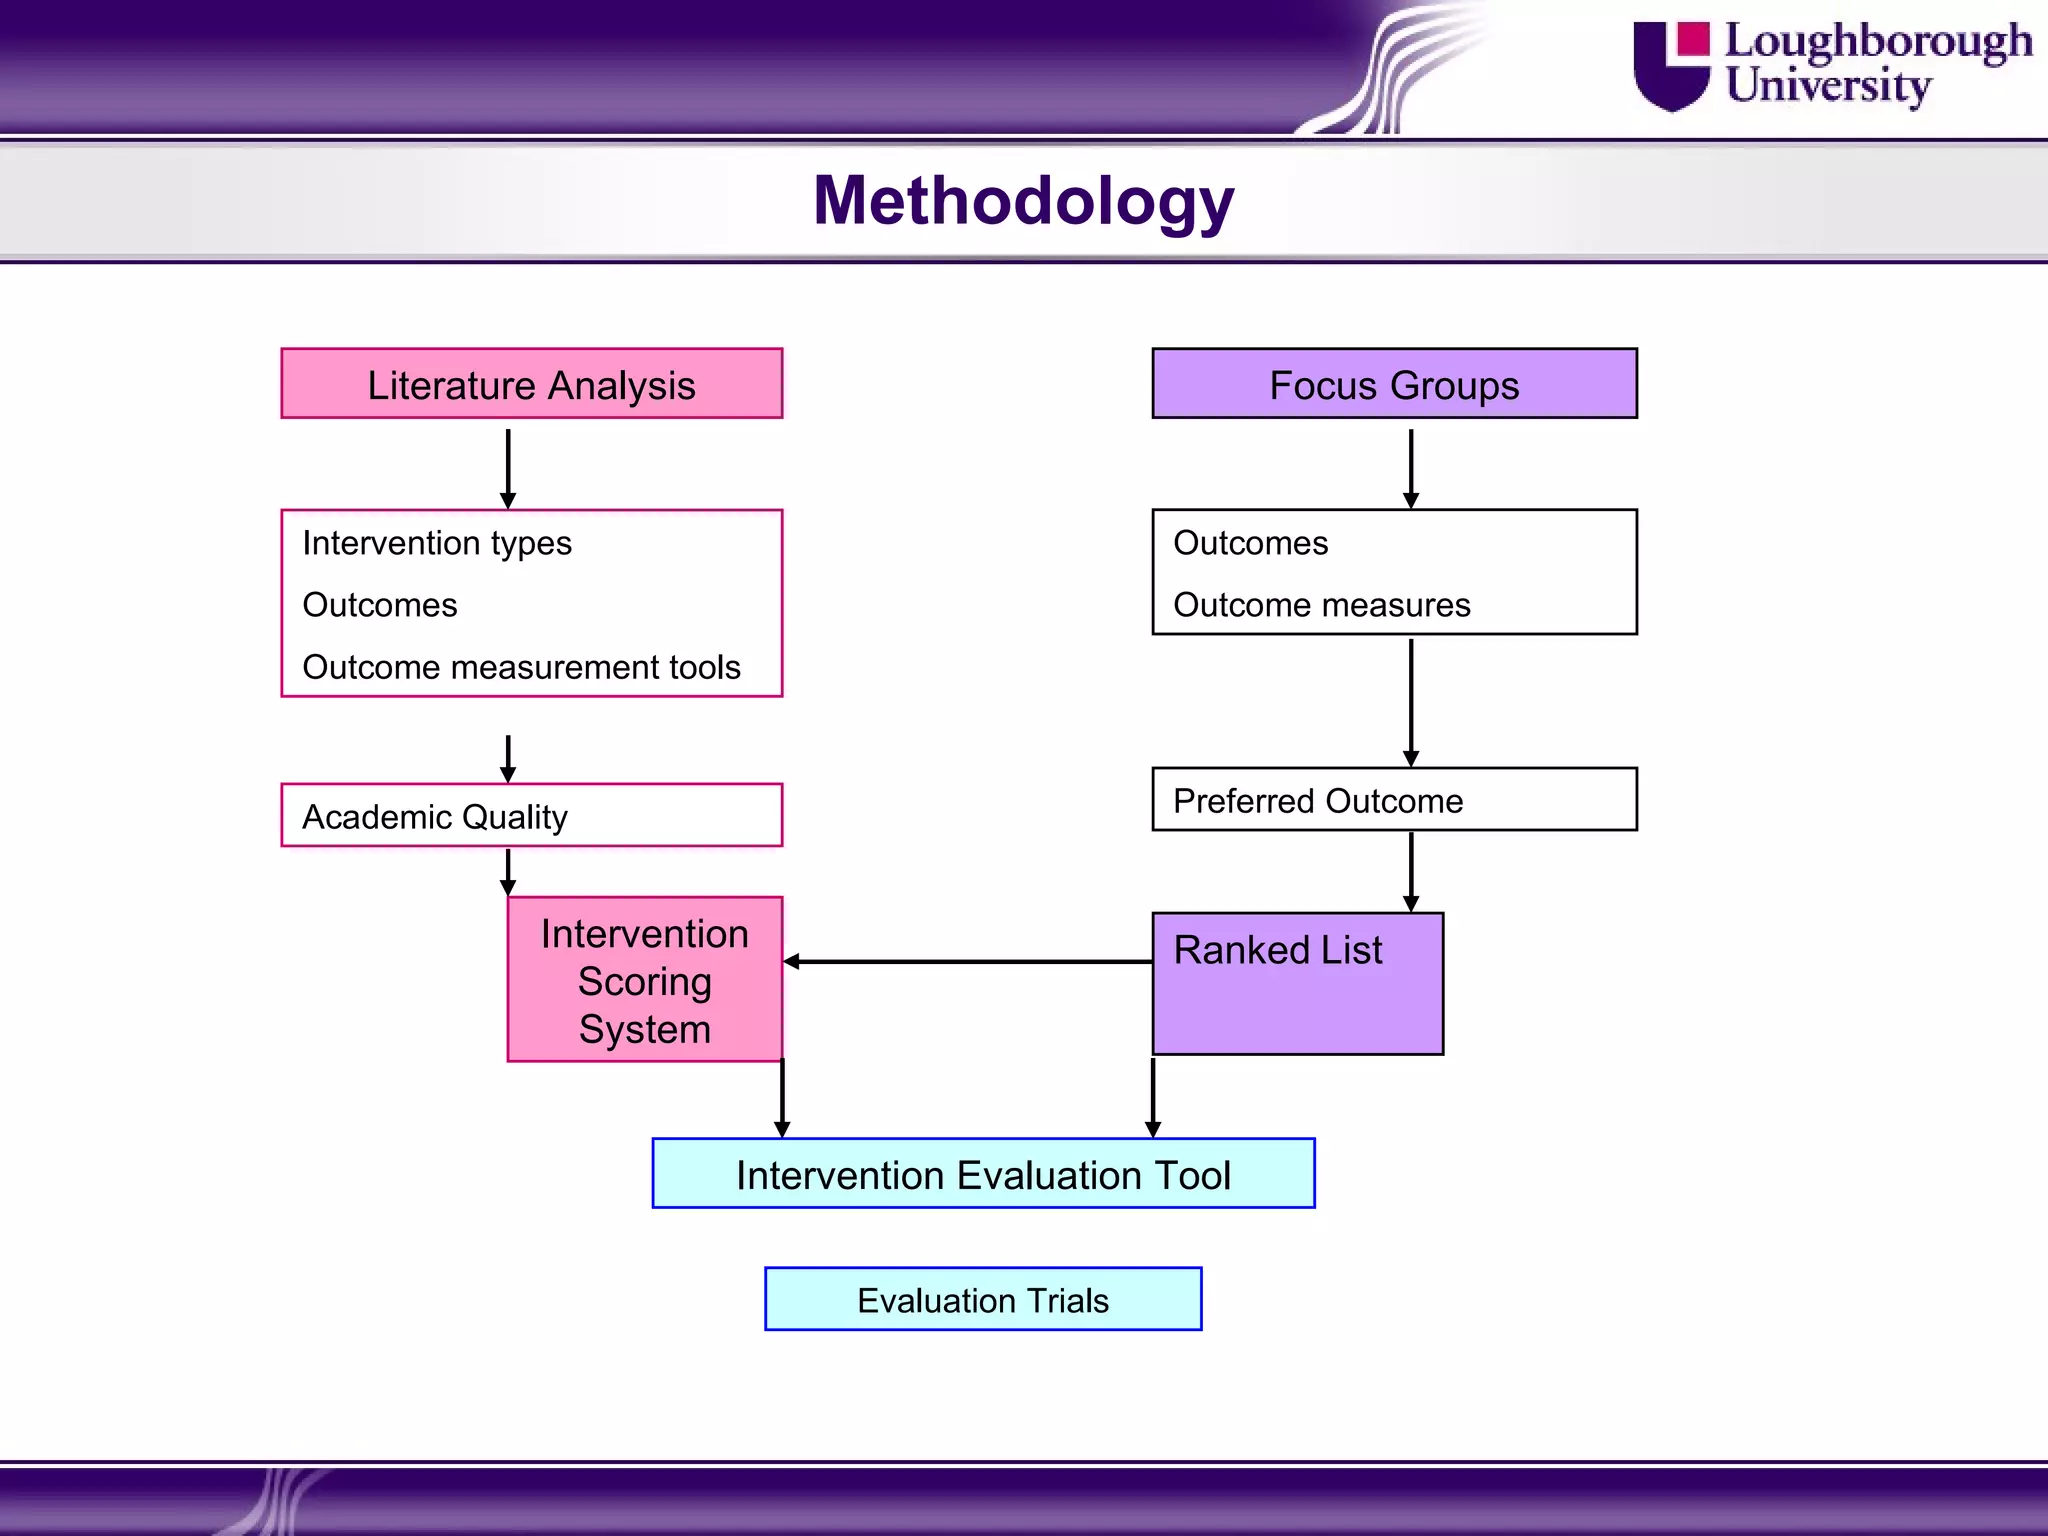
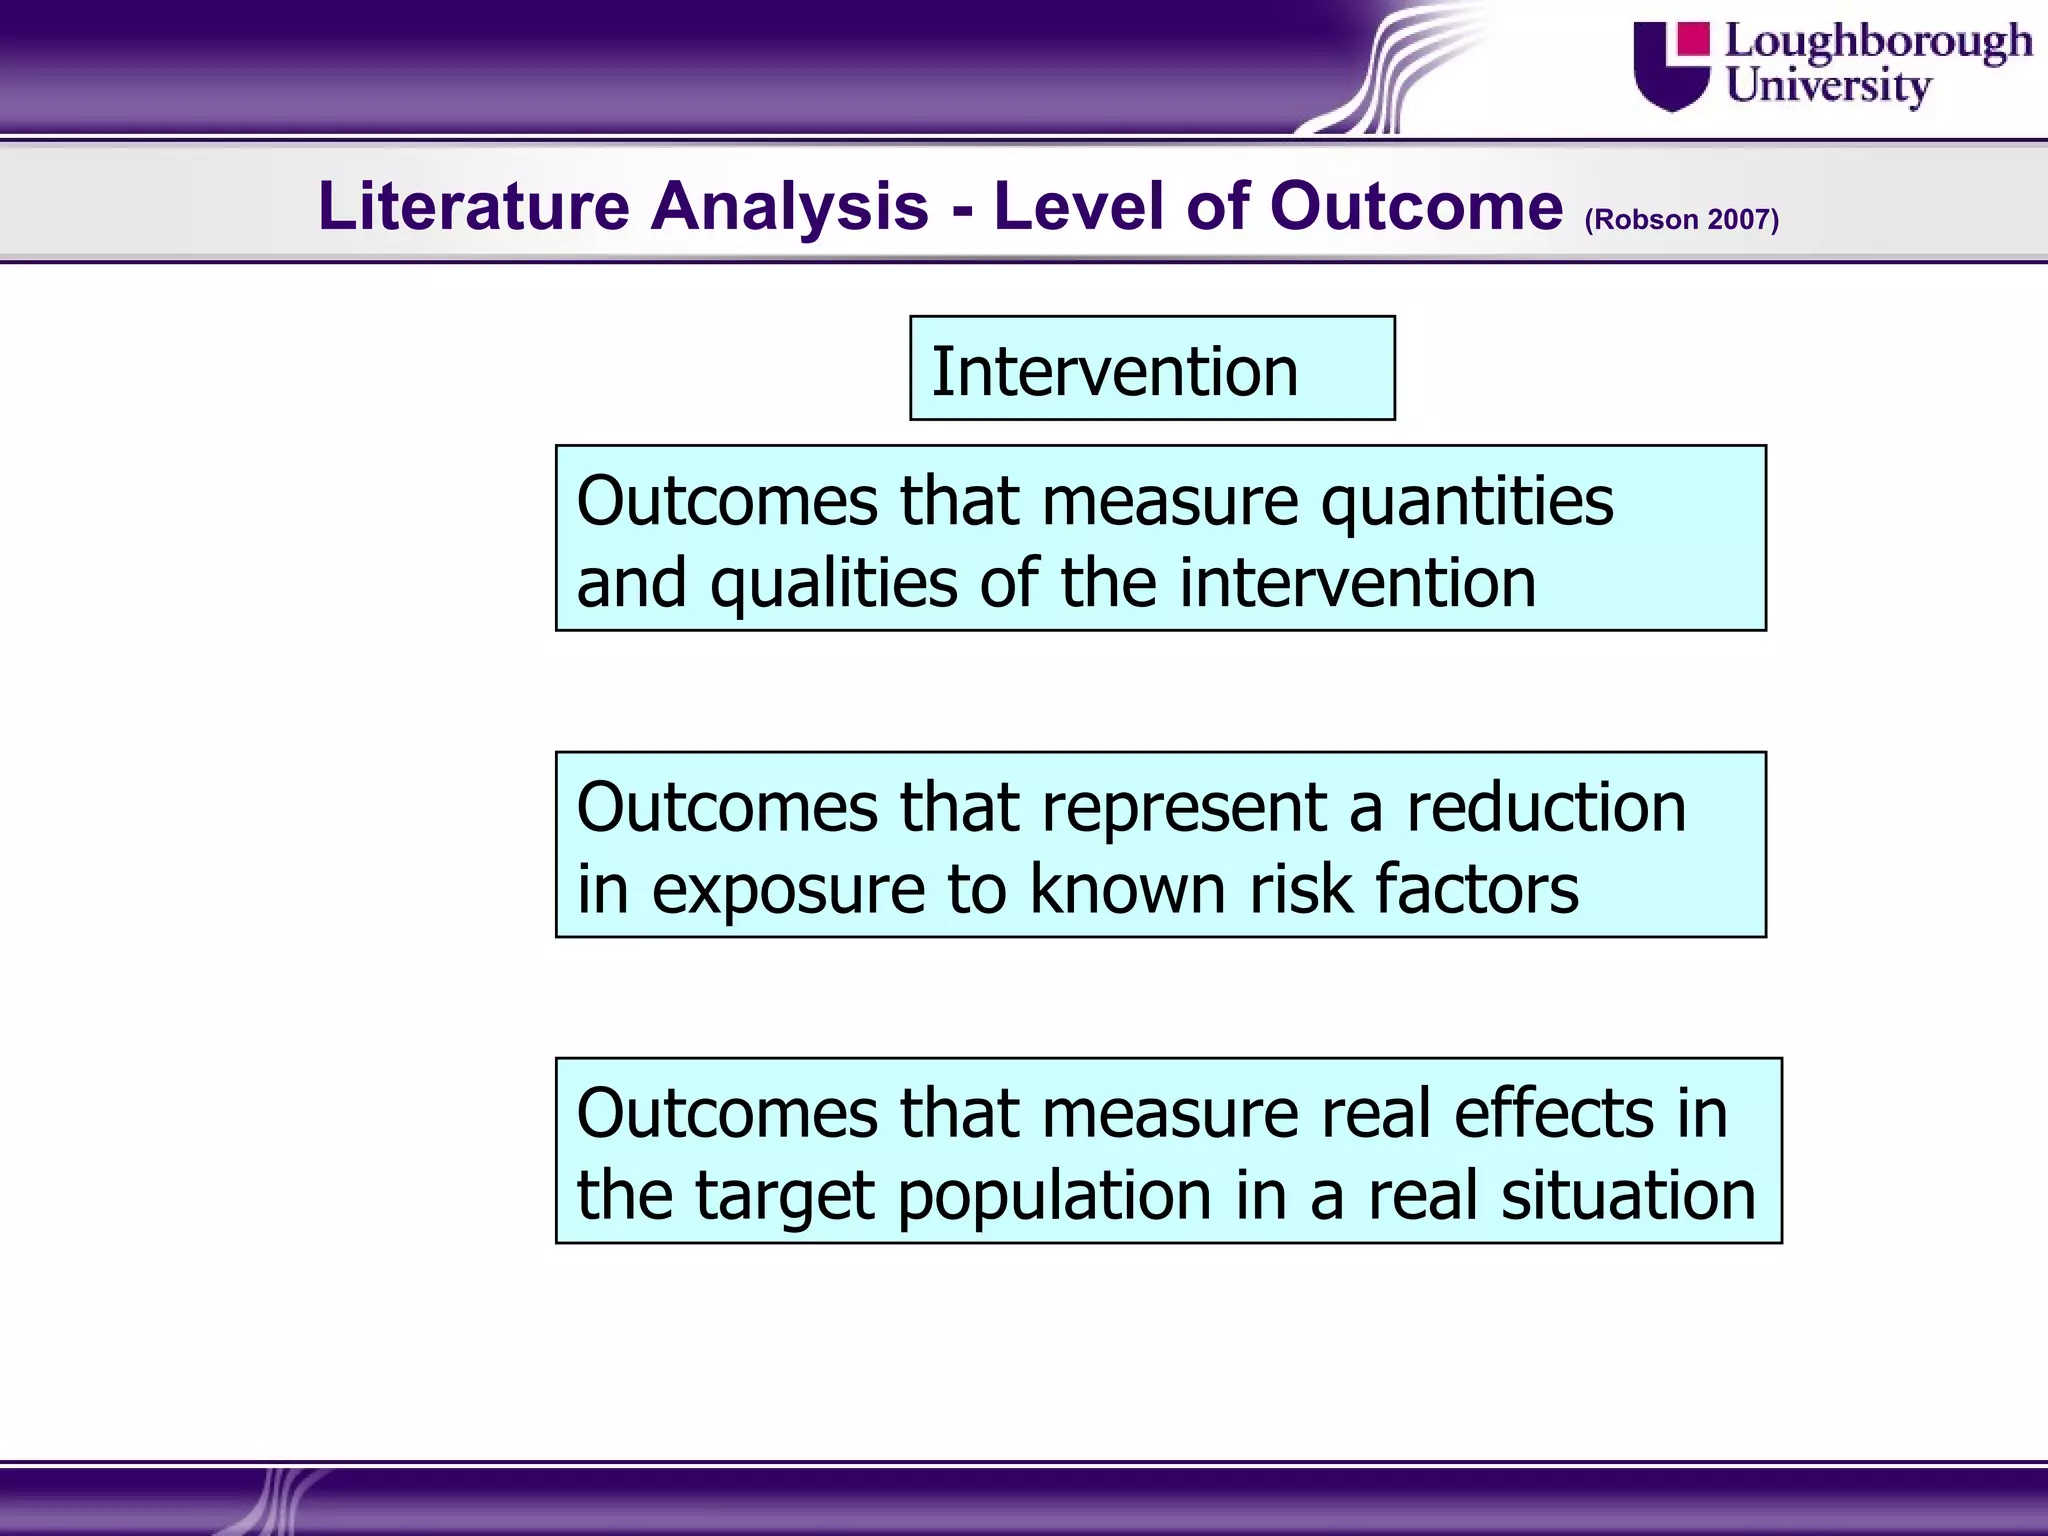
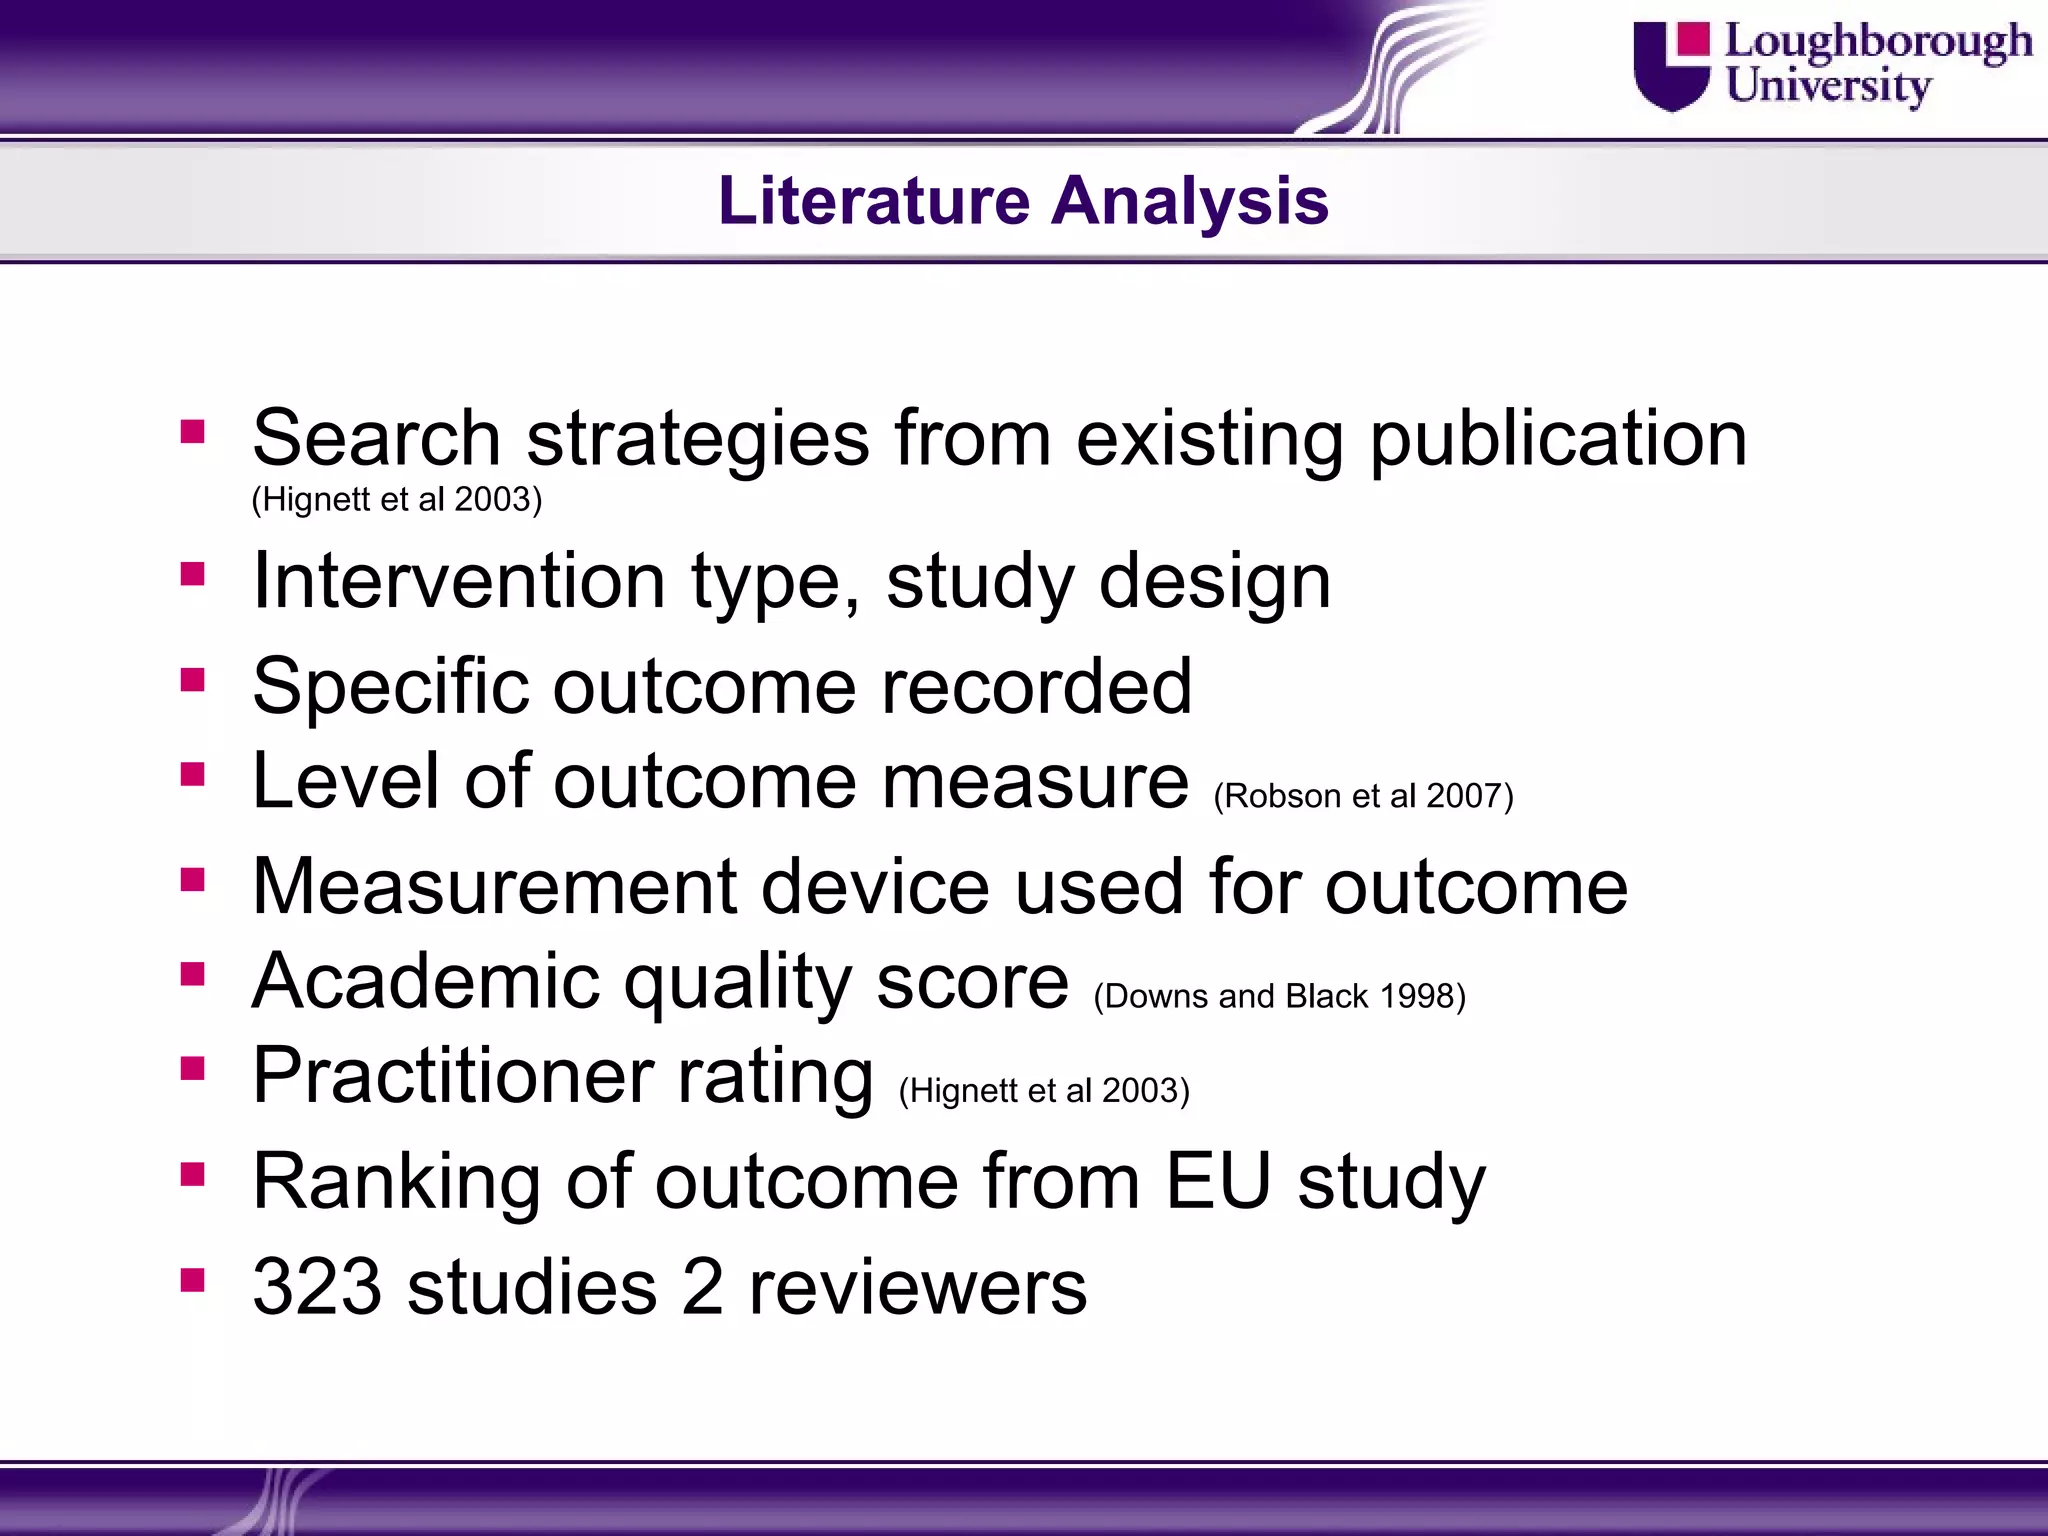
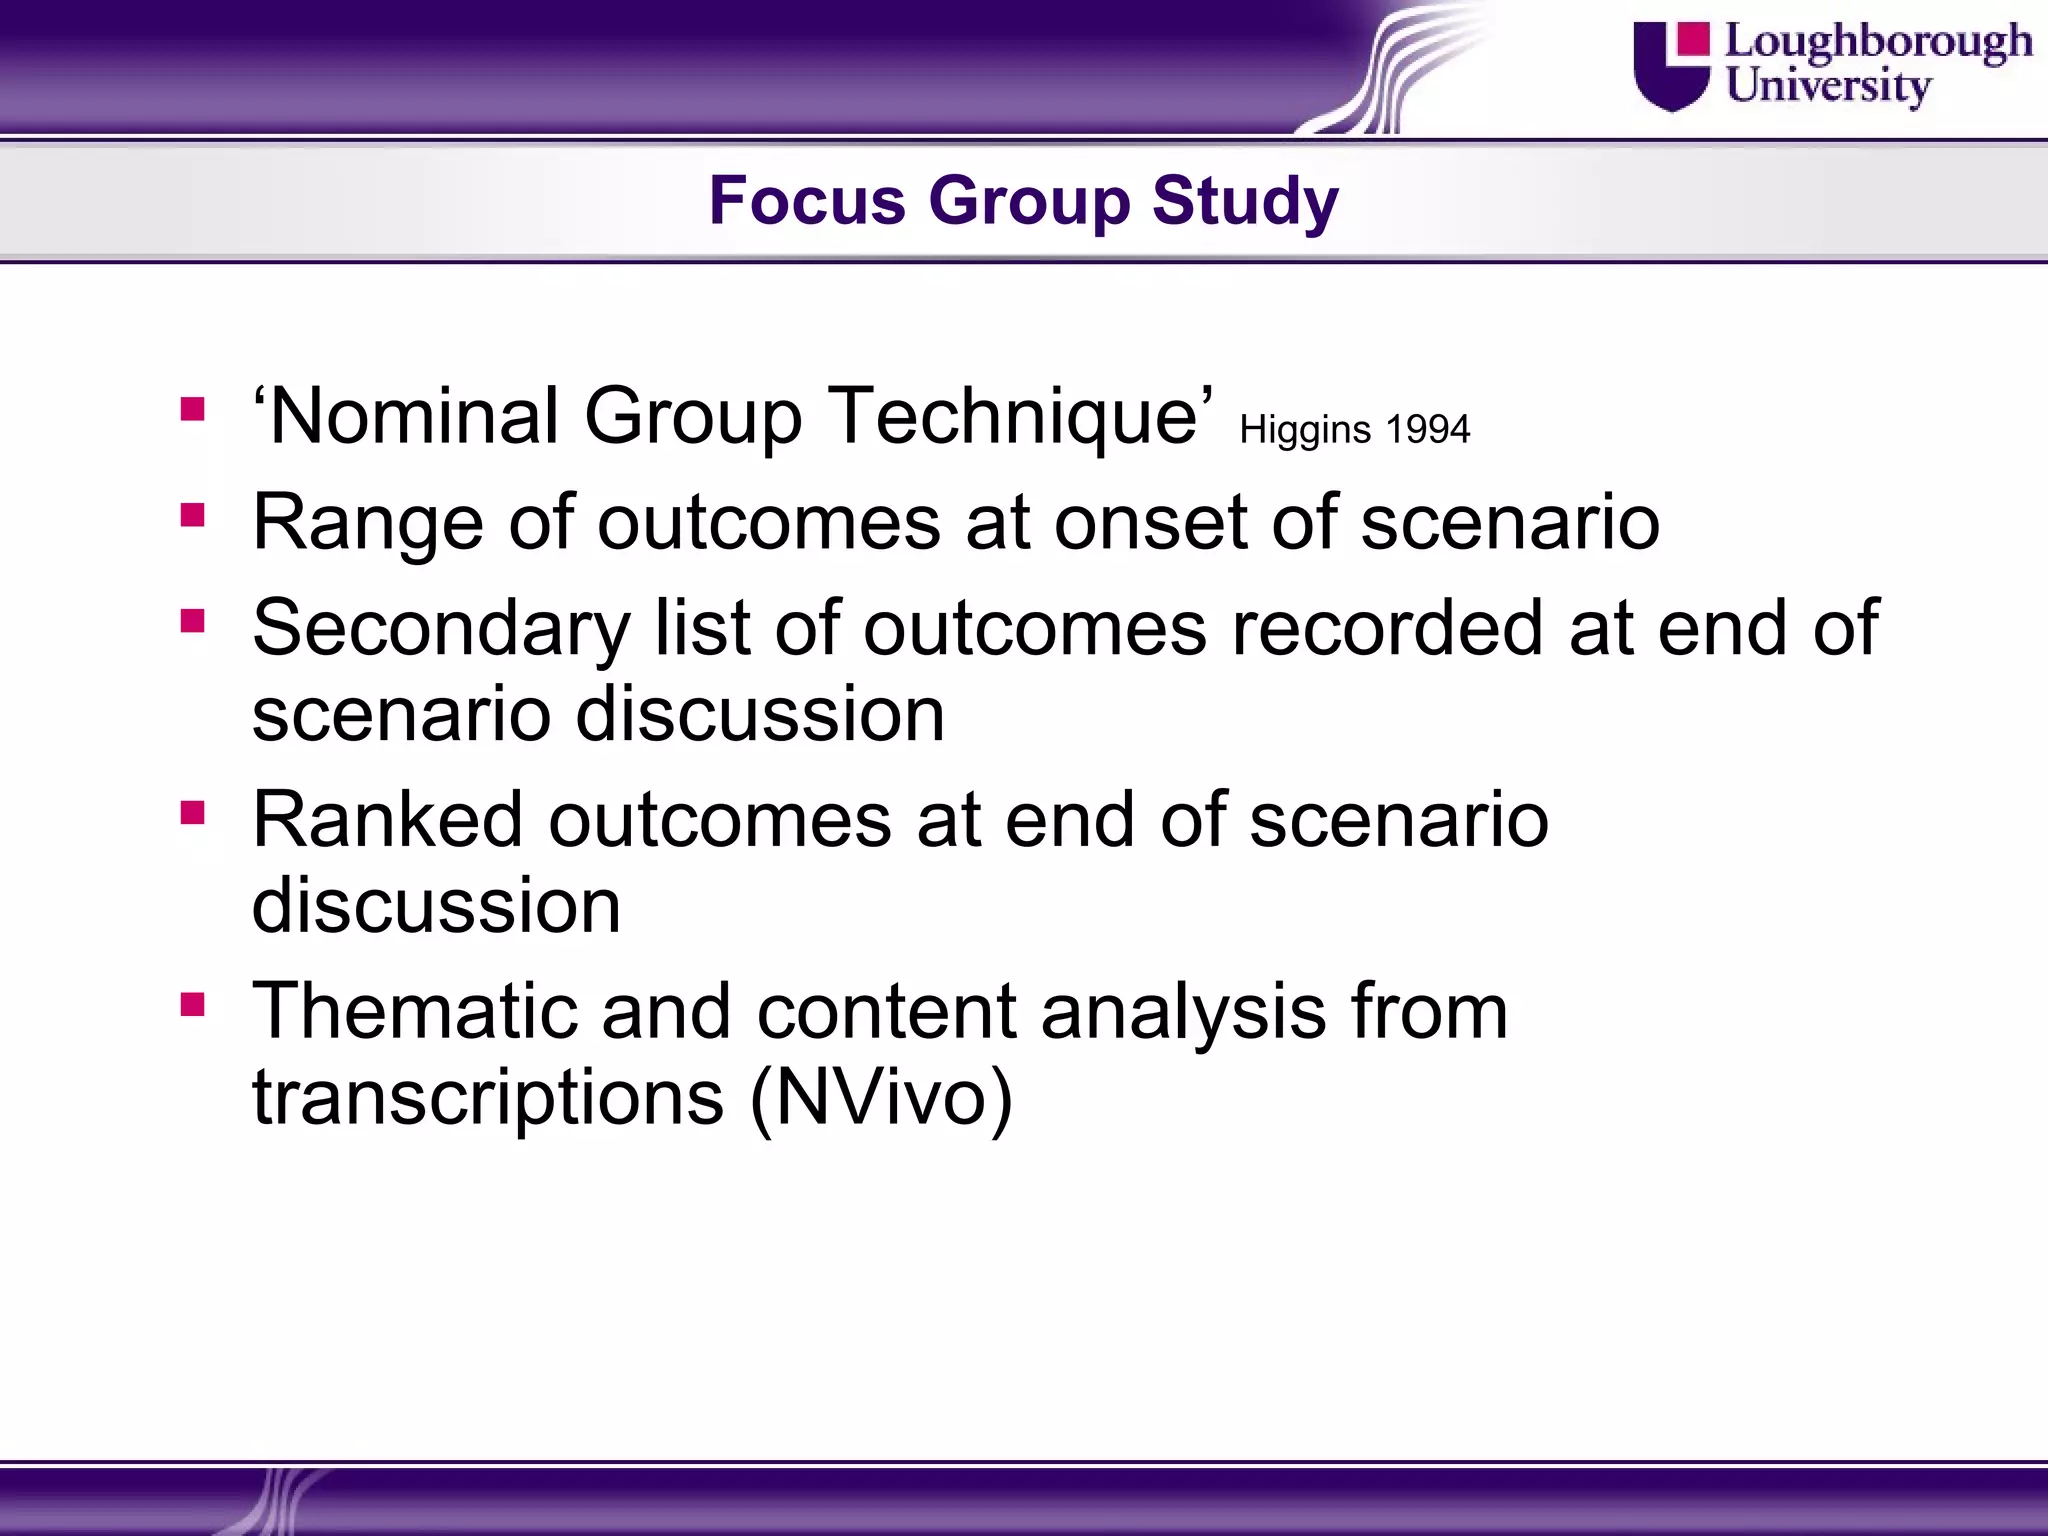
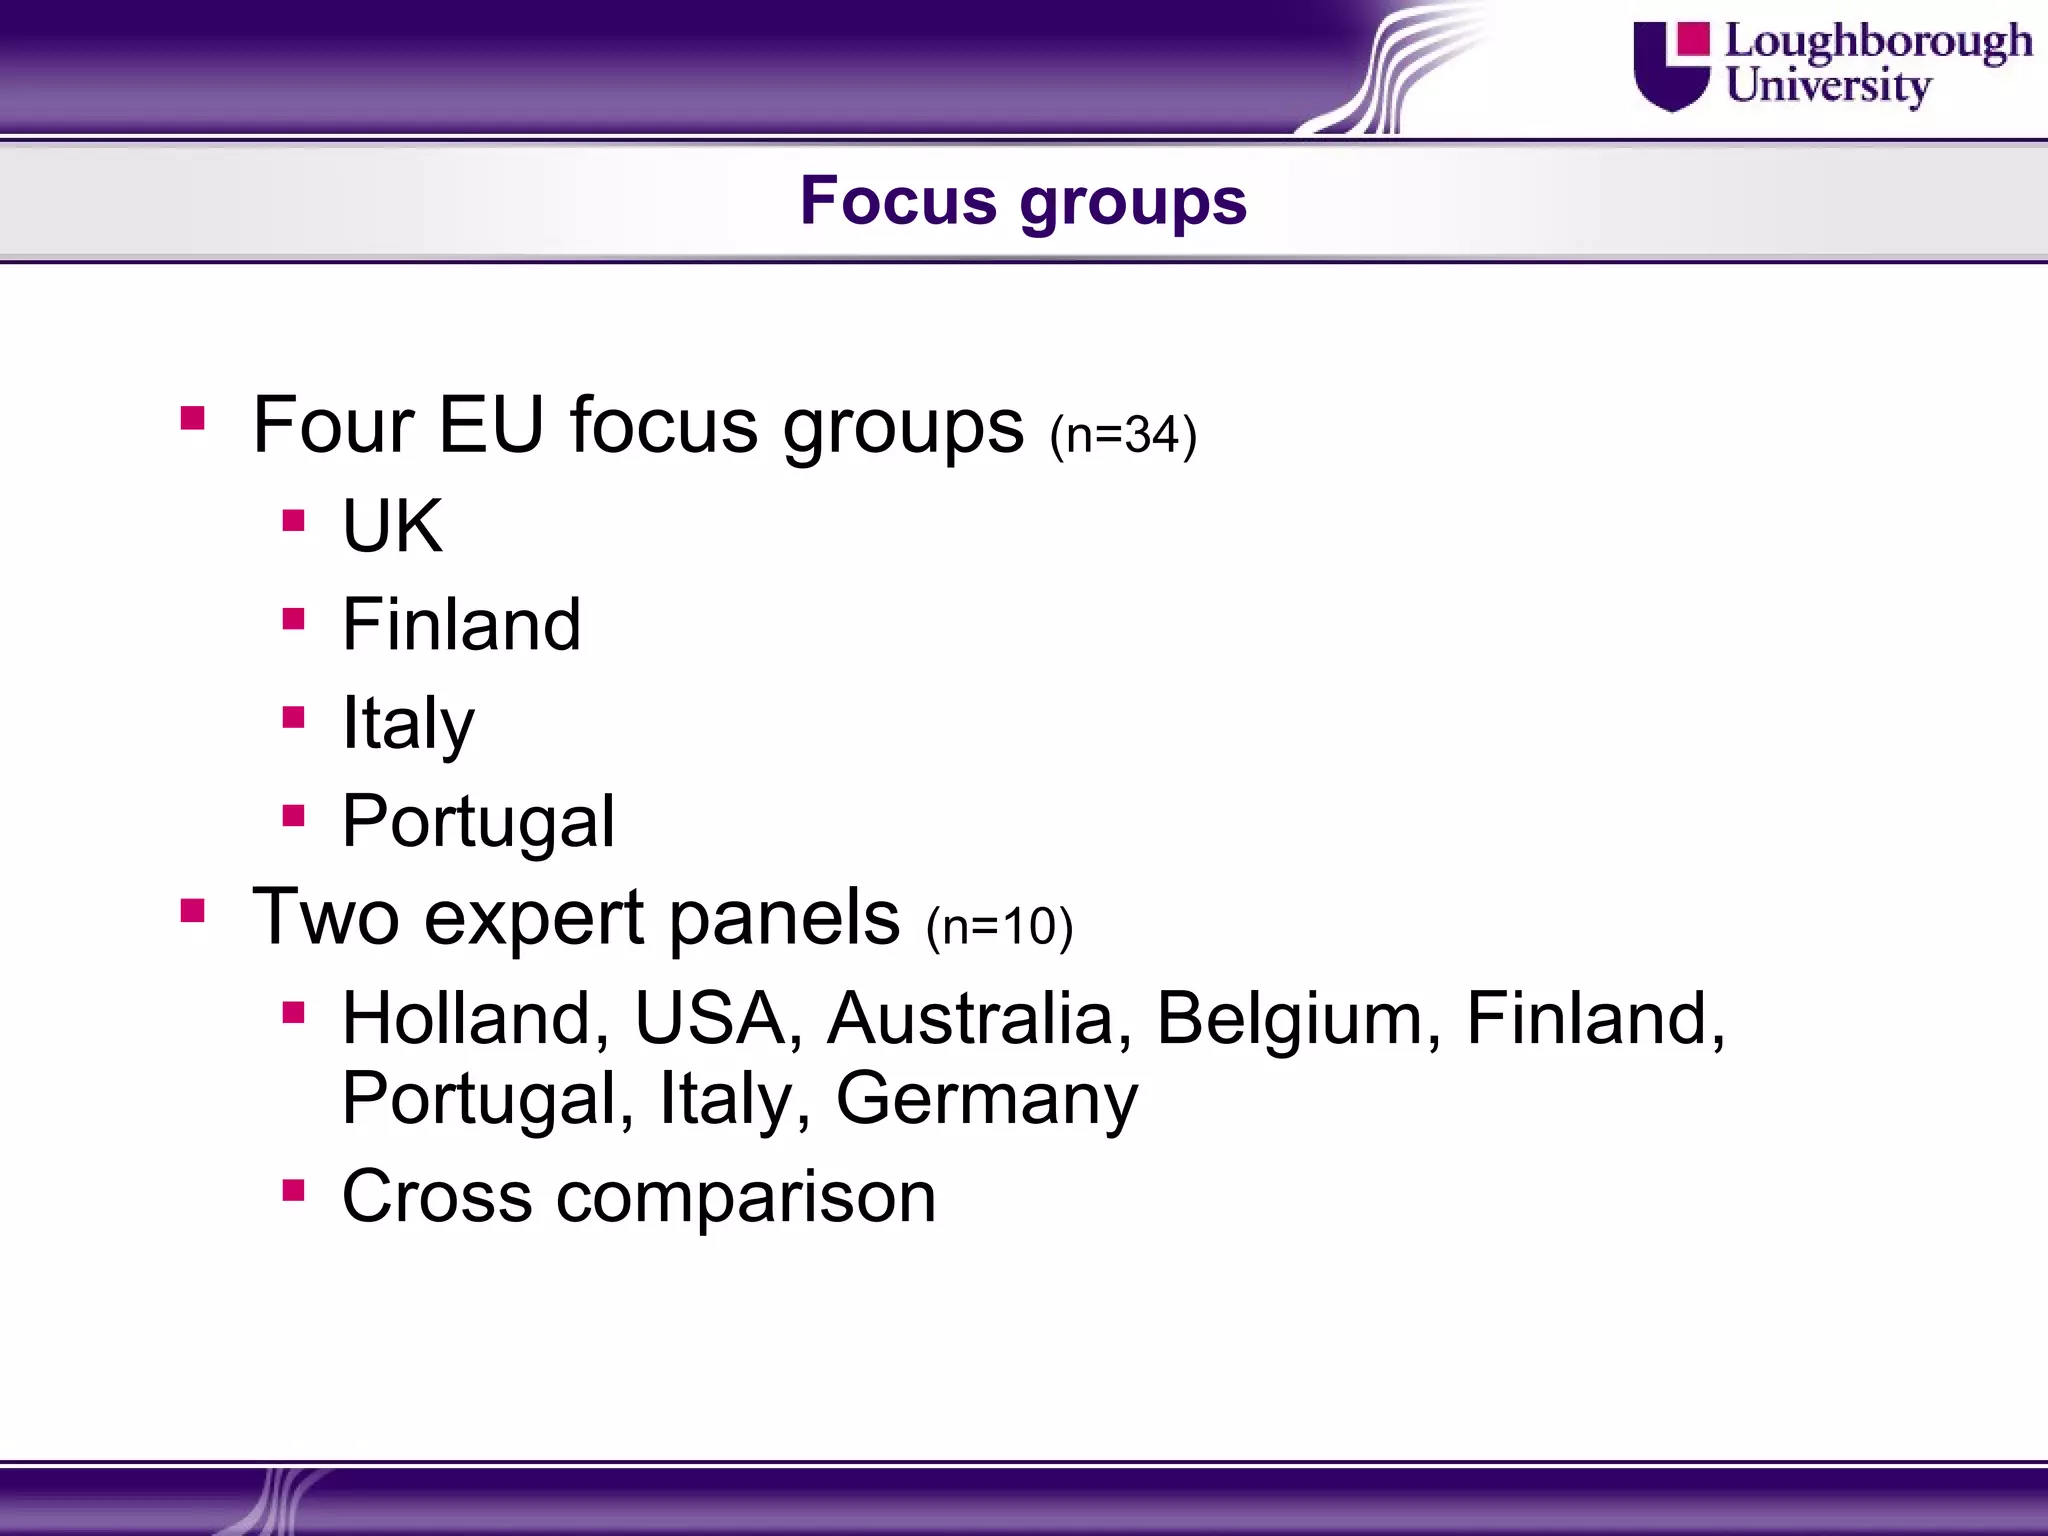
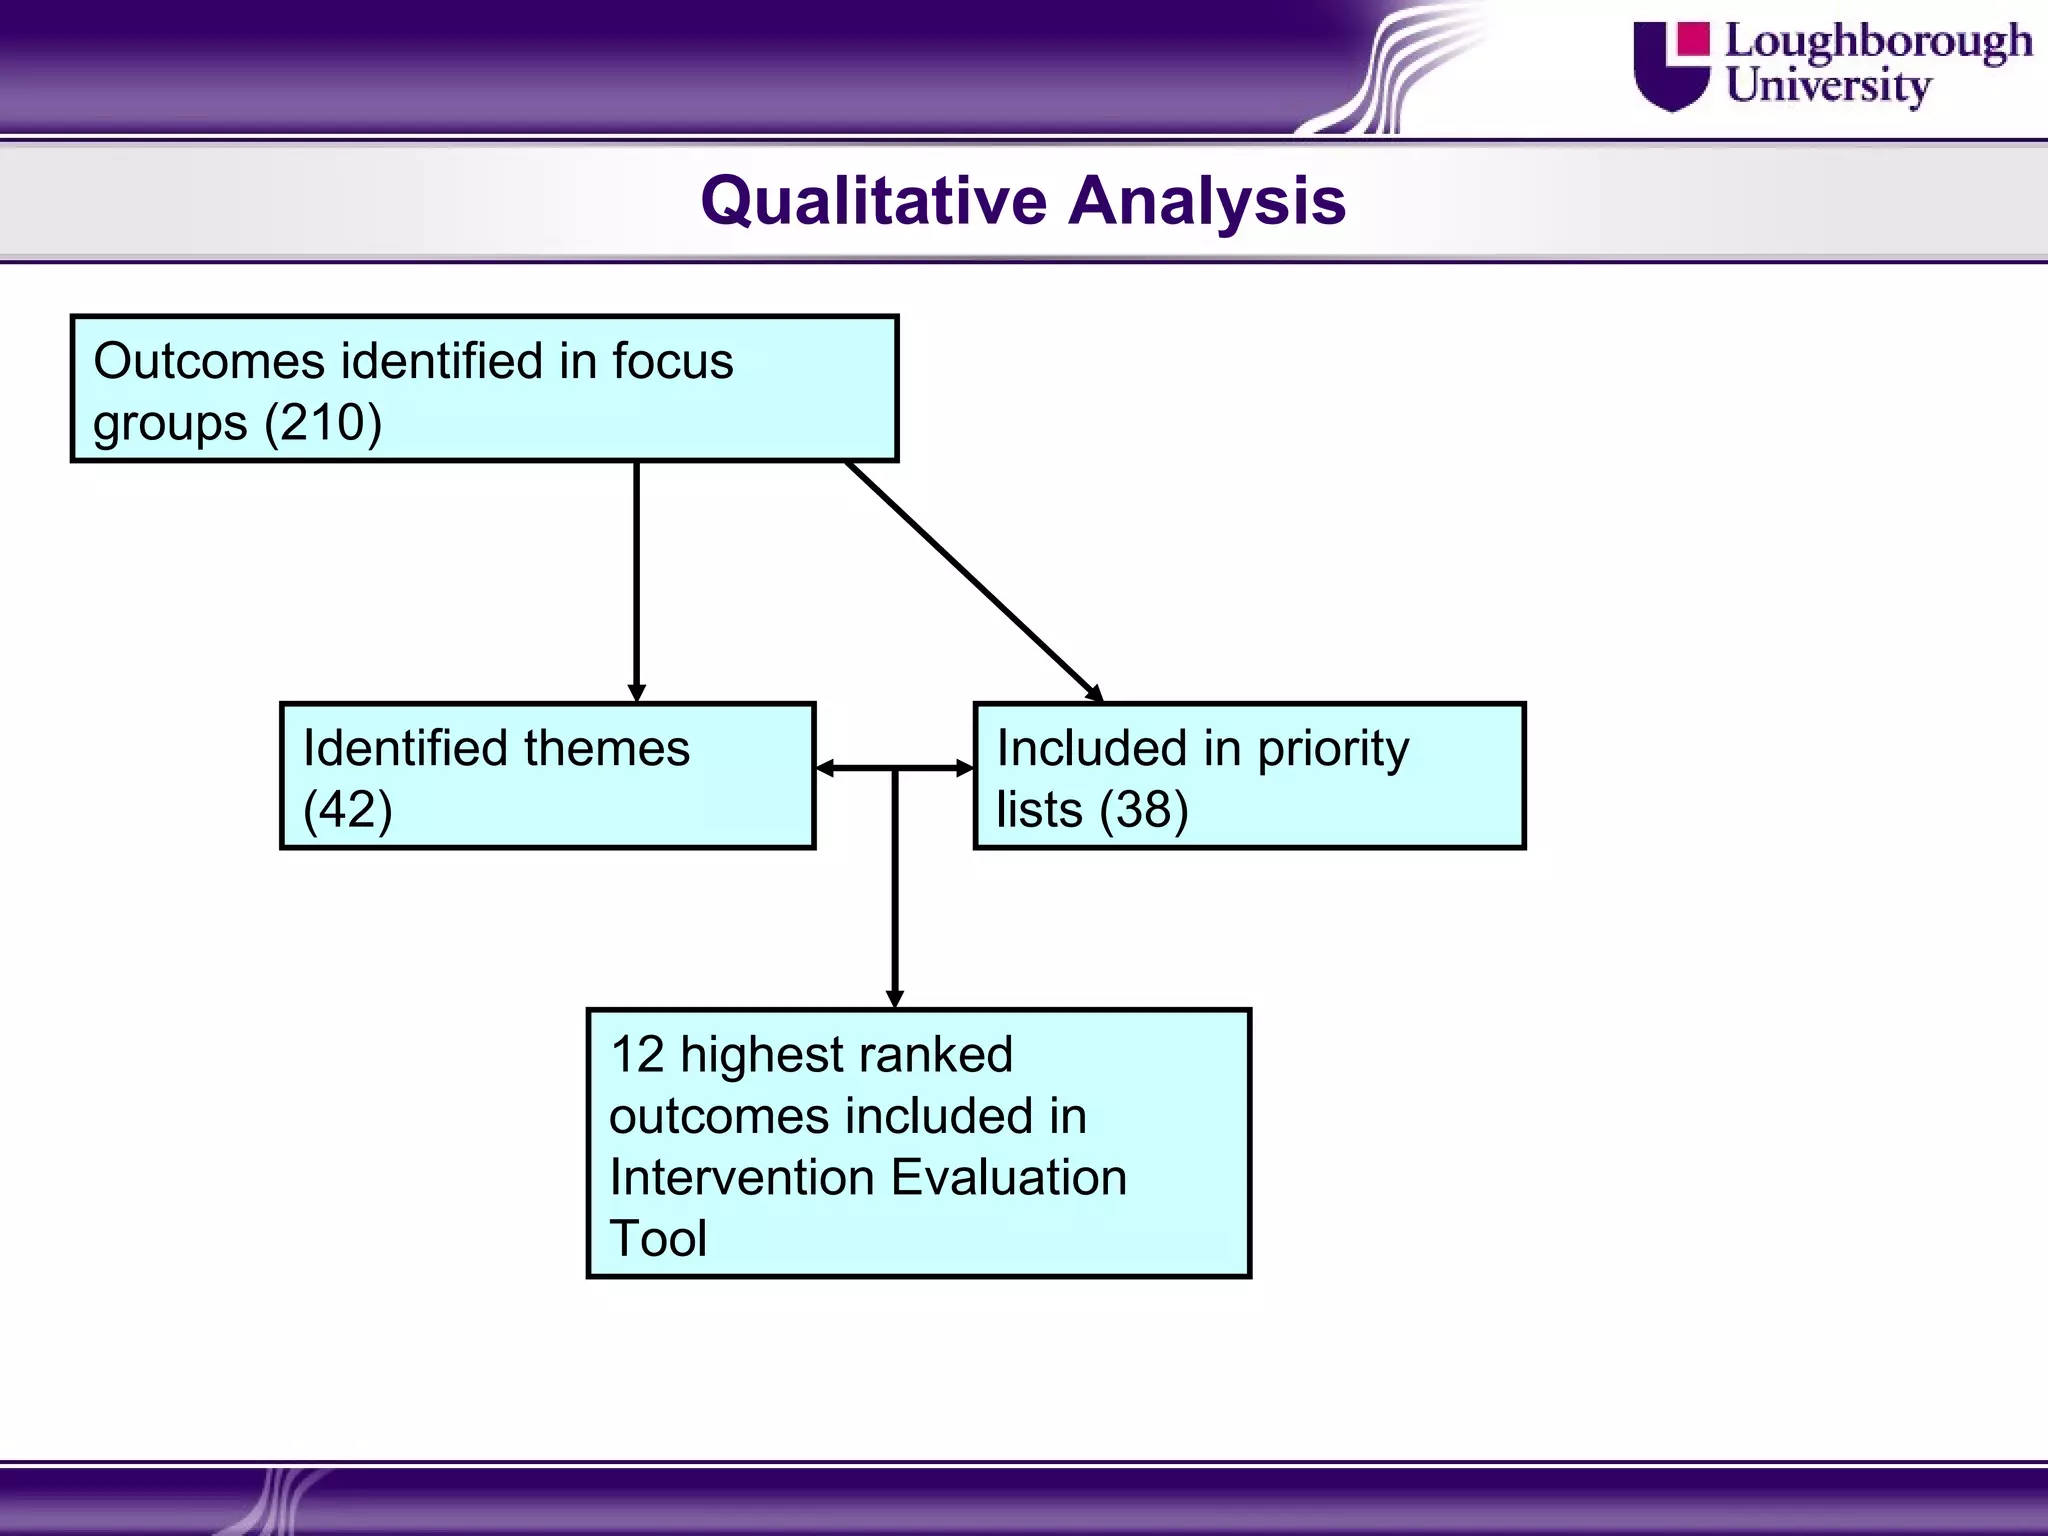
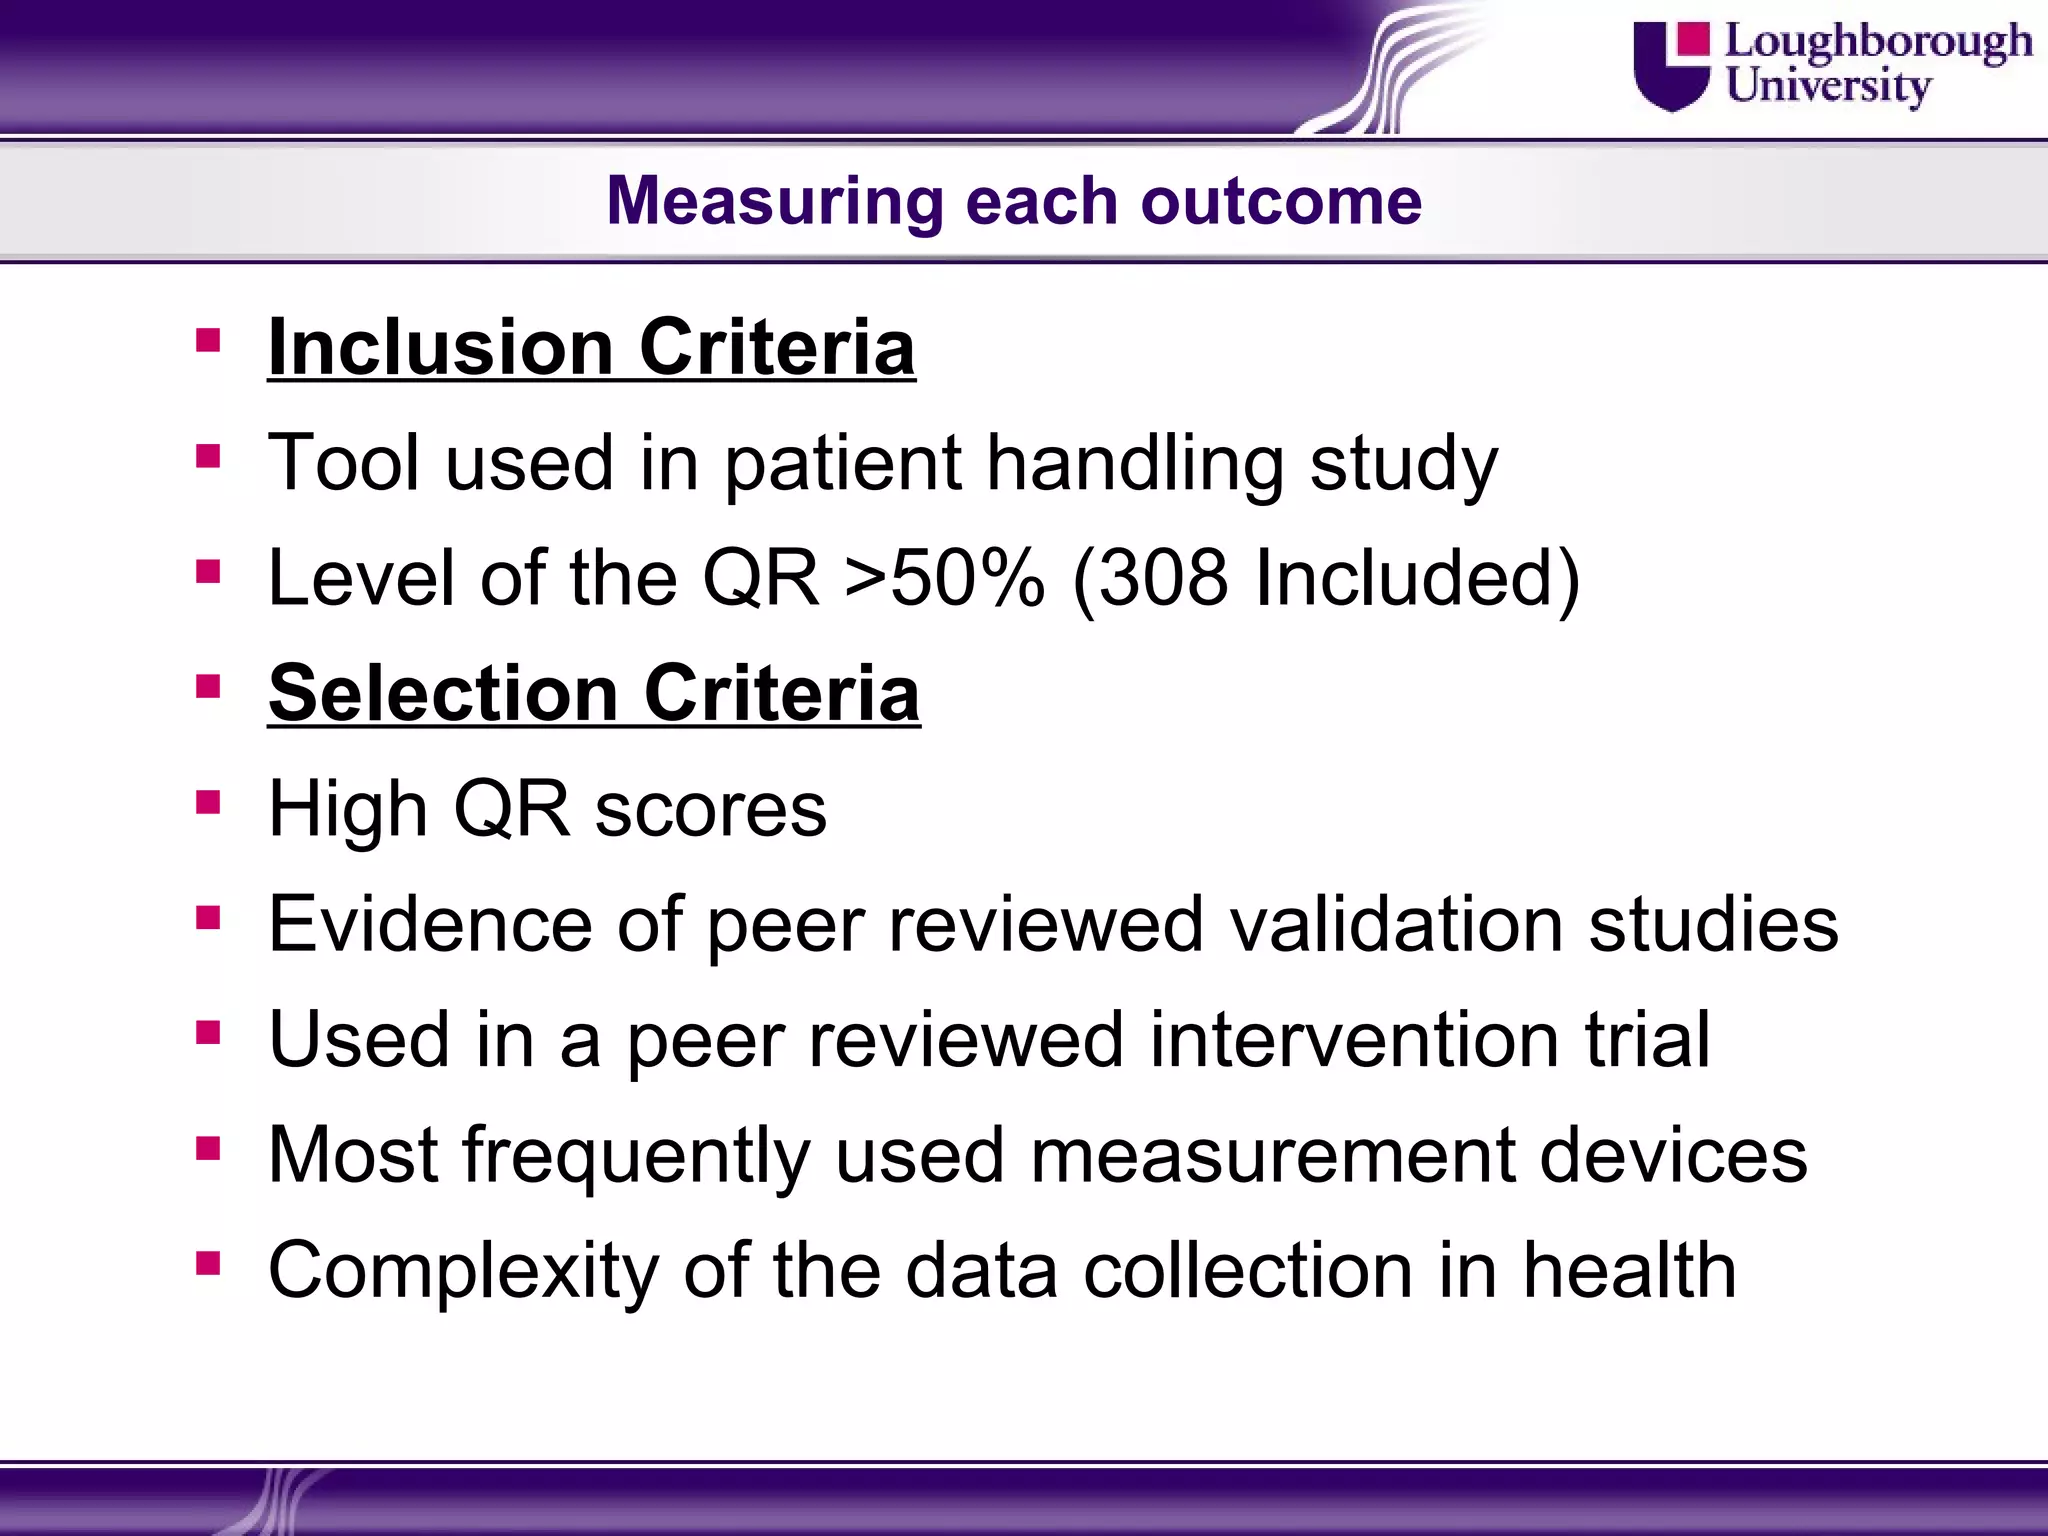
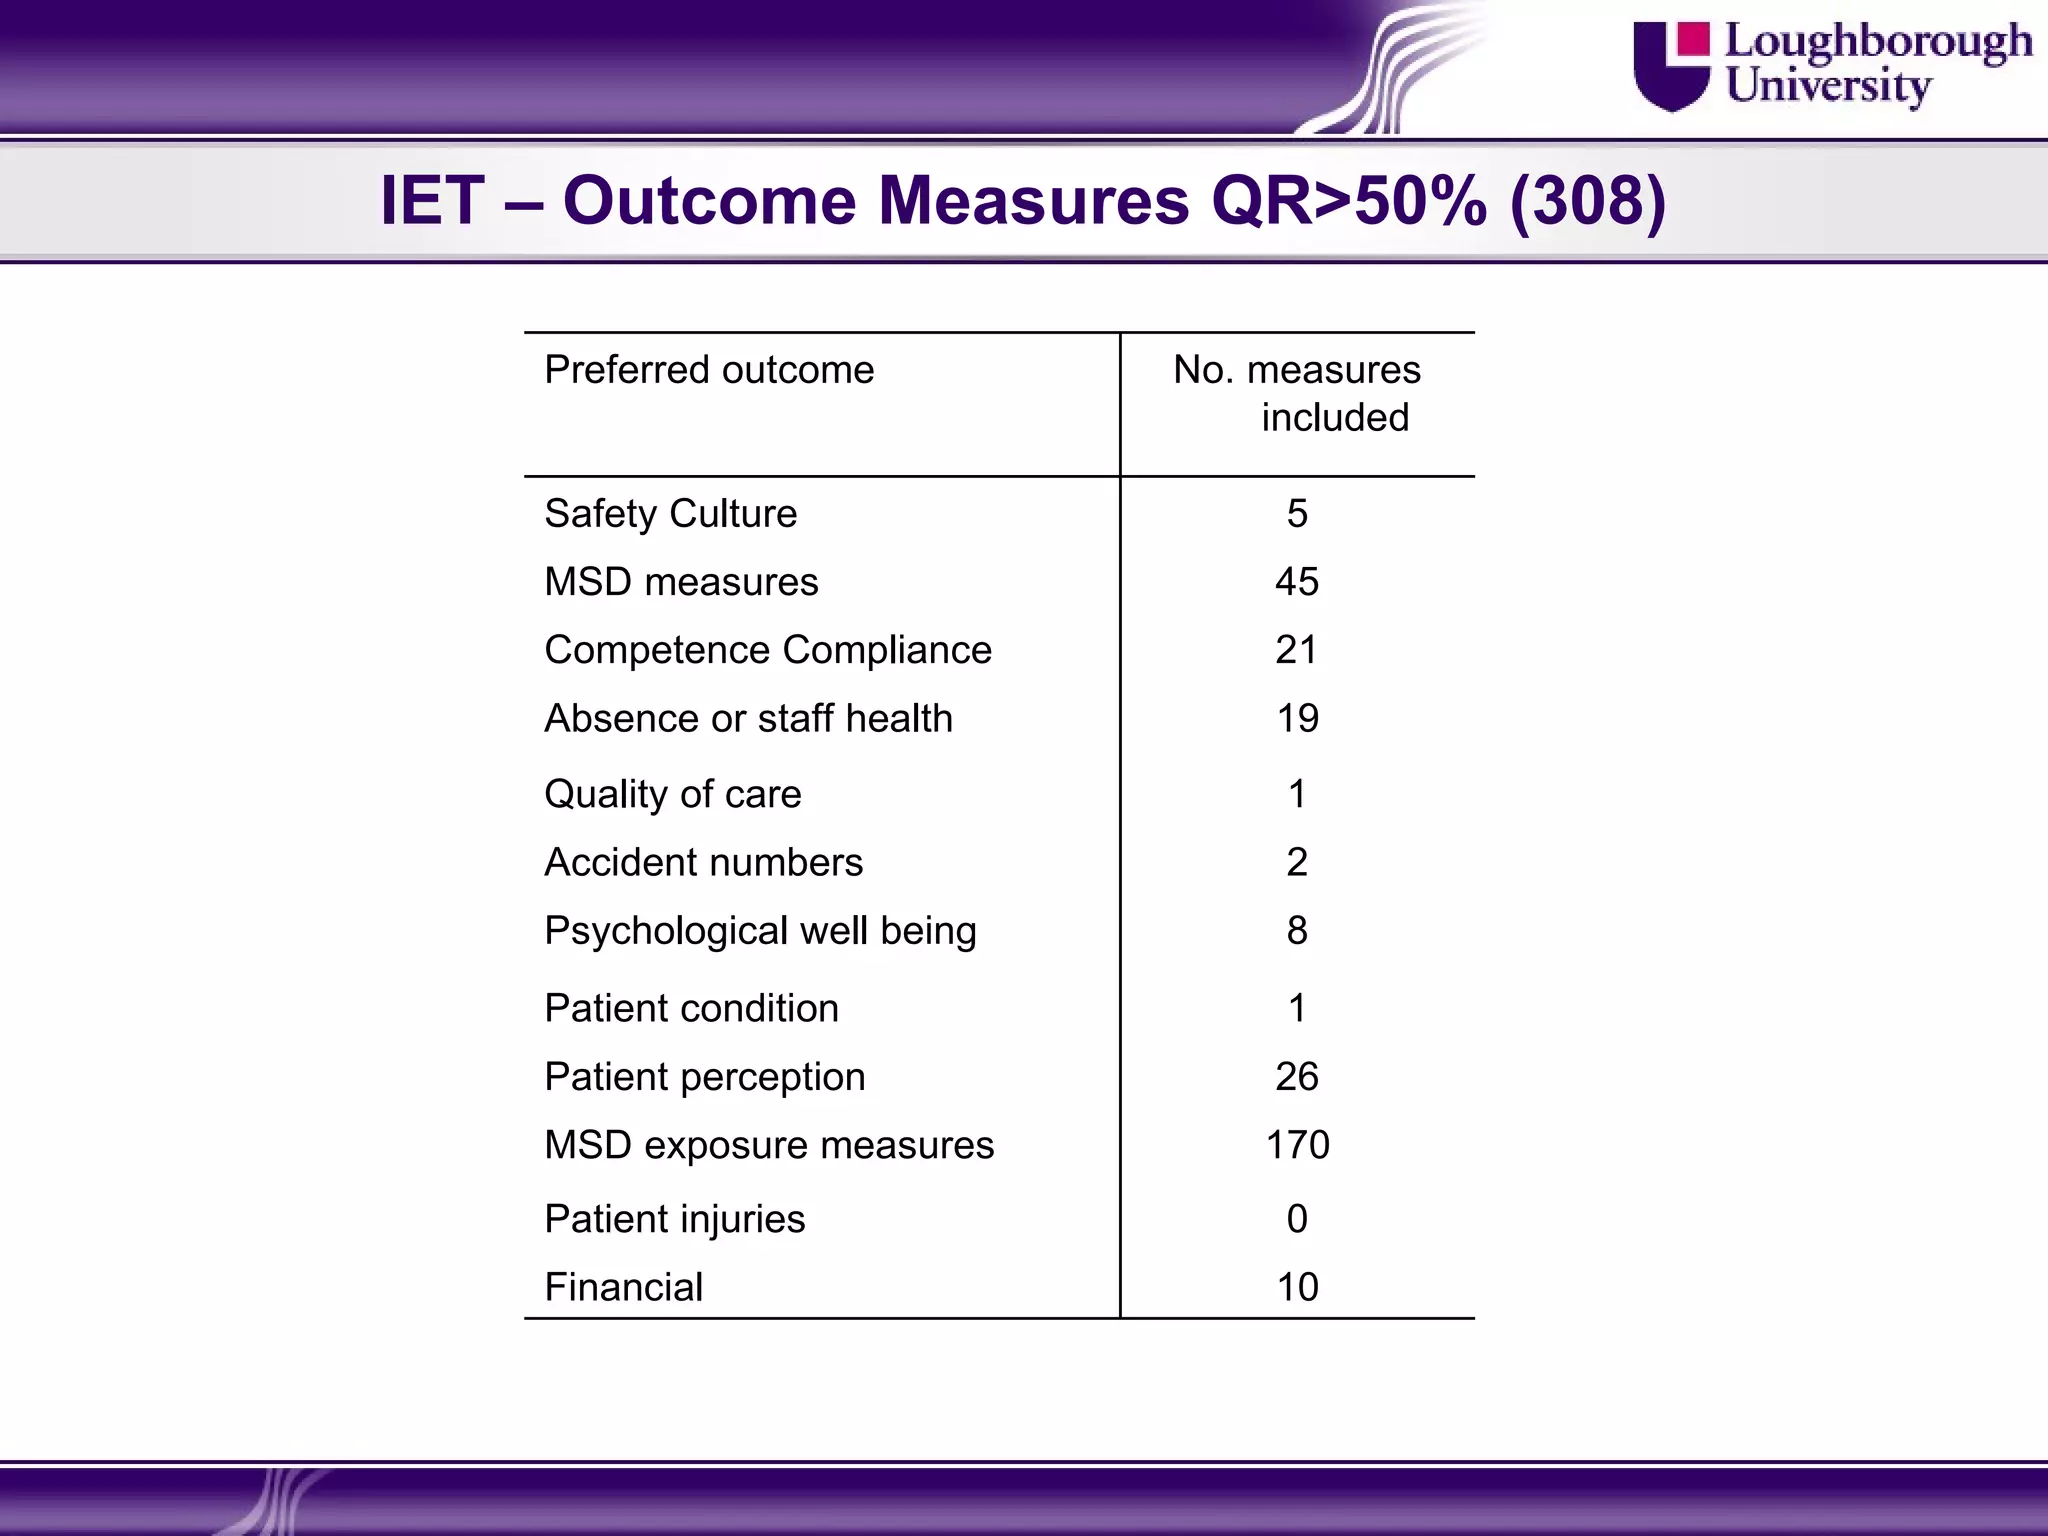
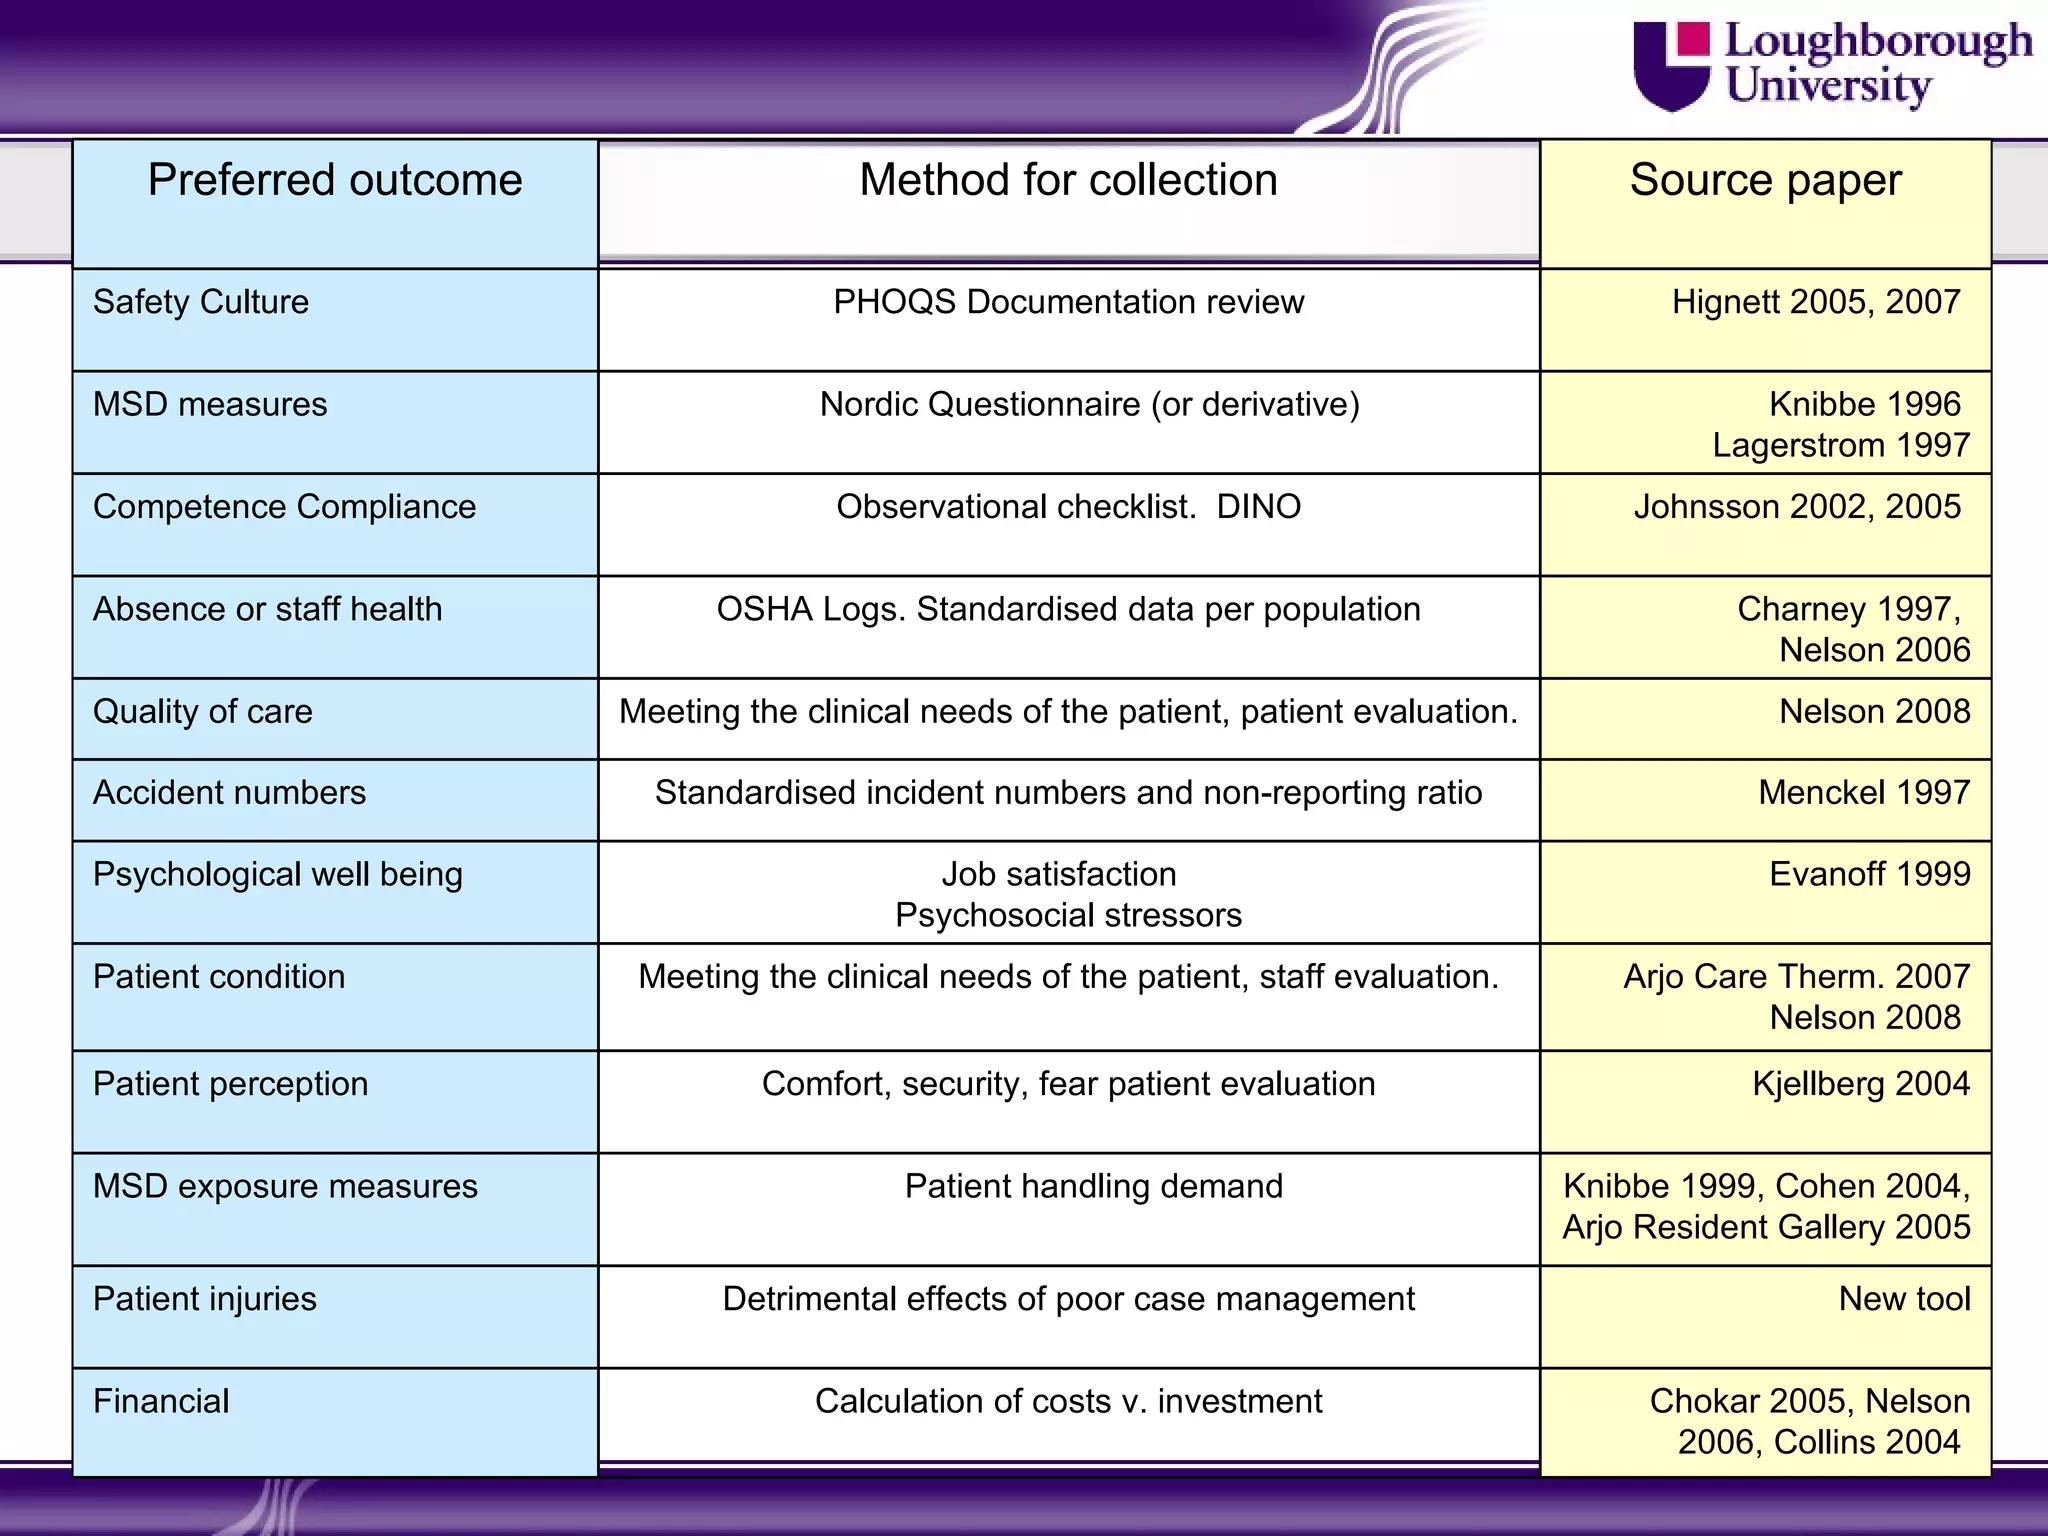
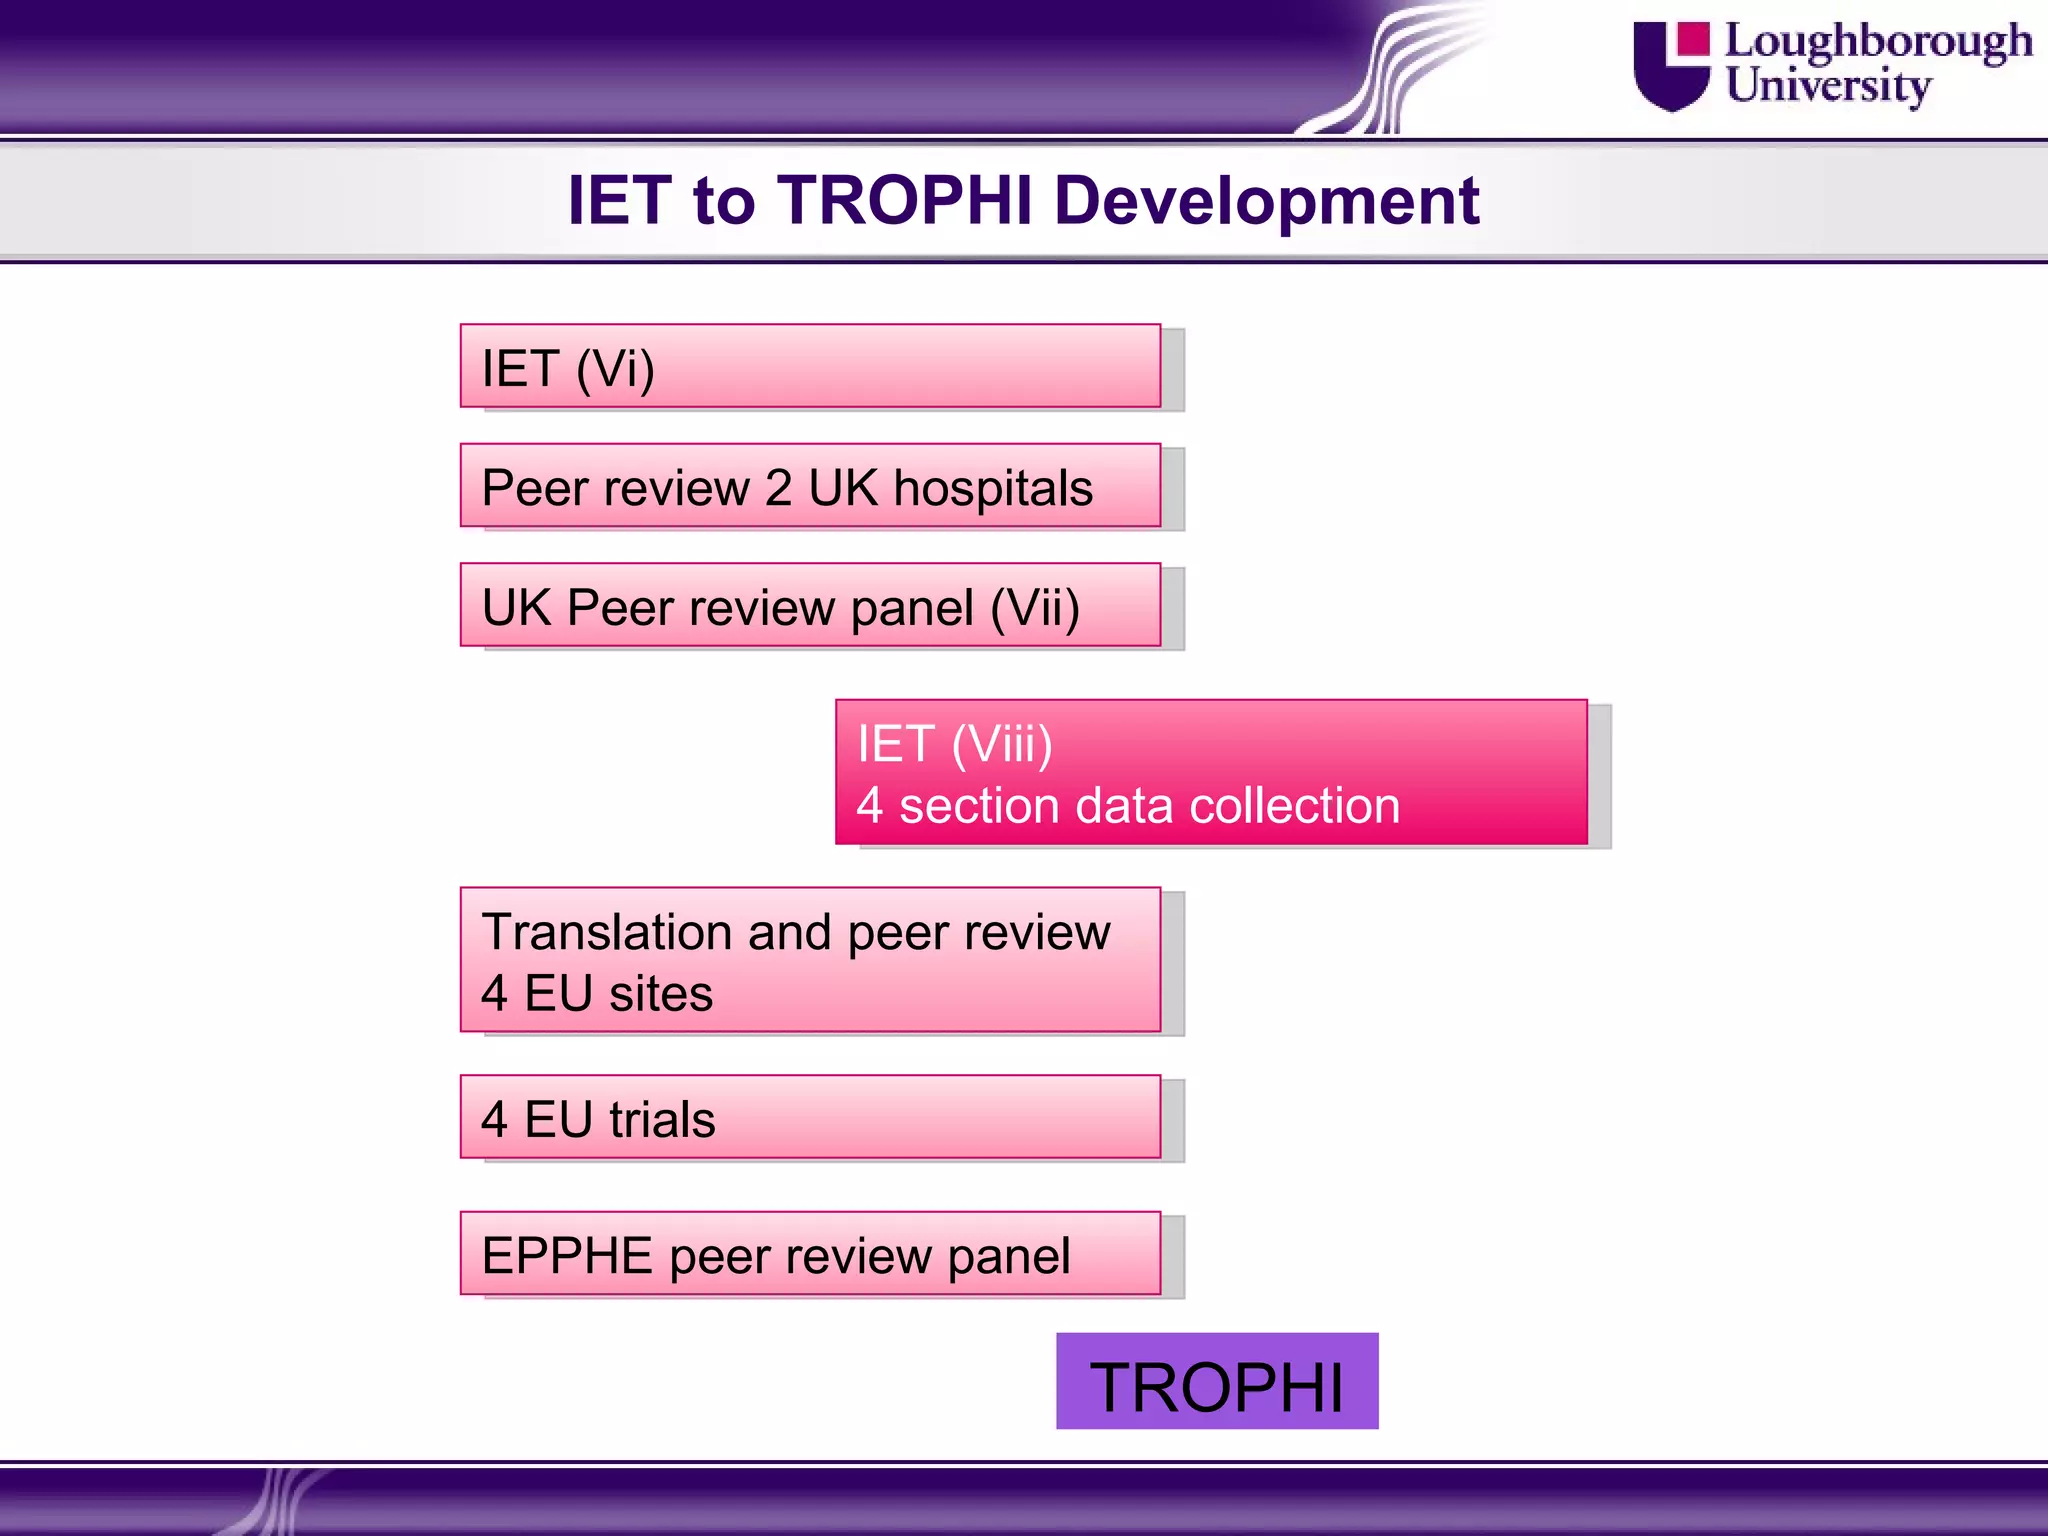
A tool to measure the success of
 patient handling inter ventions

            Mike Fray and Sue Hignett

   Healthcare Ergonomics and Patient Safety Research Unit
                Loughborough Design School
                  Loughborough University
                           UK

            Sponsors: Arjo-Huntleigh ab, EPPHE.
Patient Handling Interventions


 Many reviews have failed to identify MSD
  reduction from patient handling interventions
  (Van Poppel 2005, Bos et al 2006, Amick et al 2006, Haslam et al 2006, Dawson et al, 2007, Martimo et al
  2008)

 More inclusive reviews identify that other
  outcomes could be used to show success (Hignett
  et al 2003, Fray and Hignett 2006)

 How can different interventions be compared
  when different measures are used?
Overview of Presentation


 5 year part-time PhD programme
 Aim - Develop a tool to measure the success of
  patient handling interventions applicable across
  the EU
 Overview of the project methods
 Results
 Development and evaluation of the tool
Methodology

    Literature Analysis                                  Focus Groups


Intervention types                                  Outcomes
Outcomes                                            Outcome measures
Outcome measurement tools


Academic Quality                                    Preferred Outcome


               Intervention                         Ranked List
                 Scoring
                 System


                          Intervention Evaluation Tool


                                Evaluation Trials
Literature Analysis


 Search strategies from existing publication
    (Hignett et al 2003)

   Intervention type, study design
   Specific outcome recorded
   Level of outcome measure (Robson et al 2007)
   Measurement device used for outcome
   Academic quality score (Downs and Black 1998)
   Practitioner rating (Hignett et al 2003)
   Ranking of outcome from EU study
   323 studies 2 reviewers
Literature Analysis - Level of Outcome (Robson 2007)

                     Intervention
         Outcomes that measure quantities
         and qualities of the intervention


         Outcomes that represent a reduction
         in exposure to known risk factors


         Outcomes that measure real effects in
         the target population in a real situation
Literature Analysis


 Search strategies from existing publication
    (Hignett et al 2003)

   Intervention type, study design
   Specific outcome recorded
   Level of outcome measure (Robson et al 2007)
   Measurement device used for outcome
   Academic quality score (Downs and Black 1998)
   Practitioner rating (Hignett et al 2003)
   Ranking of outcome from EU study
   323 studies 2 reviewers
Focus Group Study


 ‘Nominal Group Technique’ Higgins 1994
 Range of outcomes at onset of scenario
 Secondary list of outcomes recorded at end of
  scenario discussion
 Ranked outcomes at end of scenario
  discussion
 Thematic and content analysis from
  transcriptions (NVivo)
Focus groups


 Four EU focus groups (n=34)
     UK
     Finland
     Italy
     Portugal
 Two expert panels (n=10)
   Holland, USA, Australia, Belgium, Finland,
    Portugal, Italy, Germany
   Cross comparison
Qualitative Analysis

Outcomes identified in focus
groups (210)


         Identified themes             Included in priority
         (42)                          lists (38)


                      12 highest ranked
                      outcomes included in
                      Intervention Evaluation
                      Tool
Focus Group Results: Transformations of data


   Grouping of themes gave clear definitions
   Remove intervention definitions        (Robson 2007)


   Combined categories
   Separated categories
   Categories with < 5 votes excluded
Most Important Outcomes (Ranks)
Theme                             Italy   Port   Fin   UK    TOTAL
Accidents                           8       3     11   5.5           6
Absence, Staff health               3       8     2    3.5           4
Financial                          11.5   11.5    7    10        12
Risk Management, Safety culture     2       1     1     2            1
MSD Measures                        1       5     8     1            2
Exposure Measures                  11.5     9     5    12        10
Compliance, competence              4       2     4    5.5           3
Psychological well-being            10     6.5    9    3.5           7
Patient injuries                    8     11.5    11    9        11
Patient perception                  8      10     11    8            9
Patient condition                   6      6.5    6    11            8
Quality of care                     5       4     3     7            5
Analysis


Difference versus Association
   Kendall’s Concordance (W)
   Using tied ranks correction
   Chi Square comparison
      W= 0.623
      Chi square = 27.7
      Sig 0.005
Included outcomes

            Outcome        Conversion
                              factor

Safety Culture                 12
MSD measures                   11
Competence Compliance          10
Absence or staff health         9
Quality of care                 8
Accident numbers                7
Psychological well being        6
Patient condition               5
Patient perception              4
MSD exposure measures           3
Patient injuries                2
Financial                       1
Measuring each outcome

   Inclusion Criteria
   Tool used in patient handling study
   Level of the QR >50% (308 Included)
   Selection Criteria
   High QR scores
   Evidence of peer reviewed validation studies
   Used in a peer reviewed intervention trial
   Most frequently used measurement devices
   Complexity of the data collection in health
IET – Outcome Measures QR>50% (308)

    Preferred outcome          No. measures
                                   included

    Safety Culture                  5
    MSD measures                   45
    Competence Compliance          21
    Absence or staff health        19
    Quality of care                 1
    Accident numbers                2
    Psychological well being        8
    Patient condition               1
    Patient perception             26
    MSD exposure measures          170
    Patient injuries                0
    Financial                      10
Preferred outcome                       Method for collection                                Source paper

Safety Culture                           PHOQS Documentation review                               Hignett 2005, 2007


MSD measures                            Nordic Questionnaire (or derivative)                            Knibbe 1996
                                                                                                     Lagerstrom 1997
Competence Compliance                    Observational checklist. DINO                          Johnsson 2002, 2005


Absence or staff health          OSHA Logs. Standardised data per population                           Charney 1997,
                                                                                                         Nelson 2006
Quality of care            Meeting the clinical needs of the patient, patient evaluation.                Nelson 2008

Accident numbers             Standardised incident numbers and non-reporting ratio                      Menckel 1997

Psychological well being                        Job satisfaction                                         Evanoff 1999
                                              Psychosocial stressors
Patient condition           Meeting the clinical needs of the patient, staff evaluation.       Arjo Care Therm. 2007
                                                                                                        Nelson 2008
Patient perception                  Comfort, security, fear patient evaluation                          Kjellberg 2004


MSD exposure measures                         Patient handling demand                       Knibbe 1999, Cohen 2004,
                                                                                            Arjo Resident Gallery 2005

Patient injuries                  Detrimental effects of poor case management                                New tool


Financial                               Calculation of costs v. investment                       Chokar 2005, Nelson
                                                                                                  2006, Collins 2004
IET to TROPHI Development

IET (Vi)

Peer review 2 UK hospitals

UK Peer review panel (Vii)

                IET (Viii)
                4 section data collection

Translation and peer review
4 EU sites

4 EU trials

EPPHE peer review panel

                             TROPHI
TROPHI


T ool for
R isks
O utstanding in
P atient
H andling
I nterventions
Field Trials: Aims


 Identify good and bad performers
 Assess applicability to other EU countries
 Final review panel (EPPHE) to gain expert
  consensus on method and content
EU Trial Results (Positive Negative defaults)
                               UK1     UK2     Po1     Po2     Fi1     Fi2     It1     It2

Safety Culture                 55.6    46.7    13.8    23.3    30.7    39.8    15.6    25.2

MSD measures                   40.0    50.0    55.0    51.5    22.6    21.6    38.5    100

Competence Compliance          29.2    47.9    3.5     11.5    59.6    29.3    56.9    29.6

Absence or staff health        0.0     10.7    95.9    64.6    71.2    0.0     100     99.5

Quality of care                75.0    80.0    100     69.0    64.2    86.7    88.8    79.5

Accident numbers               0.0     97.3    89.5    69.8    82.5    72.0    89.8    88.5

Psychological well being       76.2    82.4    77.7    70.7    75.0    70.3    71.7    81.2

Patient condition              64.5    79.9    45.0    65.9    64.2    62.5    69.1    84.4

Patient perception             68.7    100     100     66.7    100     52.1    93.3    90.0

MSD exposure measures          64.0    70.8    52.1    55.2    79.4    75.8    71.6    97.1

Patient injuries               0.0     0.0     91.8    66.8    100     100     100     100

Financial                      100     100     100     100     100     100     100     100
                   IET SCORE    38.5    53.0    53.2    46.0    53.5    42.3    58.4    65.6
Evaluation


 Range effects
 Scores collected 11/12 sections
 Data collection 3 hours per ward area
 Differences identified and measured
 Only small differences were noted in
  subjective data collected (DiNO 80%)
 Improvements for data collection methods
EPPHE Review


 MSD and absence score could be age and
  experience factored
 Validity issues regarding single point data
 Reliability for different users and different
  systems
 MS workload exposure score
Recent implementation


 UK, 2010. Mental health unit, Defined
  minimal requirement of PH demand
 Portugal 2011, 8 wards areas acute hospital,
  (Cotrim et al 2012)

 UK 2011, 6 wards acute hospital. Audit
  review study. Repeatability of measures over
  3 month period
Why is Safety Culture No 1


 Organisational
   behaviour
  measures
(Safety Culture)
Why is Safety Culture No 1


Organisational   Measures of safe
  behaviour          or quality
 measures           behaviour
     (1)          (Competence,
                   compliance,
                  Quality of care,
                    Accidents)
Why is Safety Culture No 1


Organisational   Measures of safe     Measures of
  behaviour         or quality          effects on
 measures          behaviour           individuals
     (1)             (3,5,6)        (MSD exposure
                                    and prevalence,
                                     Absence, Well
                                     being, Patient
                                     condition and
                                      perception)
Why is Safety Culture No 1


Organisational   Measures of safe     Measures of       Financial
  behaviour         or quality          effects on      outcomes
 measures          behaviour           individuals         (12)
     (1)             (3,5,6)        (2,4,7,8,9,10,11)


      Strength of outcome by interaction
           The flow cannot be reversed
Summary

 IET has been successful in measures from 4
  EU countries
 3 hour data collection
 Range of scores across 12 sections
 Potential uses:
   Pre-post intervention
   Intra or inter site comparison
   Benchmarking
 12 sections and total score allow more
  directed use of resources than with single
  measurement tools.
Future work


 Previously the outcome measure selected
  restricted the ability to compare different
  interventions but TROPHI increases this
  process
 A large scale data collection is required to
  further validate the TROPHI methods
 Use section scores to direct future
  interventions
 Set standards for each section and total as a
  worldwide benchmarking tool
Thank you for listening

A tool to measure the success of patient handling interventions

  • 1.
    A tool tomeasure the success of patient handling inter ventions Mike Fray and Sue Hignett Healthcare Ergonomics and Patient Safety Research Unit Loughborough Design School Loughborough University UK Sponsors: Arjo-Huntleigh ab, EPPHE.
  • 2.
    Patient Handling Interventions Many reviews have failed to identify MSD reduction from patient handling interventions (Van Poppel 2005, Bos et al 2006, Amick et al 2006, Haslam et al 2006, Dawson et al, 2007, Martimo et al 2008)  More inclusive reviews identify that other outcomes could be used to show success (Hignett et al 2003, Fray and Hignett 2006)  How can different interventions be compared when different measures are used?
  • 3.
    Overview of Presentation 5 year part-time PhD programme  Aim - Develop a tool to measure the success of patient handling interventions applicable across the EU  Overview of the project methods  Results  Development and evaluation of the tool
  • 4.
    Methodology Literature Analysis Focus Groups Intervention types Outcomes Outcomes Outcome measures Outcome measurement tools Academic Quality Preferred Outcome Intervention Ranked List Scoring System Intervention Evaluation Tool Evaluation Trials
  • 5.
    Literature Analysis  Searchstrategies from existing publication (Hignett et al 2003)  Intervention type, study design  Specific outcome recorded  Level of outcome measure (Robson et al 2007)  Measurement device used for outcome  Academic quality score (Downs and Black 1998)  Practitioner rating (Hignett et al 2003)  Ranking of outcome from EU study  323 studies 2 reviewers
  • 6.
    Literature Analysis -Level of Outcome (Robson 2007) Intervention Outcomes that measure quantities and qualities of the intervention Outcomes that represent a reduction in exposure to known risk factors Outcomes that measure real effects in the target population in a real situation
  • 7.
    Literature Analysis  Searchstrategies from existing publication (Hignett et al 2003)  Intervention type, study design  Specific outcome recorded  Level of outcome measure (Robson et al 2007)  Measurement device used for outcome  Academic quality score (Downs and Black 1998)  Practitioner rating (Hignett et al 2003)  Ranking of outcome from EU study  323 studies 2 reviewers
  • 8.
    Focus Group Study ‘Nominal Group Technique’ Higgins 1994  Range of outcomes at onset of scenario  Secondary list of outcomes recorded at end of scenario discussion  Ranked outcomes at end of scenario discussion  Thematic and content analysis from transcriptions (NVivo)
  • 9.
    Focus groups  FourEU focus groups (n=34)  UK  Finland  Italy  Portugal  Two expert panels (n=10)  Holland, USA, Australia, Belgium, Finland, Portugal, Italy, Germany  Cross comparison
  • 10.
    Qualitative Analysis Outcomes identifiedin focus groups (210) Identified themes Included in priority (42) lists (38) 12 highest ranked outcomes included in Intervention Evaluation Tool
  • 11.
    Focus Group Results:Transformations of data  Grouping of themes gave clear definitions  Remove intervention definitions (Robson 2007)  Combined categories  Separated categories  Categories with < 5 votes excluded
  • 12.
    Most Important Outcomes(Ranks) Theme Italy Port Fin UK TOTAL Accidents 8 3 11 5.5 6 Absence, Staff health 3 8 2 3.5 4 Financial 11.5 11.5 7 10 12 Risk Management, Safety culture 2 1 1 2 1 MSD Measures 1 5 8 1 2 Exposure Measures 11.5 9 5 12 10 Compliance, competence 4 2 4 5.5 3 Psychological well-being 10 6.5 9 3.5 7 Patient injuries 8 11.5 11 9 11 Patient perception 8 10 11 8 9 Patient condition 6 6.5 6 11 8 Quality of care 5 4 3 7 5
  • 13.
    Analysis Difference versus Association  Kendall’s Concordance (W)  Using tied ranks correction  Chi Square comparison  W= 0.623  Chi square = 27.7  Sig 0.005
  • 14.
    Included outcomes Outcome Conversion factor Safety Culture 12 MSD measures 11 Competence Compliance 10 Absence or staff health 9 Quality of care 8 Accident numbers 7 Psychological well being 6 Patient condition 5 Patient perception 4 MSD exposure measures 3 Patient injuries 2 Financial 1
  • 15.
    Measuring each outcome  Inclusion Criteria  Tool used in patient handling study  Level of the QR >50% (308 Included)  Selection Criteria  High QR scores  Evidence of peer reviewed validation studies  Used in a peer reviewed intervention trial  Most frequently used measurement devices  Complexity of the data collection in health
  • 16.
    IET – OutcomeMeasures QR>50% (308) Preferred outcome No. measures included Safety Culture 5 MSD measures 45 Competence Compliance 21 Absence or staff health 19 Quality of care 1 Accident numbers 2 Psychological well being 8 Patient condition 1 Patient perception 26 MSD exposure measures 170 Patient injuries 0 Financial 10
  • 17.
    Preferred outcome Method for collection Source paper Safety Culture PHOQS Documentation review Hignett 2005, 2007 MSD measures Nordic Questionnaire (or derivative) Knibbe 1996 Lagerstrom 1997 Competence Compliance Observational checklist. DINO Johnsson 2002, 2005 Absence or staff health OSHA Logs. Standardised data per population Charney 1997, Nelson 2006 Quality of care Meeting the clinical needs of the patient, patient evaluation. Nelson 2008 Accident numbers Standardised incident numbers and non-reporting ratio Menckel 1997 Psychological well being Job satisfaction Evanoff 1999 Psychosocial stressors Patient condition Meeting the clinical needs of the patient, staff evaluation. Arjo Care Therm. 2007 Nelson 2008 Patient perception Comfort, security, fear patient evaluation Kjellberg 2004 MSD exposure measures Patient handling demand Knibbe 1999, Cohen 2004, Arjo Resident Gallery 2005 Patient injuries Detrimental effects of poor case management New tool Financial Calculation of costs v. investment Chokar 2005, Nelson 2006, Collins 2004
  • 18.
    IET to TROPHIDevelopment IET (Vi) Peer review 2 UK hospitals UK Peer review panel (Vii) IET (Viii) 4 section data collection Translation and peer review 4 EU sites 4 EU trials EPPHE peer review panel TROPHI
  • 19.
    TROPHI T ool for Risks O utstanding in P atient H andling I nterventions
  • 20.
    Field Trials: Aims Identify good and bad performers  Assess applicability to other EU countries  Final review panel (EPPHE) to gain expert consensus on method and content
  • 21.
    EU Trial Results(Positive Negative defaults) UK1 UK2 Po1 Po2 Fi1 Fi2 It1 It2 Safety Culture 55.6 46.7 13.8 23.3 30.7 39.8 15.6 25.2 MSD measures 40.0 50.0 55.0 51.5 22.6 21.6 38.5 100 Competence Compliance 29.2 47.9 3.5 11.5 59.6 29.3 56.9 29.6 Absence or staff health 0.0 10.7 95.9 64.6 71.2 0.0 100 99.5 Quality of care 75.0 80.0 100 69.0 64.2 86.7 88.8 79.5 Accident numbers 0.0 97.3 89.5 69.8 82.5 72.0 89.8 88.5 Psychological well being 76.2 82.4 77.7 70.7 75.0 70.3 71.7 81.2 Patient condition 64.5 79.9 45.0 65.9 64.2 62.5 69.1 84.4 Patient perception 68.7 100 100 66.7 100 52.1 93.3 90.0 MSD exposure measures 64.0 70.8 52.1 55.2 79.4 75.8 71.6 97.1 Patient injuries 0.0 0.0 91.8 66.8 100 100 100 100 Financial 100 100 100 100 100 100 100 100 IET SCORE 38.5 53.0 53.2 46.0 53.5 42.3 58.4 65.6
  • 22.
    Evaluation  Range effects Scores collected 11/12 sections  Data collection 3 hours per ward area  Differences identified and measured  Only small differences were noted in subjective data collected (DiNO 80%)  Improvements for data collection methods
  • 23.
    EPPHE Review  MSDand absence score could be age and experience factored  Validity issues regarding single point data  Reliability for different users and different systems  MS workload exposure score
  • 24.
    Recent implementation  UK,2010. Mental health unit, Defined minimal requirement of PH demand  Portugal 2011, 8 wards areas acute hospital, (Cotrim et al 2012)  UK 2011, 6 wards acute hospital. Audit review study. Repeatability of measures over 3 month period
  • 25.
    Why is SafetyCulture No 1 Organisational behaviour measures (Safety Culture)
  • 26.
    Why is SafetyCulture No 1 Organisational Measures of safe behaviour or quality measures behaviour (1) (Competence, compliance, Quality of care, Accidents)
  • 27.
    Why is SafetyCulture No 1 Organisational Measures of safe Measures of behaviour or quality effects on measures behaviour individuals (1) (3,5,6) (MSD exposure and prevalence, Absence, Well being, Patient condition and perception)
  • 28.
    Why is SafetyCulture No 1 Organisational Measures of safe Measures of Financial behaviour or quality effects on outcomes measures behaviour individuals (12) (1) (3,5,6) (2,4,7,8,9,10,11) Strength of outcome by interaction The flow cannot be reversed
  • 29.
    Summary  IET hasbeen successful in measures from 4 EU countries  3 hour data collection  Range of scores across 12 sections  Potential uses:  Pre-post intervention  Intra or inter site comparison  Benchmarking  12 sections and total score allow more directed use of resources than with single measurement tools.
  • 30.
    Future work  Previouslythe outcome measure selected restricted the ability to compare different interventions but TROPHI increases this process  A large scale data collection is required to further validate the TROPHI methods  Use section scores to direct future interventions  Set standards for each section and total as a worldwide benchmarking tool
  • 31.
    Thank you forlistening