Download to read offline


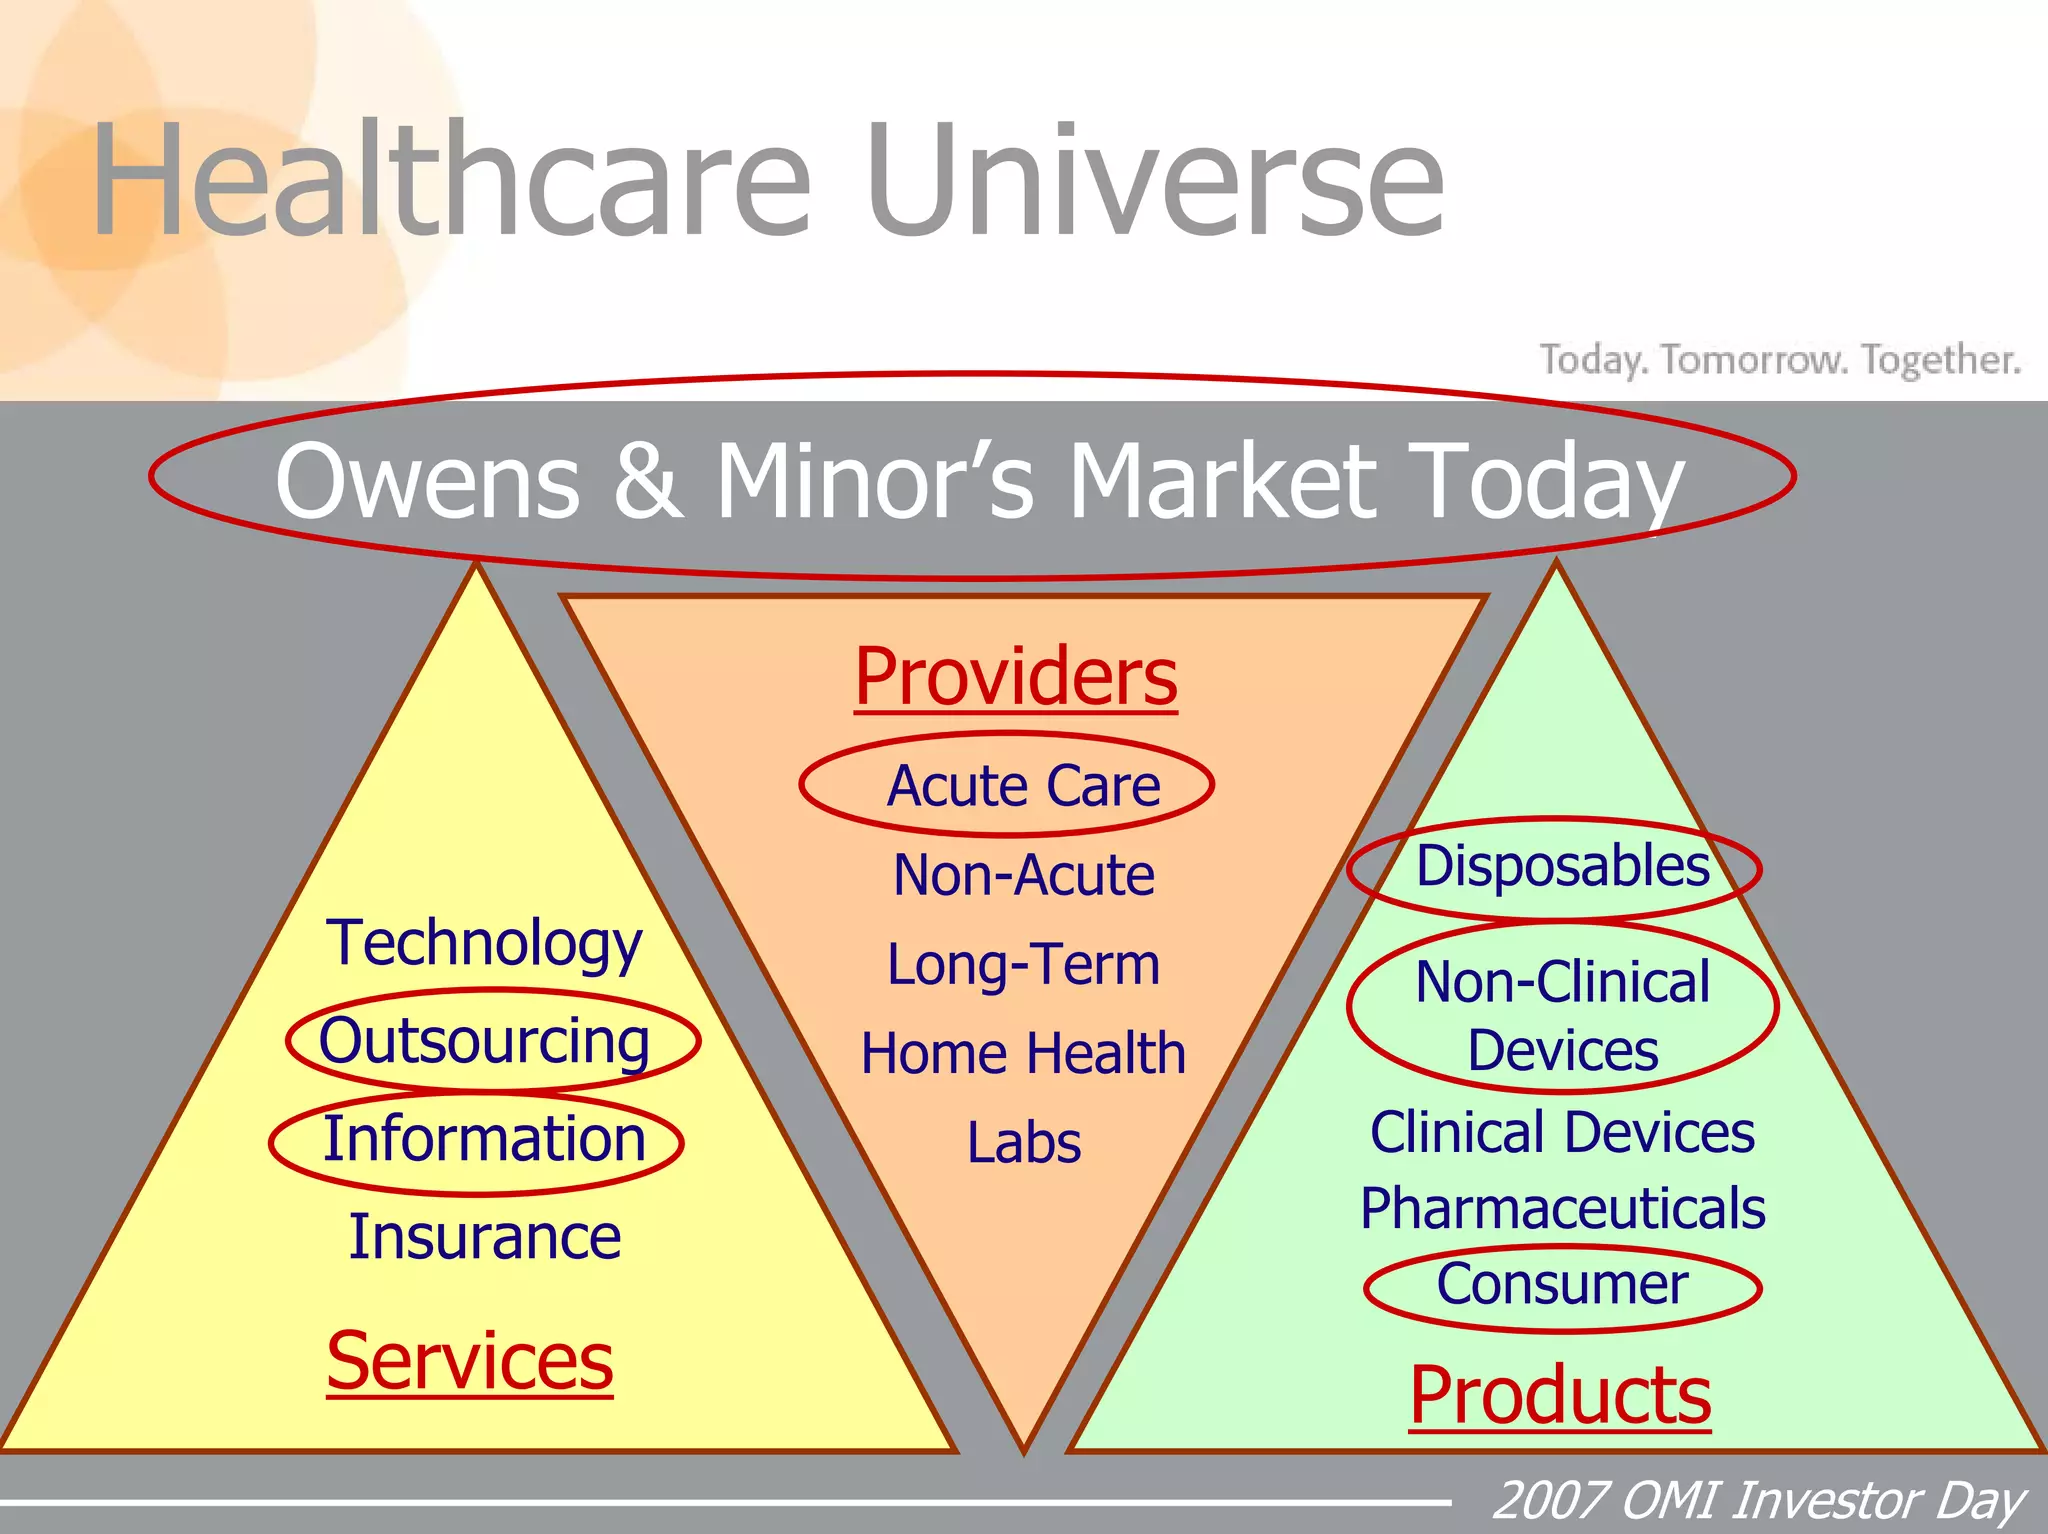

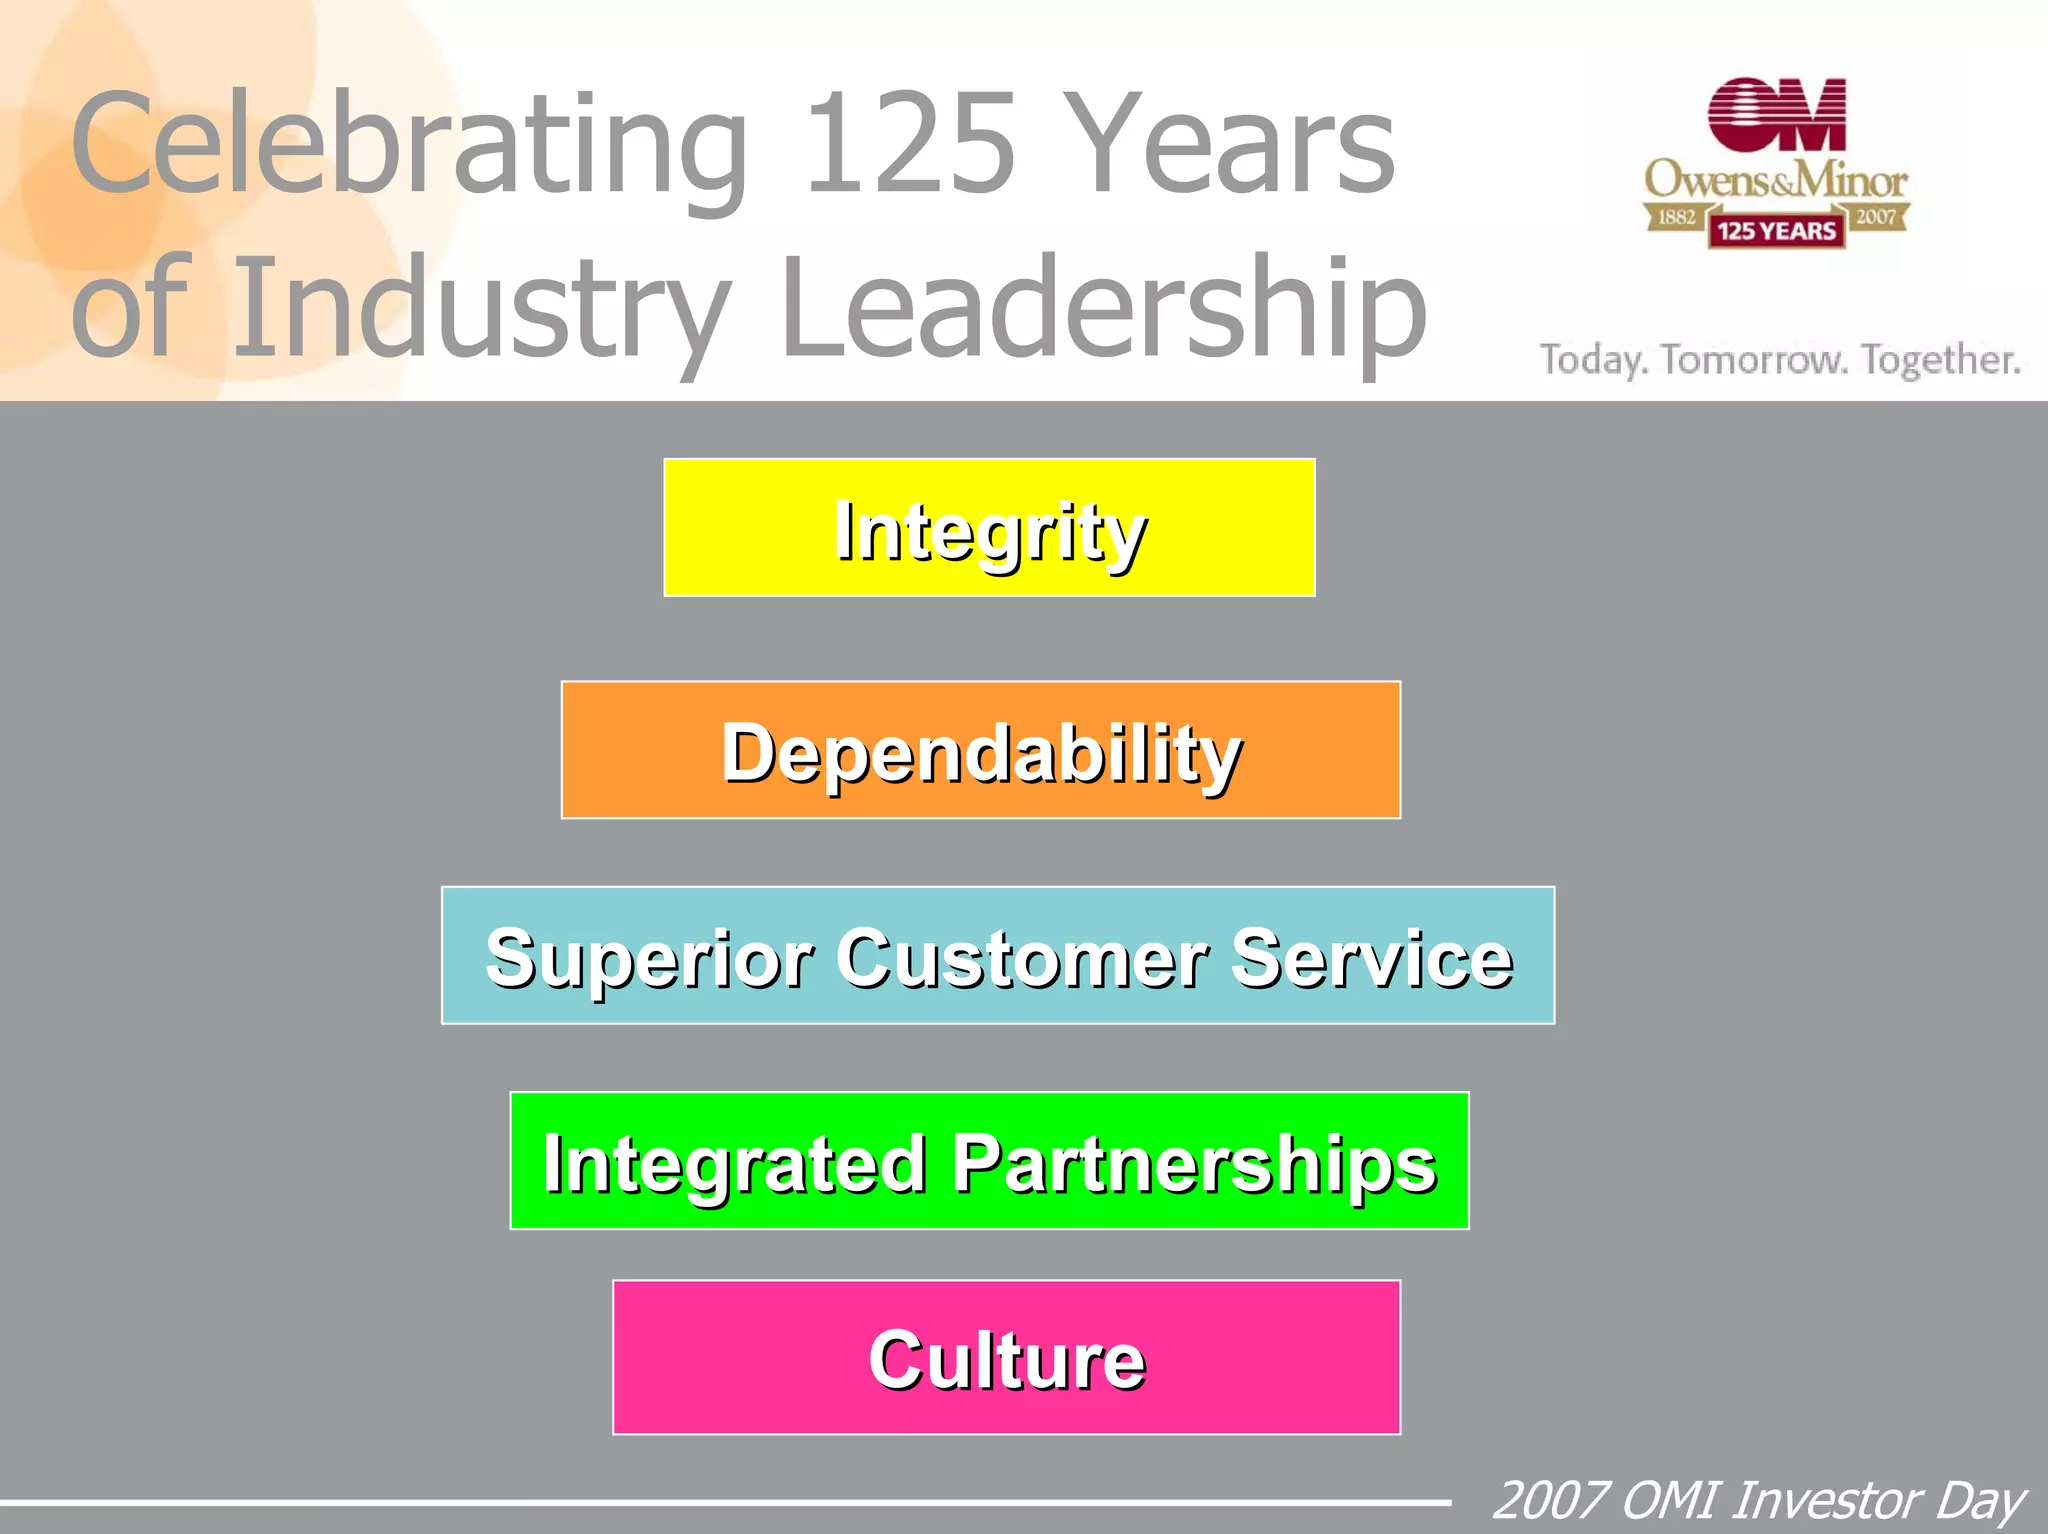


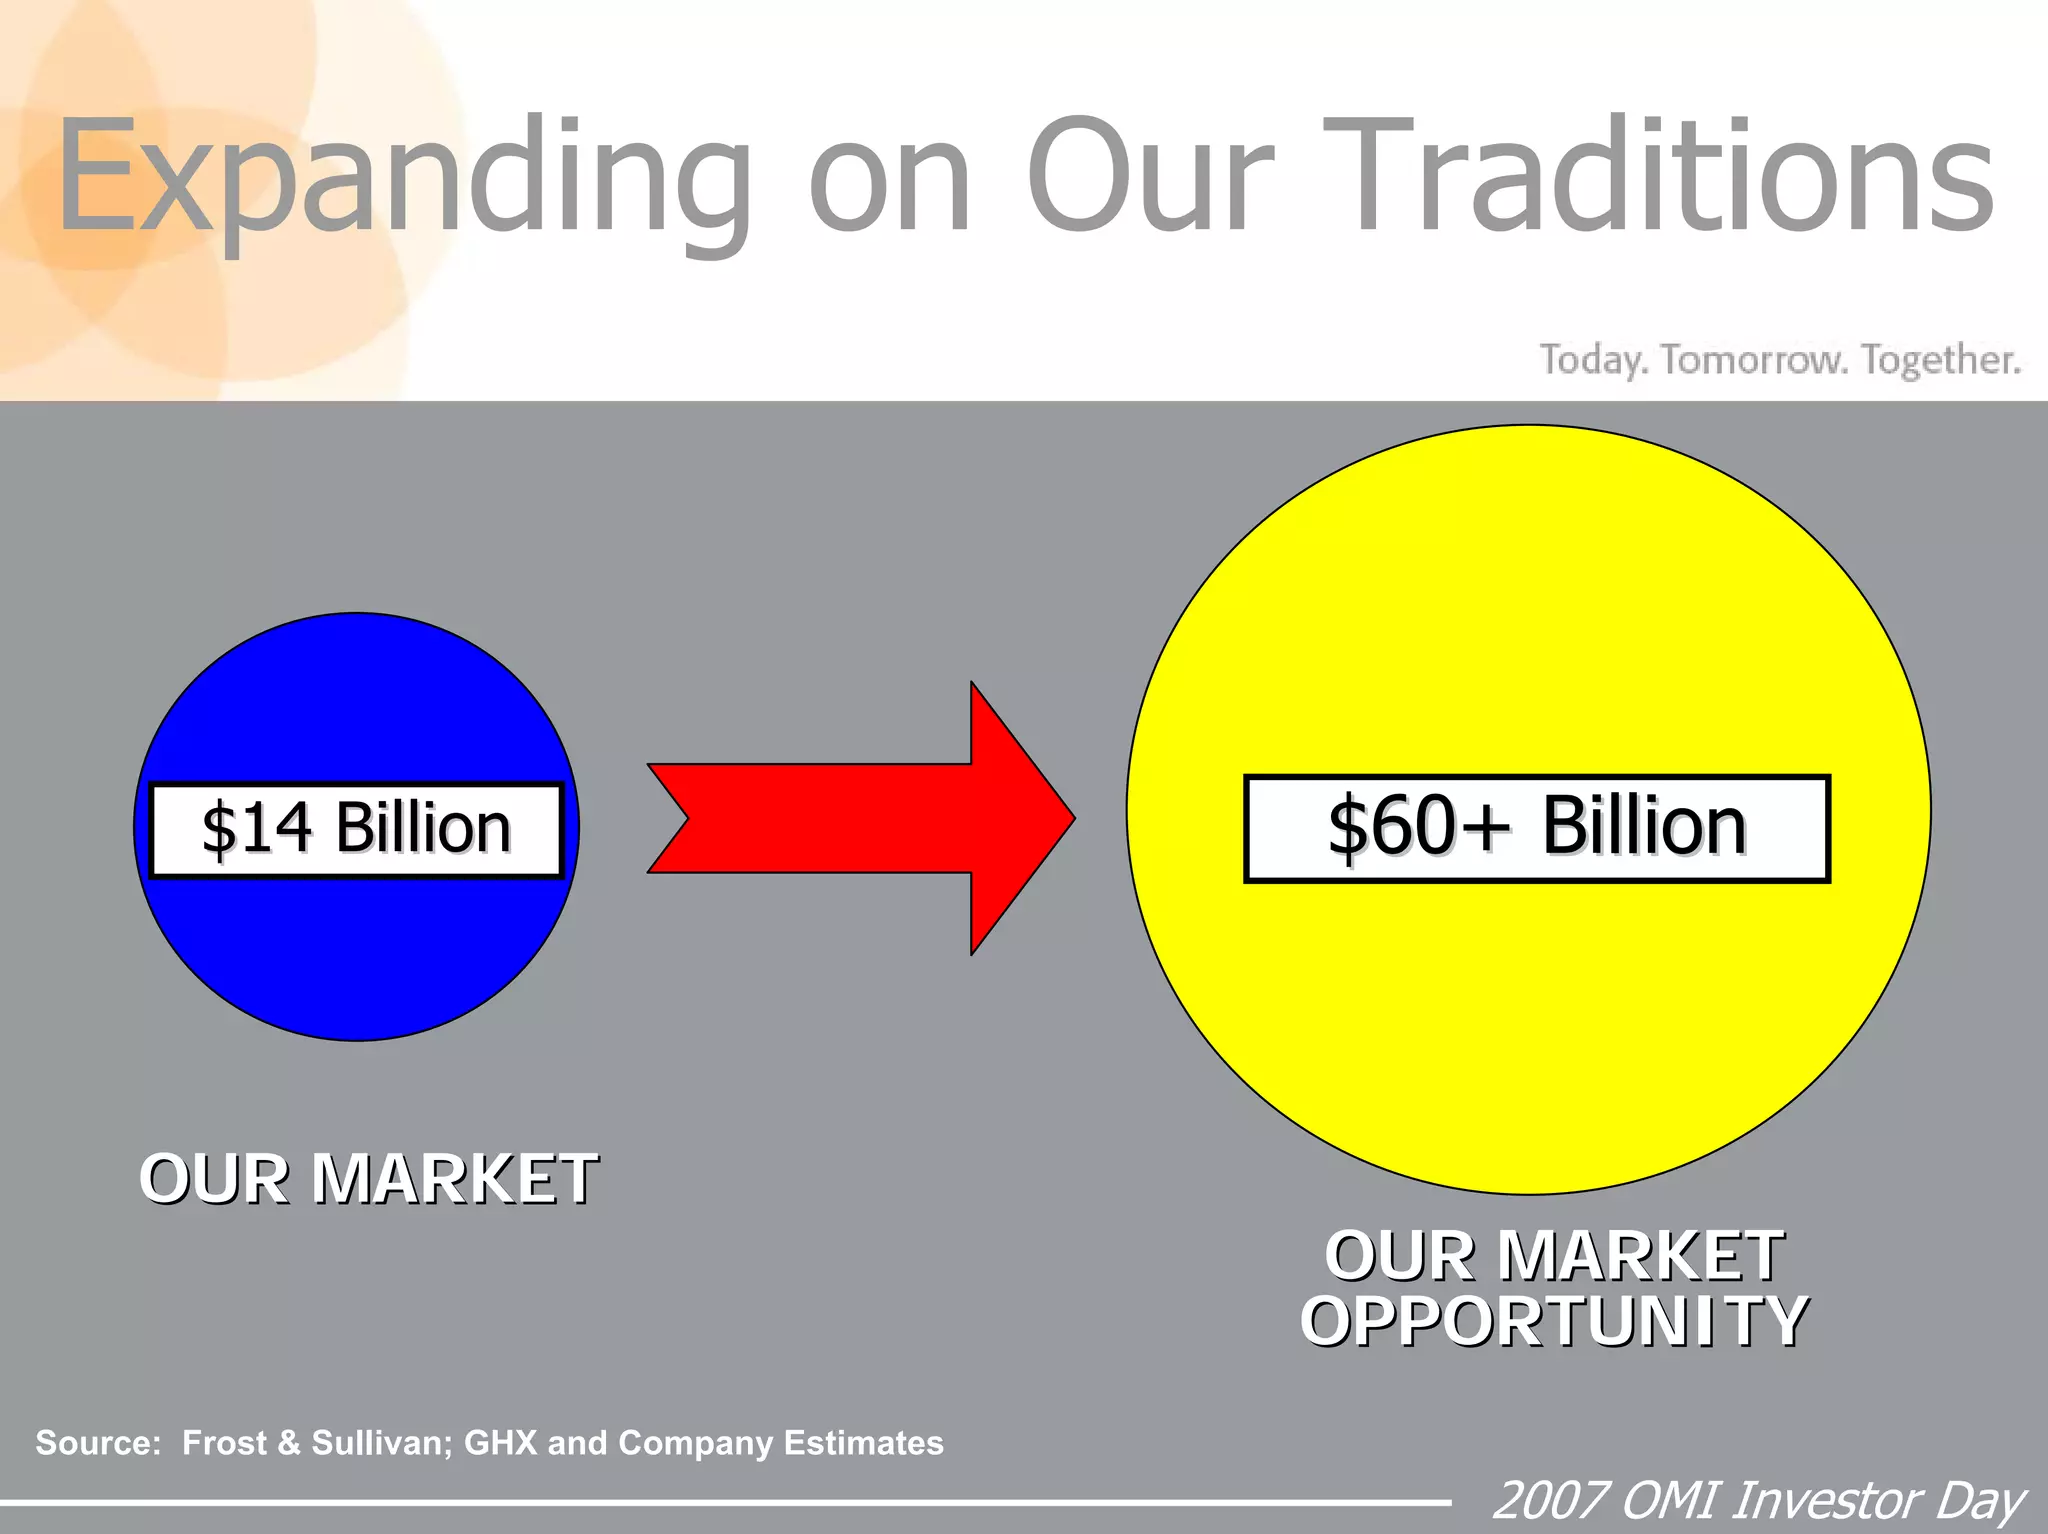


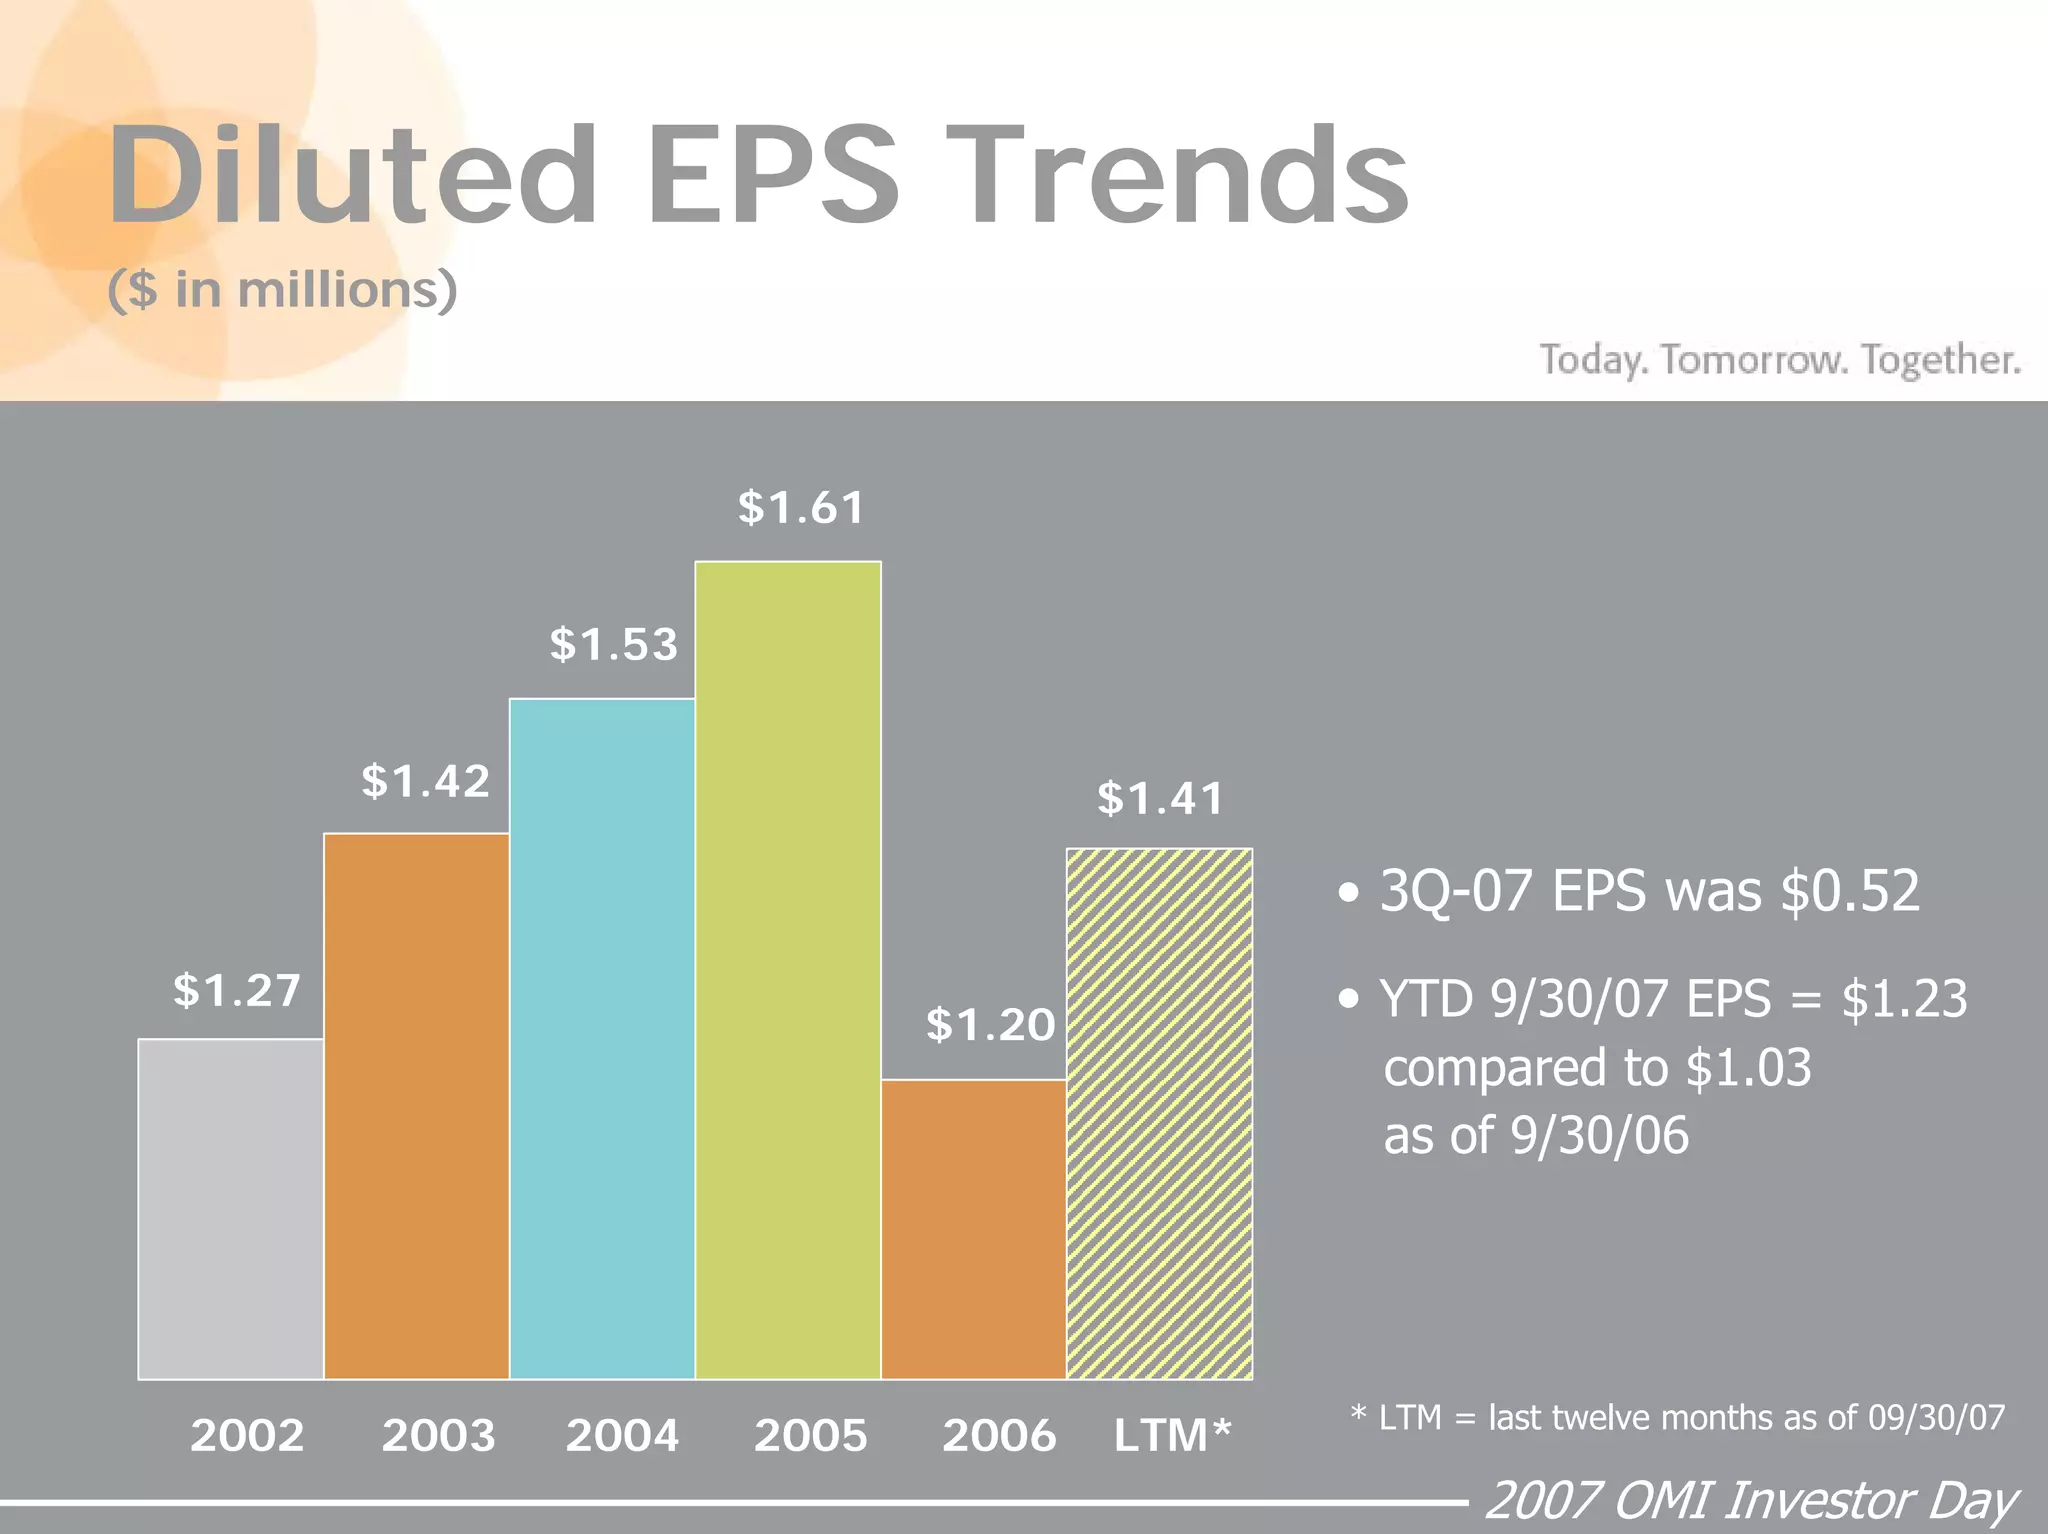
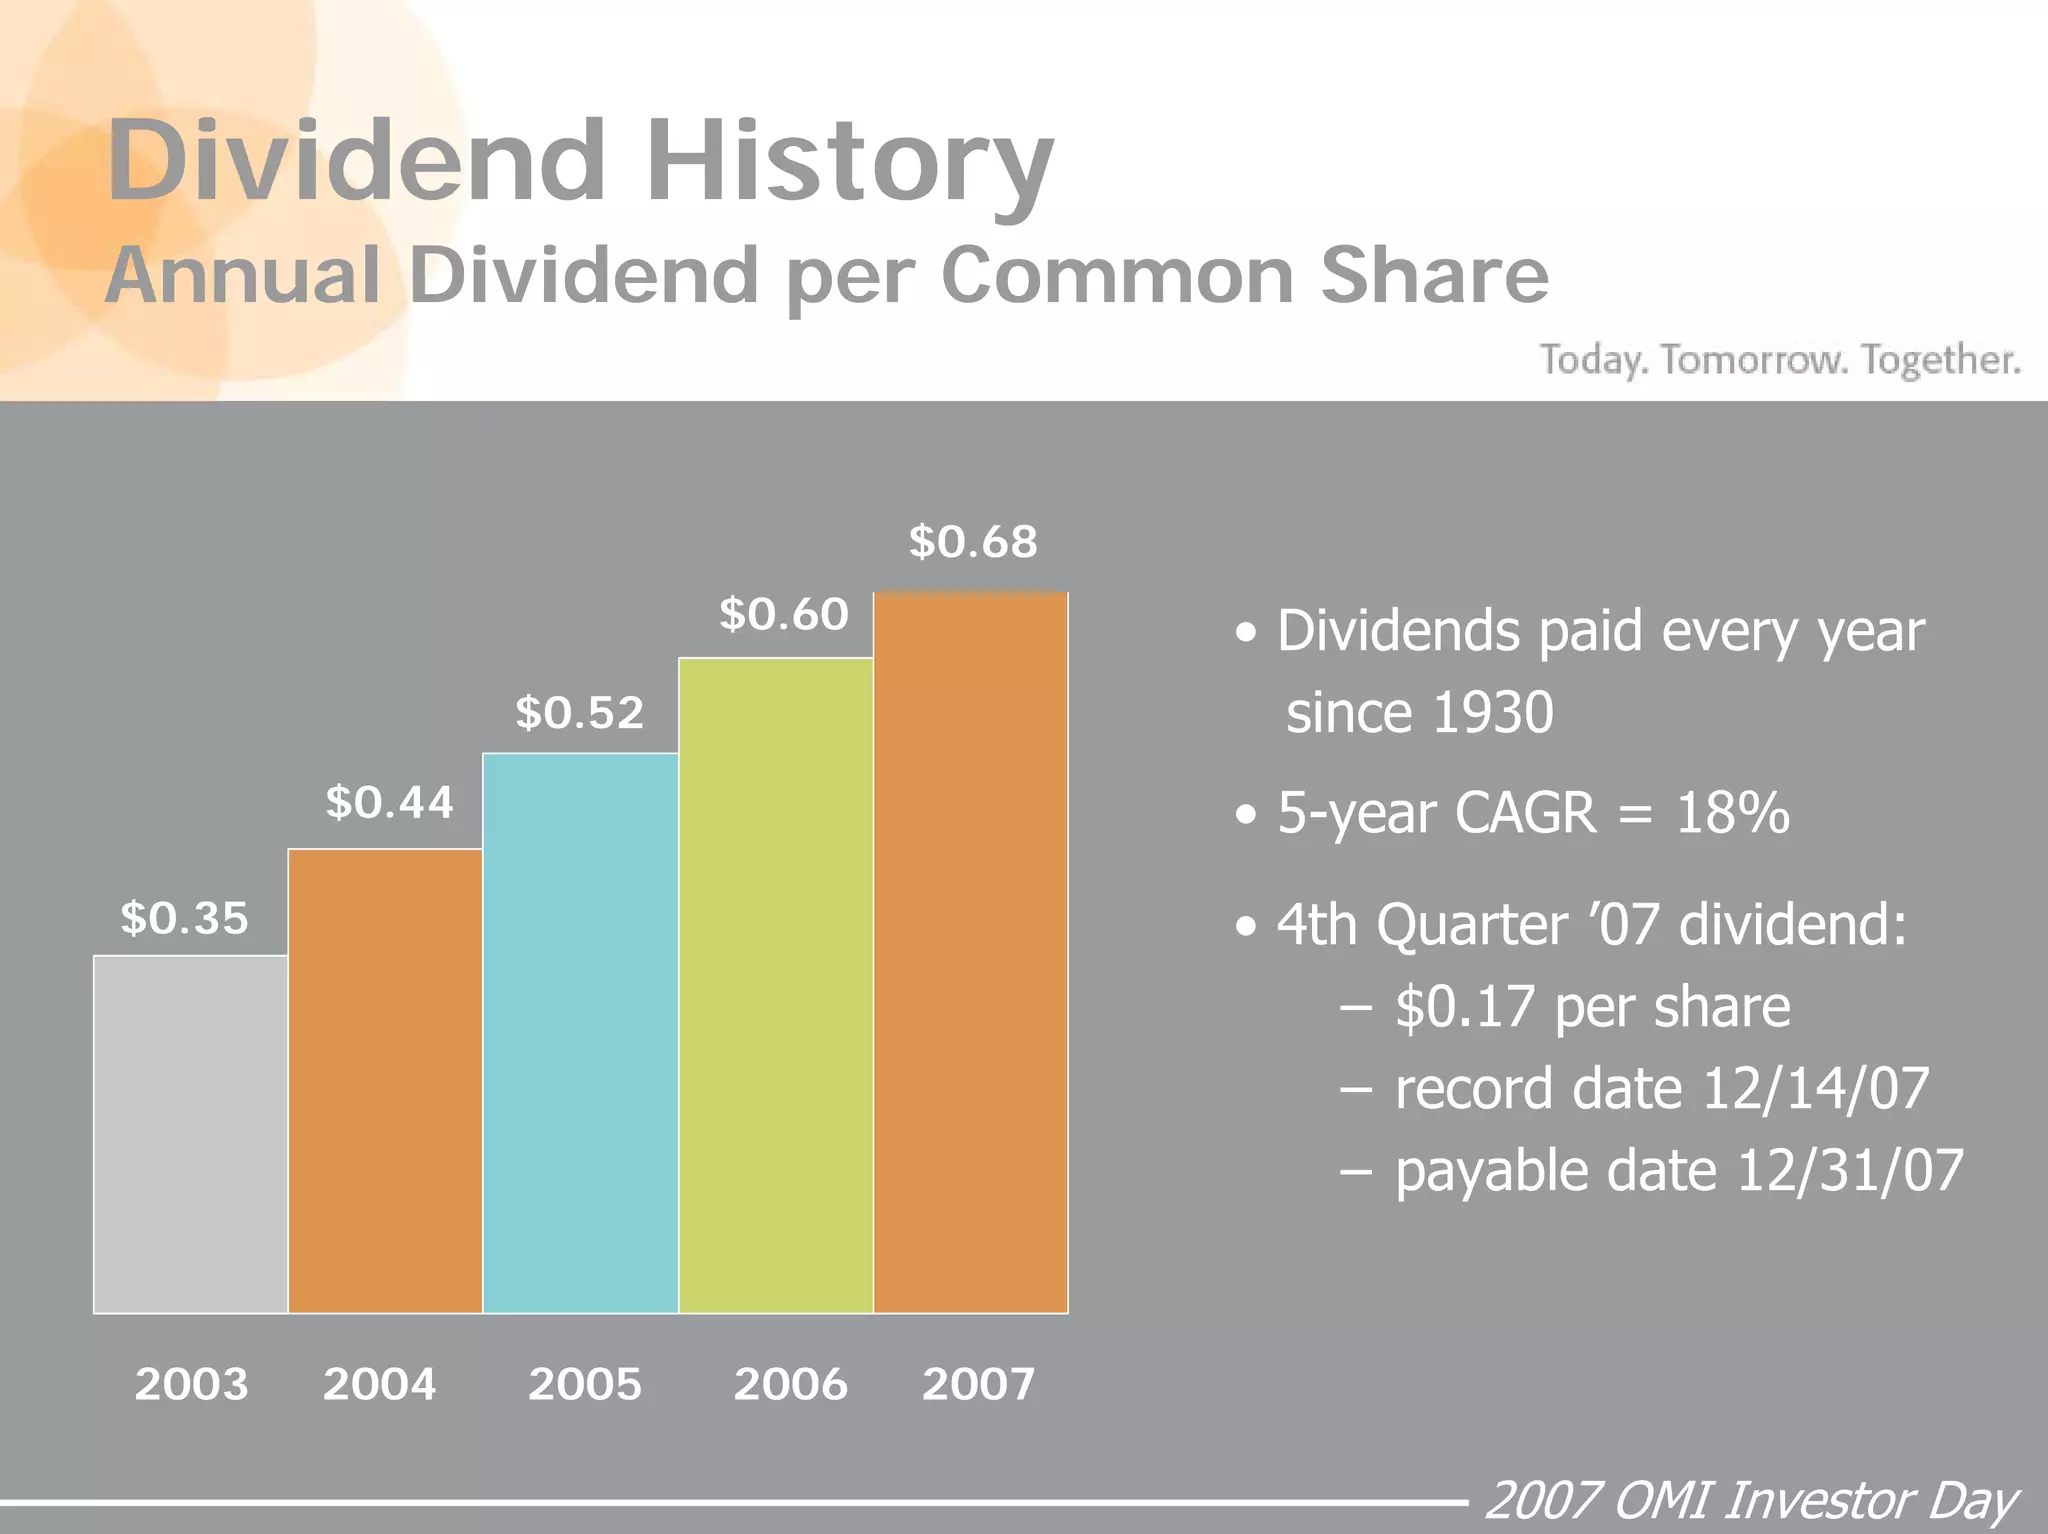
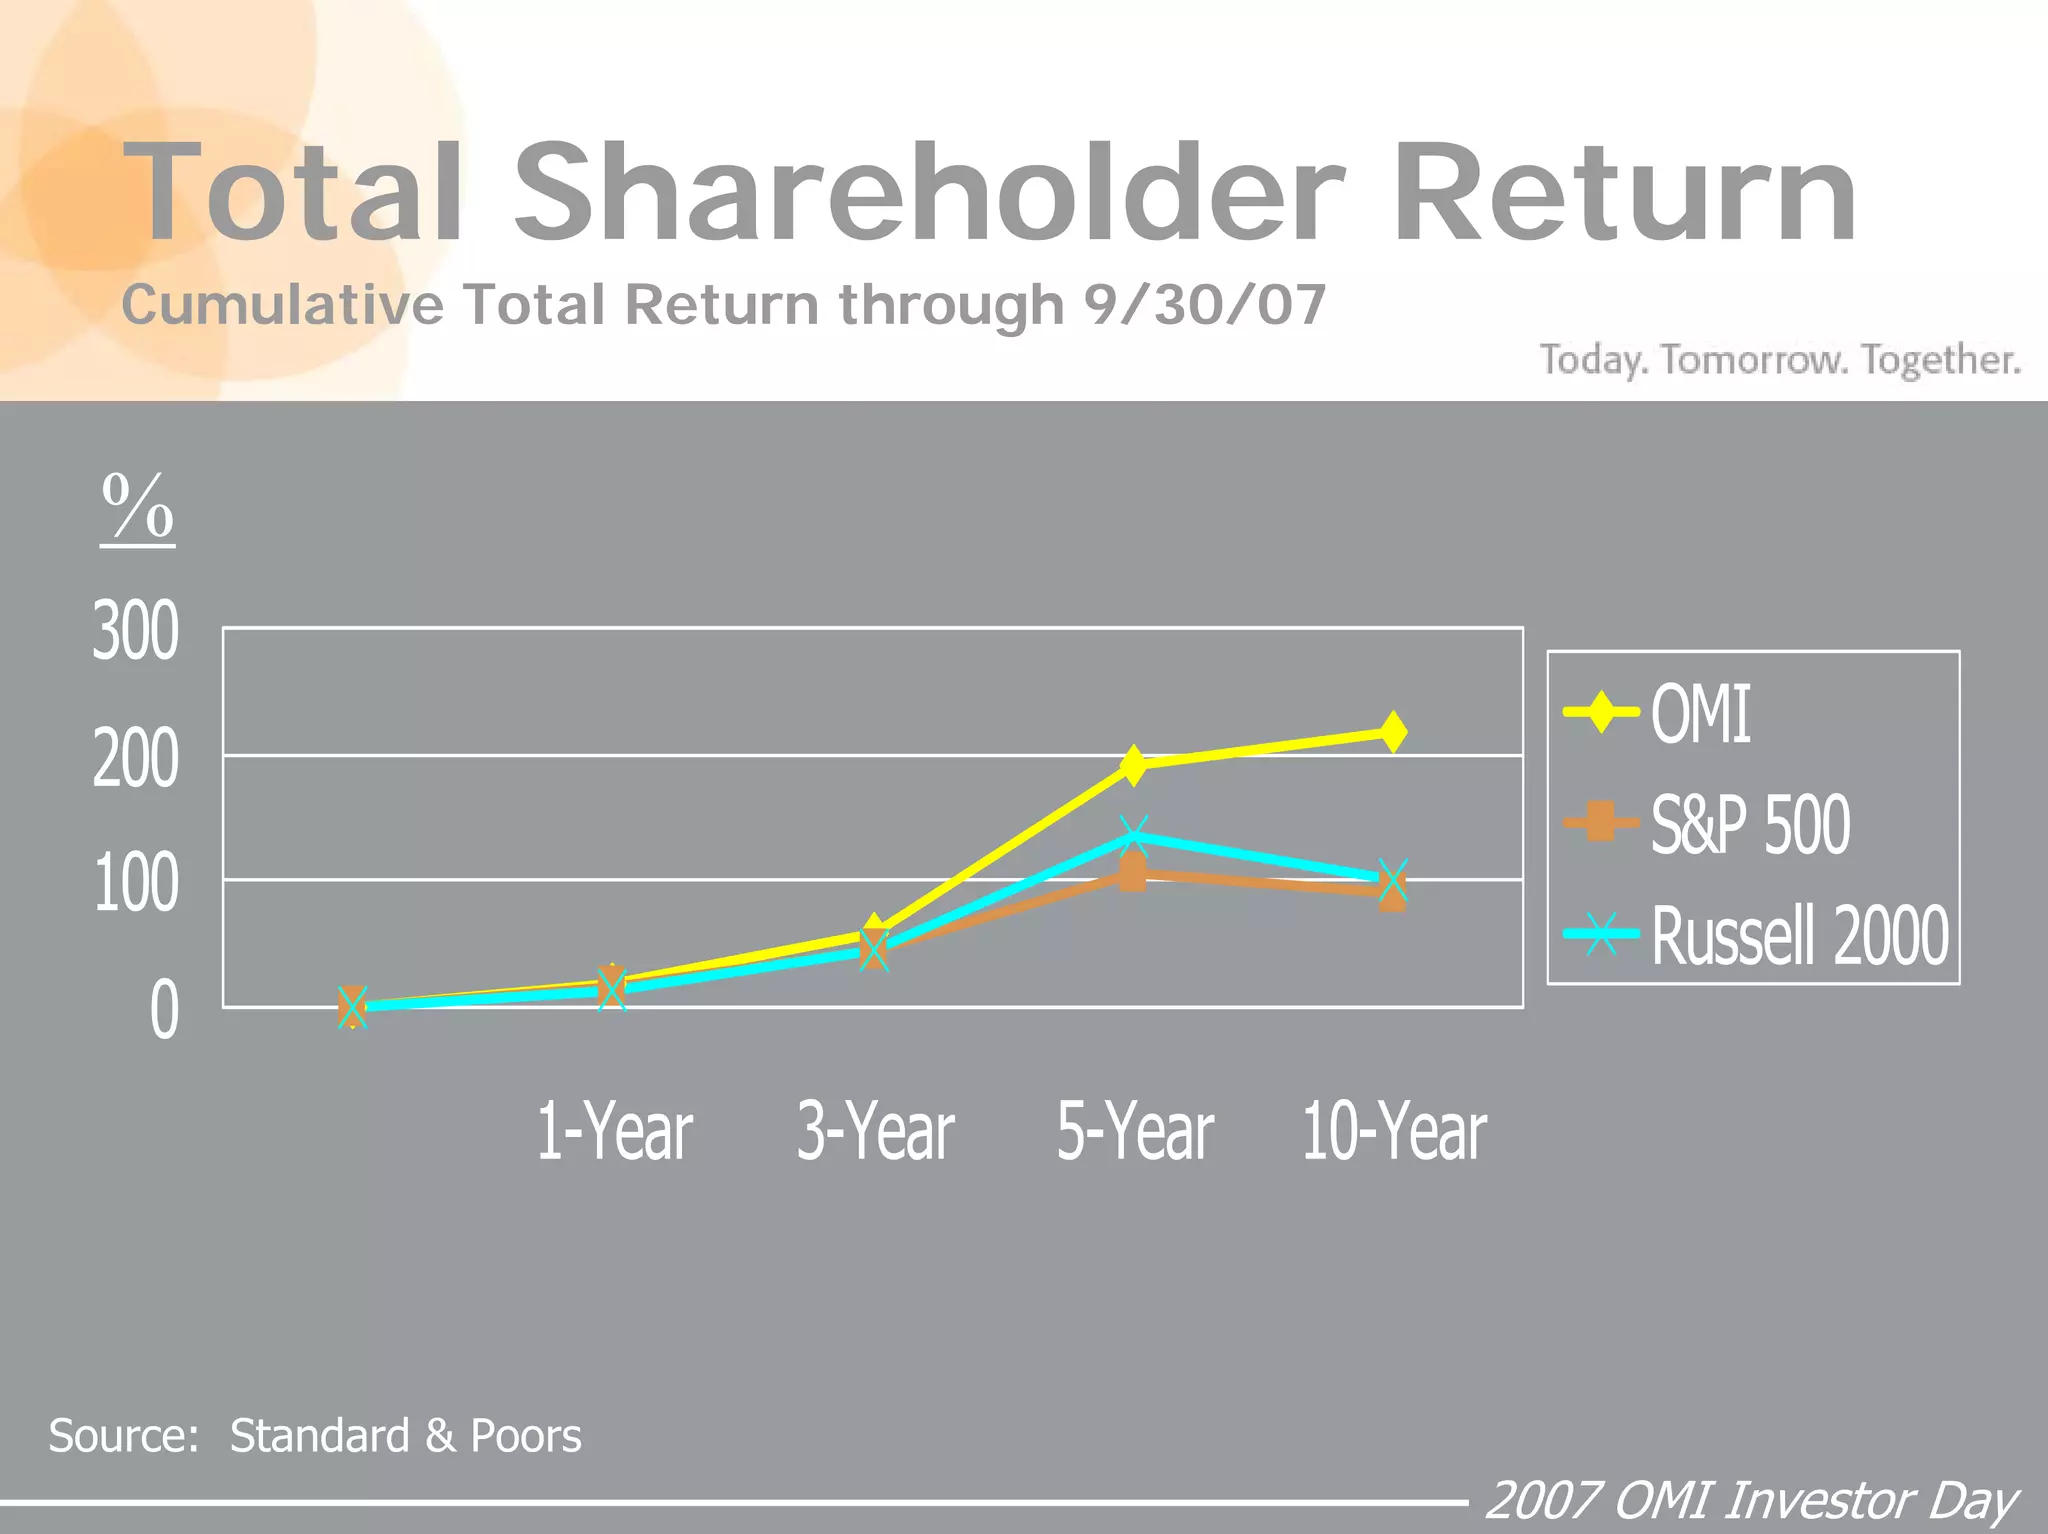


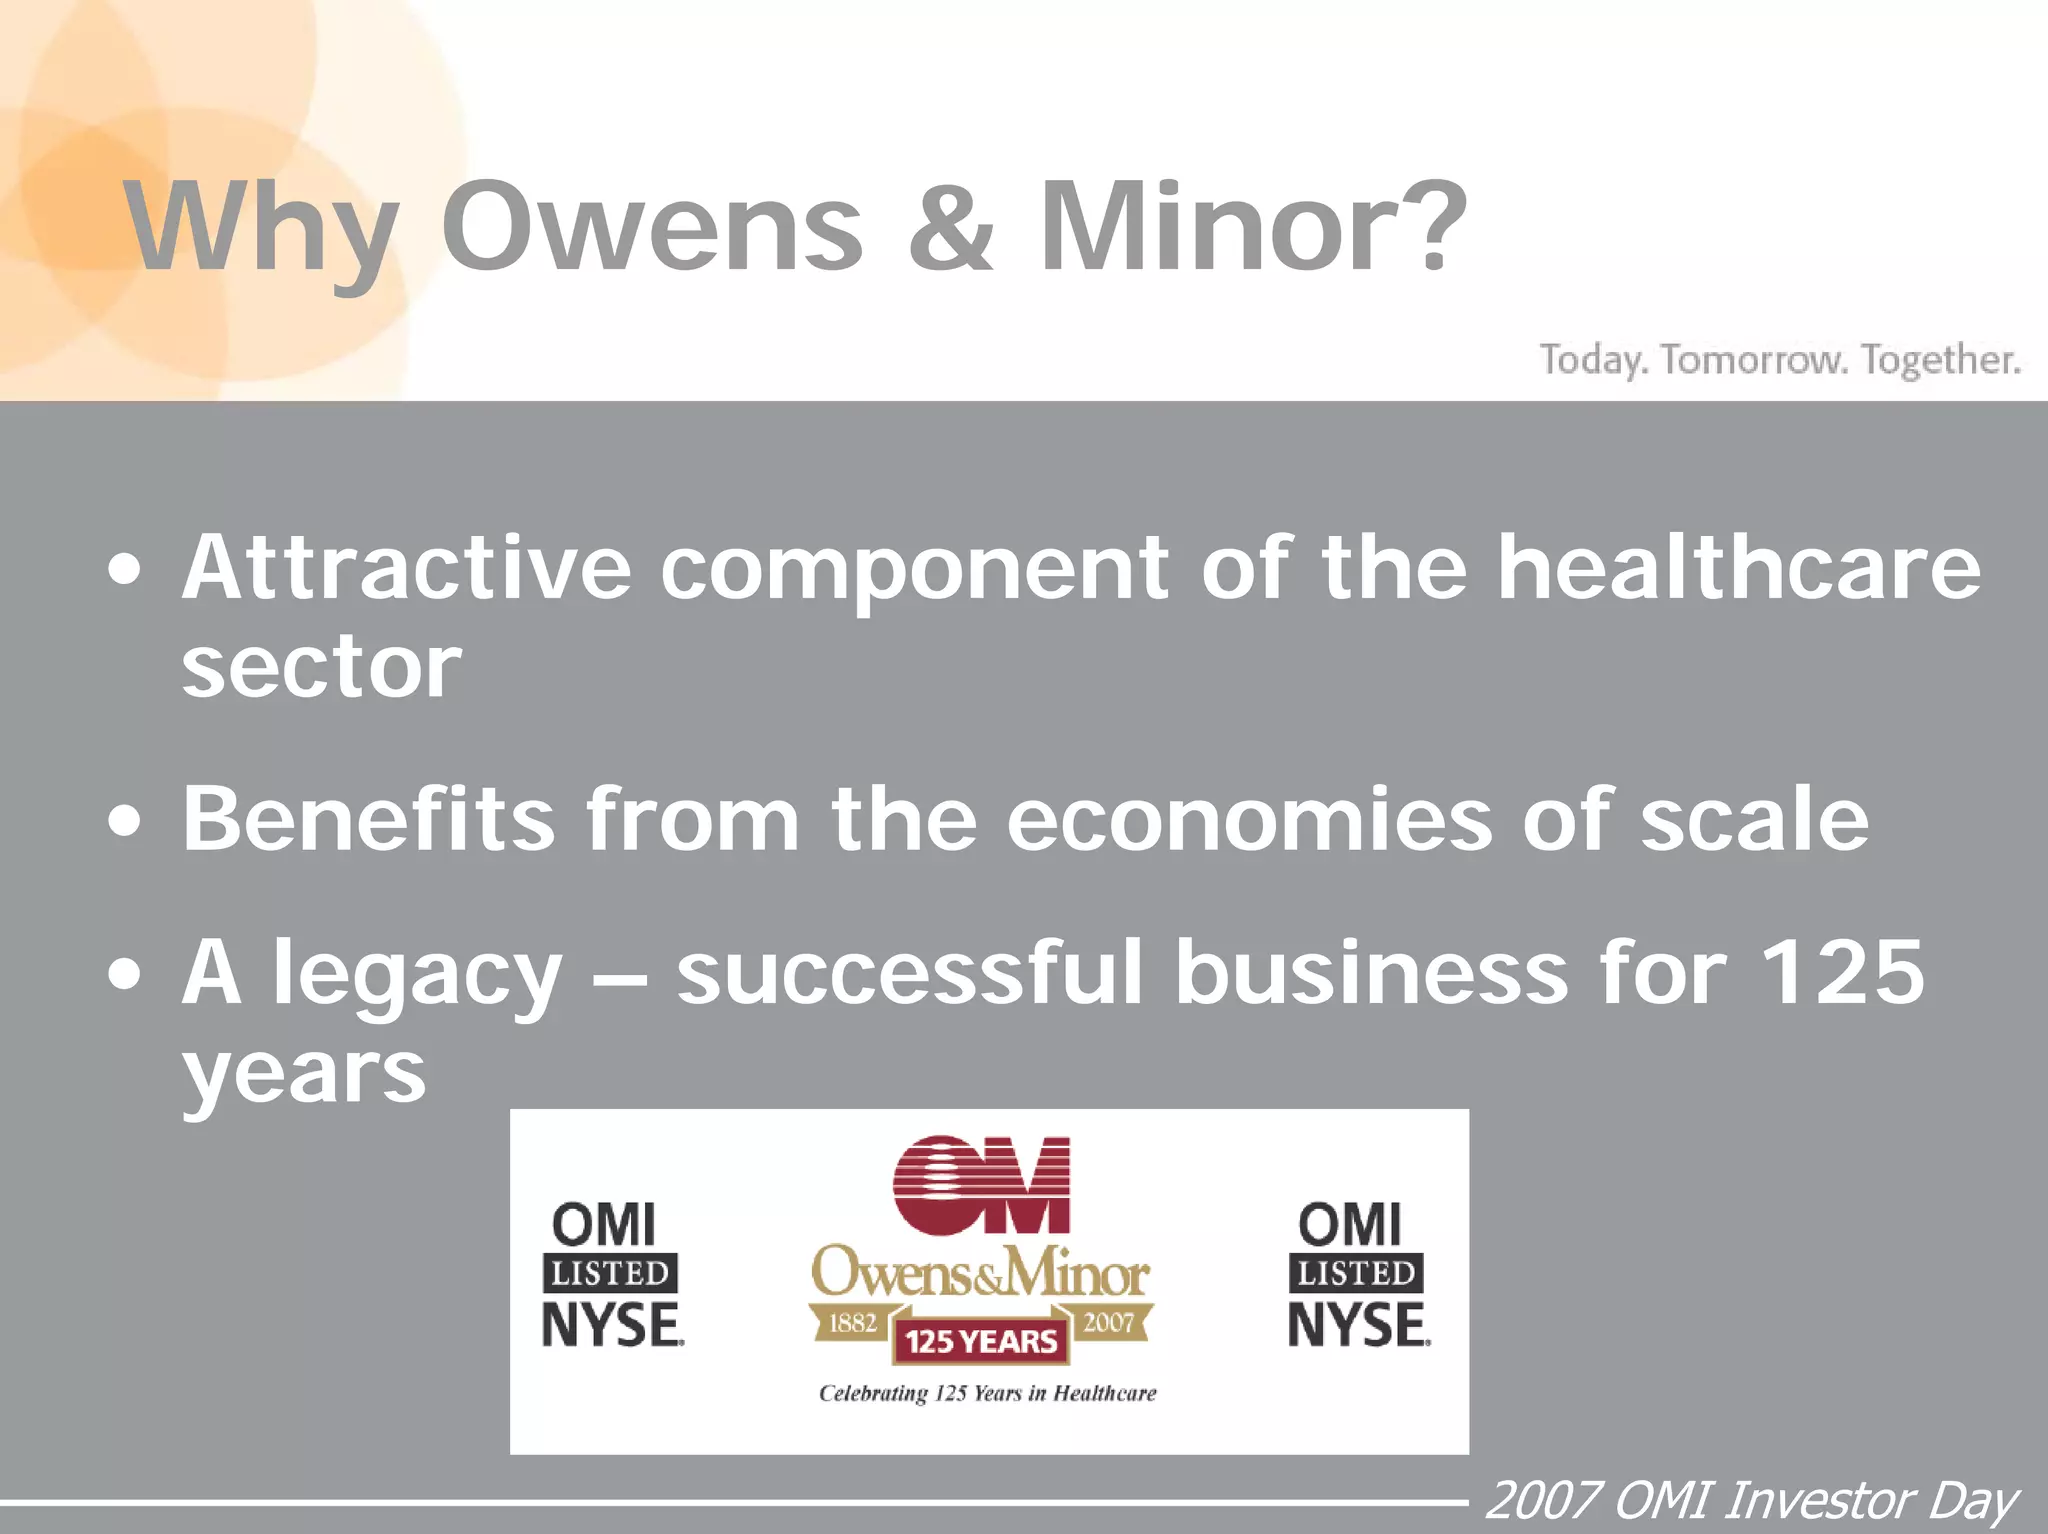


The document outlines Owens & Minor's 2007 Investor Day presentation which discusses the company's strategic direction and financial outlook. It provides an overview of Owens & Minor's market position as a leading distributor of medical supplies, its focus on customer service excellence and partnerships with suppliers. The presentation also reviews the company's financial performance, goals to expand into new product lines and markets, and outlook for continued revenue growth and margin improvement in 2008.


