Download as PDF, PPTX
![Open Source Monitoring Conference 2017
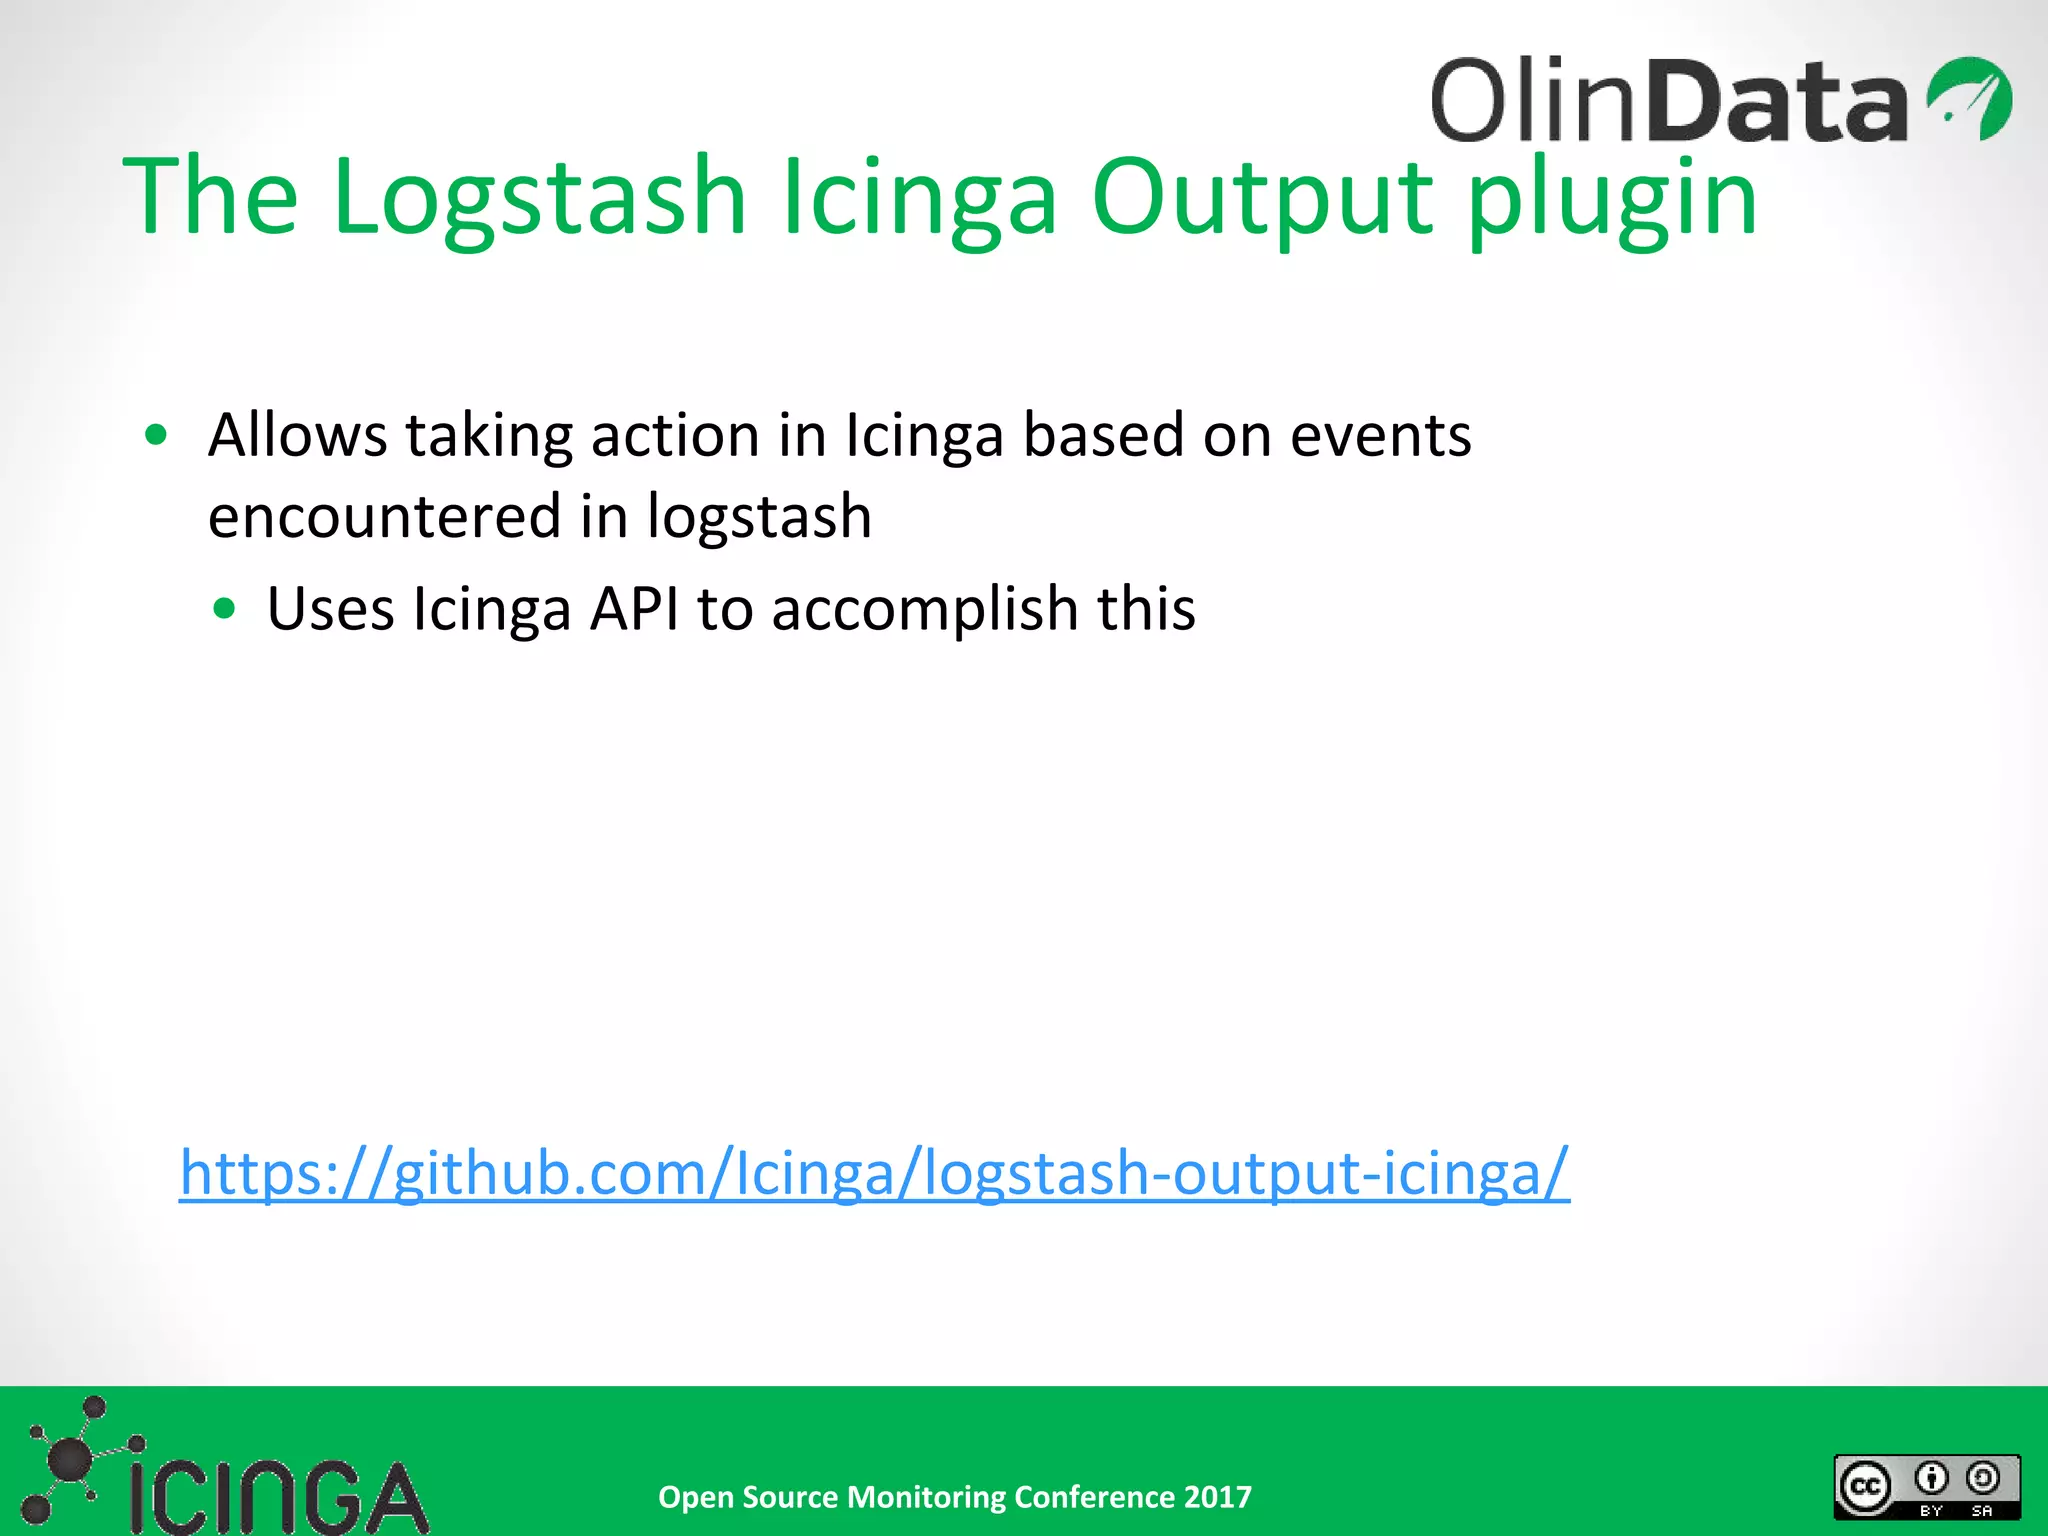
• Essentially tails a given
set of files and sends new
events to defined outputs
• Output can be straight
to Elastic, but
commonly first to
Logstash
• Specify the type of
document or input to
allow for further
processing at a later stage
What is Filebeat and why should you care?
filebeat.prospectors:
- input_type: log
paths:
- /var/log/backup.log
output.logstash:
hosts: ["localhost:5044"]](https://image.slidesharecdn.com/osmc2017walterhecklogmonitoringwithlogstashandicinga-171129125110/75/OSMC-2017-Log-Monitoring-with-Logstash-and-Icinga-by-Walter-Heck-5-2048.jpg)
![Open Source Monitoring Conference 2017
Configure Icinga
object ApiUser "icinga" {
password = "icinga"
client_cn = NodeName
permissions = [ "*" ]
}
apply Service "backup" {
import "generic-service"
check_command = "dummy"
assign where host.address
}](https://image.slidesharecdn.com/osmc2017walterhecklogmonitoringwithlogstashandicinga-171129125110/75/OSMC-2017-Log-Monitoring-with-Logstash-and-Icinga-by-Walter-Heck-16-2048.jpg)
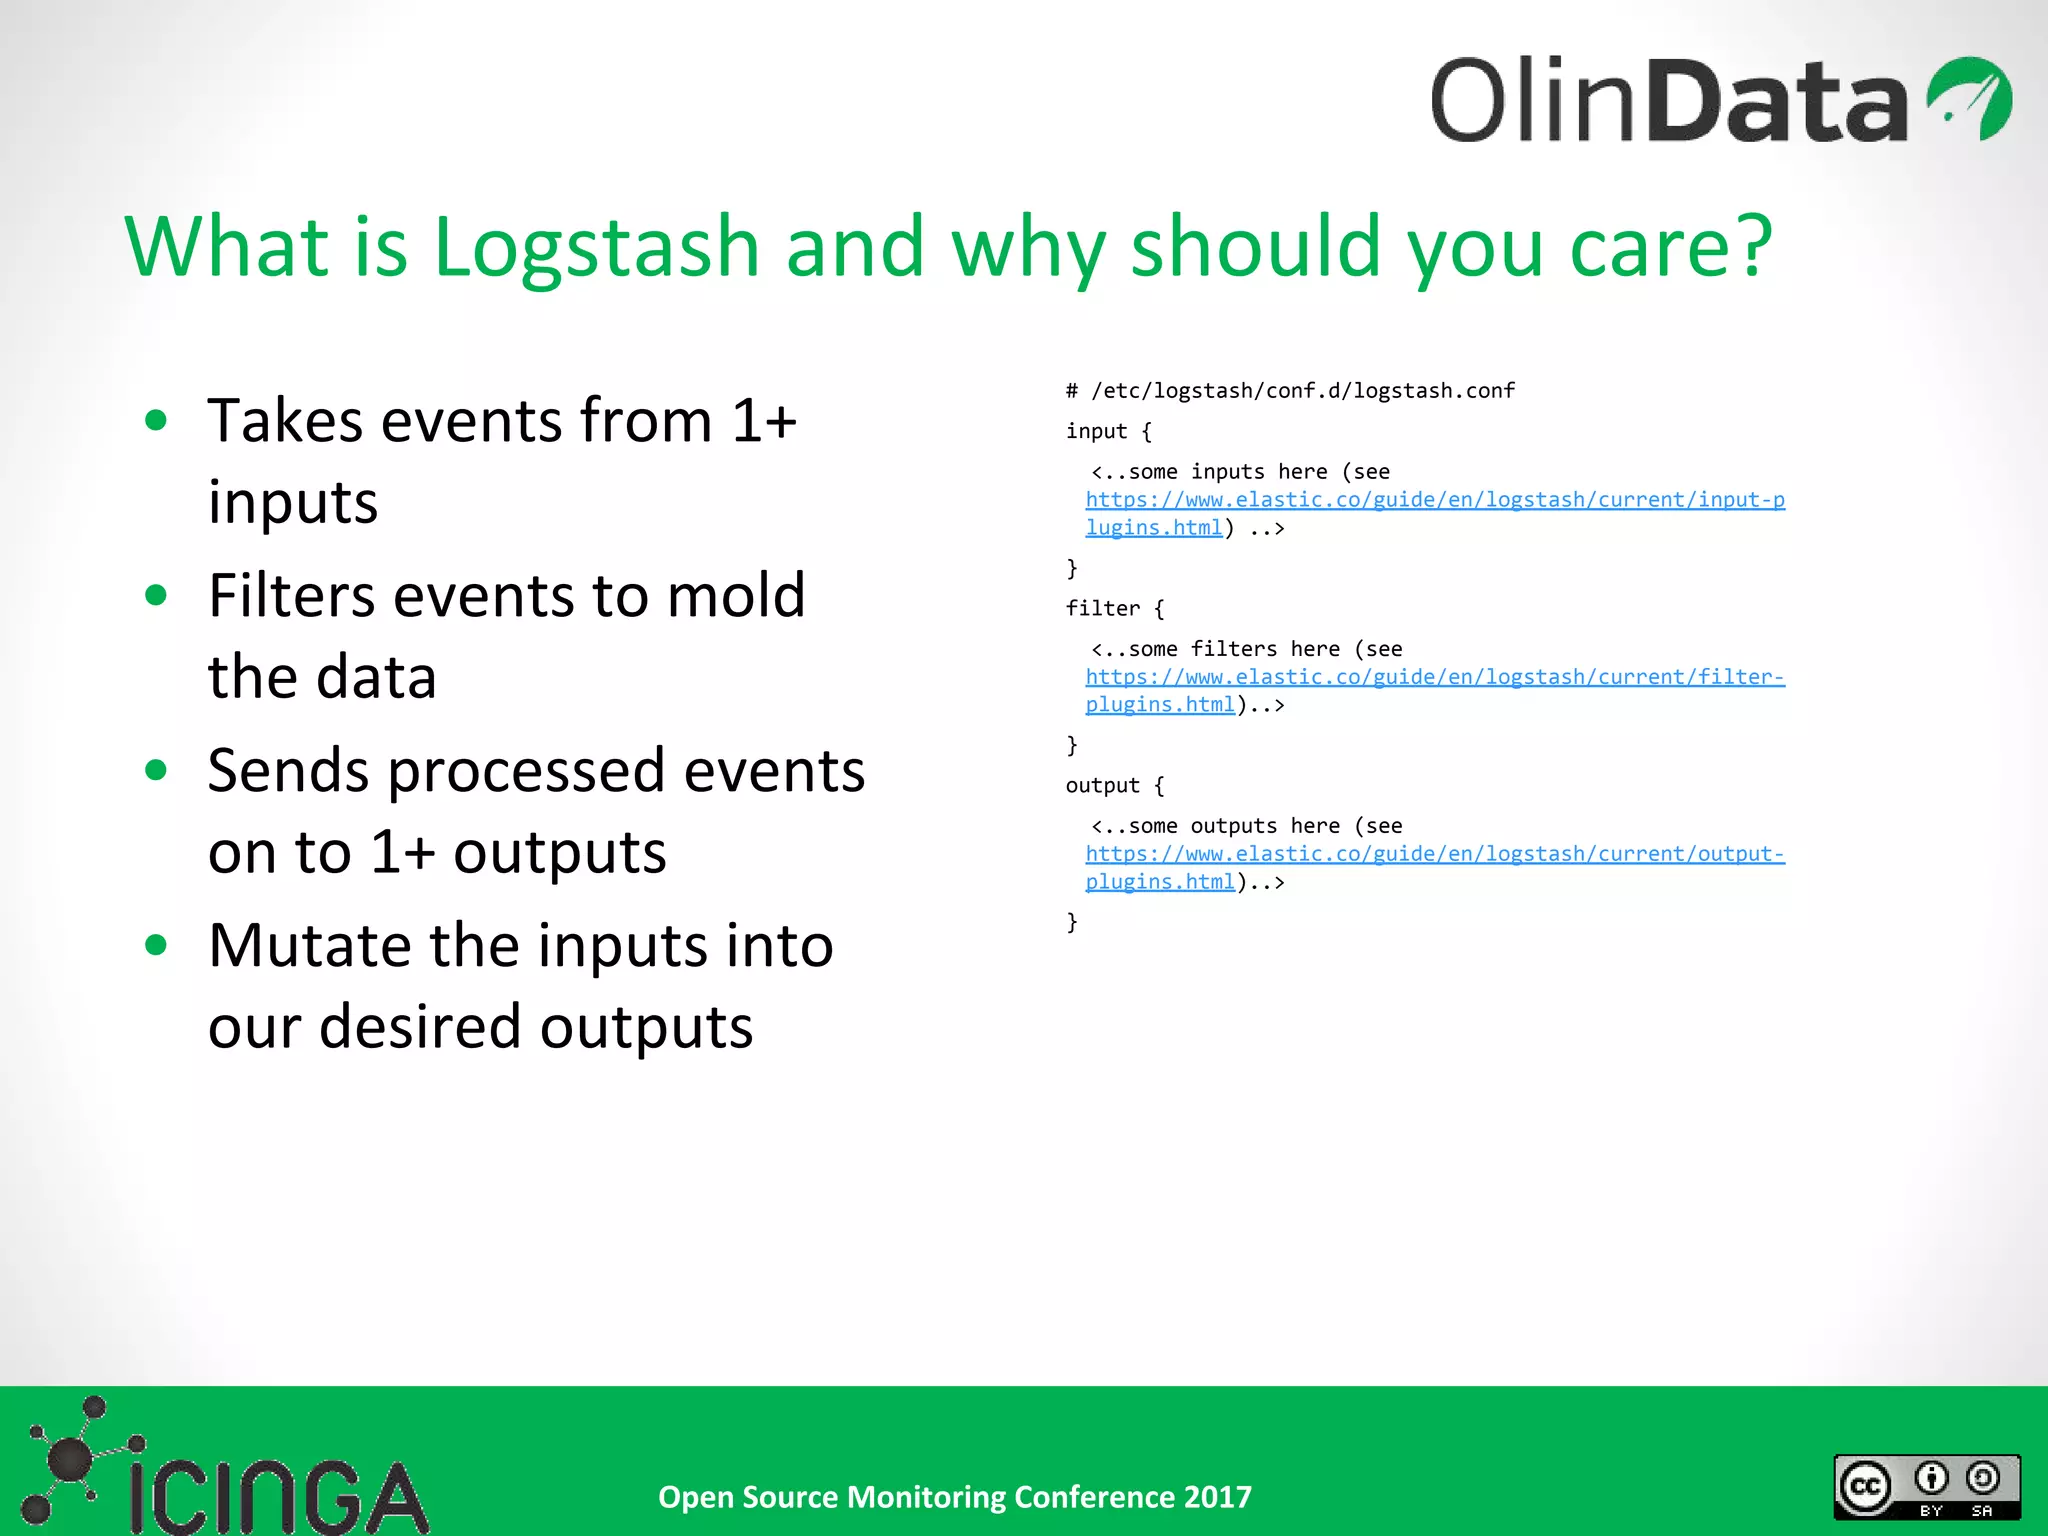
![Open Source Monitoring Conference 2017
input {
beats {
port => 5044
type => "logs"
}
}
filter {
if [syslog_severity] == "error" {
mutate {
replace => { "exit_status" => "2" }
}
}
if [source] == "/var/log/mypreciouslog.json" {
json {
source => "message"
}
}
}
Configure logstash
output {
icinga {
host => 'localhost'
user => 'icinga'
password => 'icinga'
ssl_verify => false
action => 'process-check-result'
action_config => {
exit_status => "%{exit_status}"
plugin_output => "%{message}"
}
icinga_host => "%{hostname}"
icinga_service => "backup"
}
elasticsearch {
hosts => [ "localhost:9200" ]
}
stdout {
}
}](https://image.slidesharecdn.com/osmc2017walterhecklogmonitoringwithlogstashandicinga-171129125110/75/OSMC-2017-Log-Monitoring-with-Logstash-and-Icinga-by-Walter-Heck-17-2048.jpg)


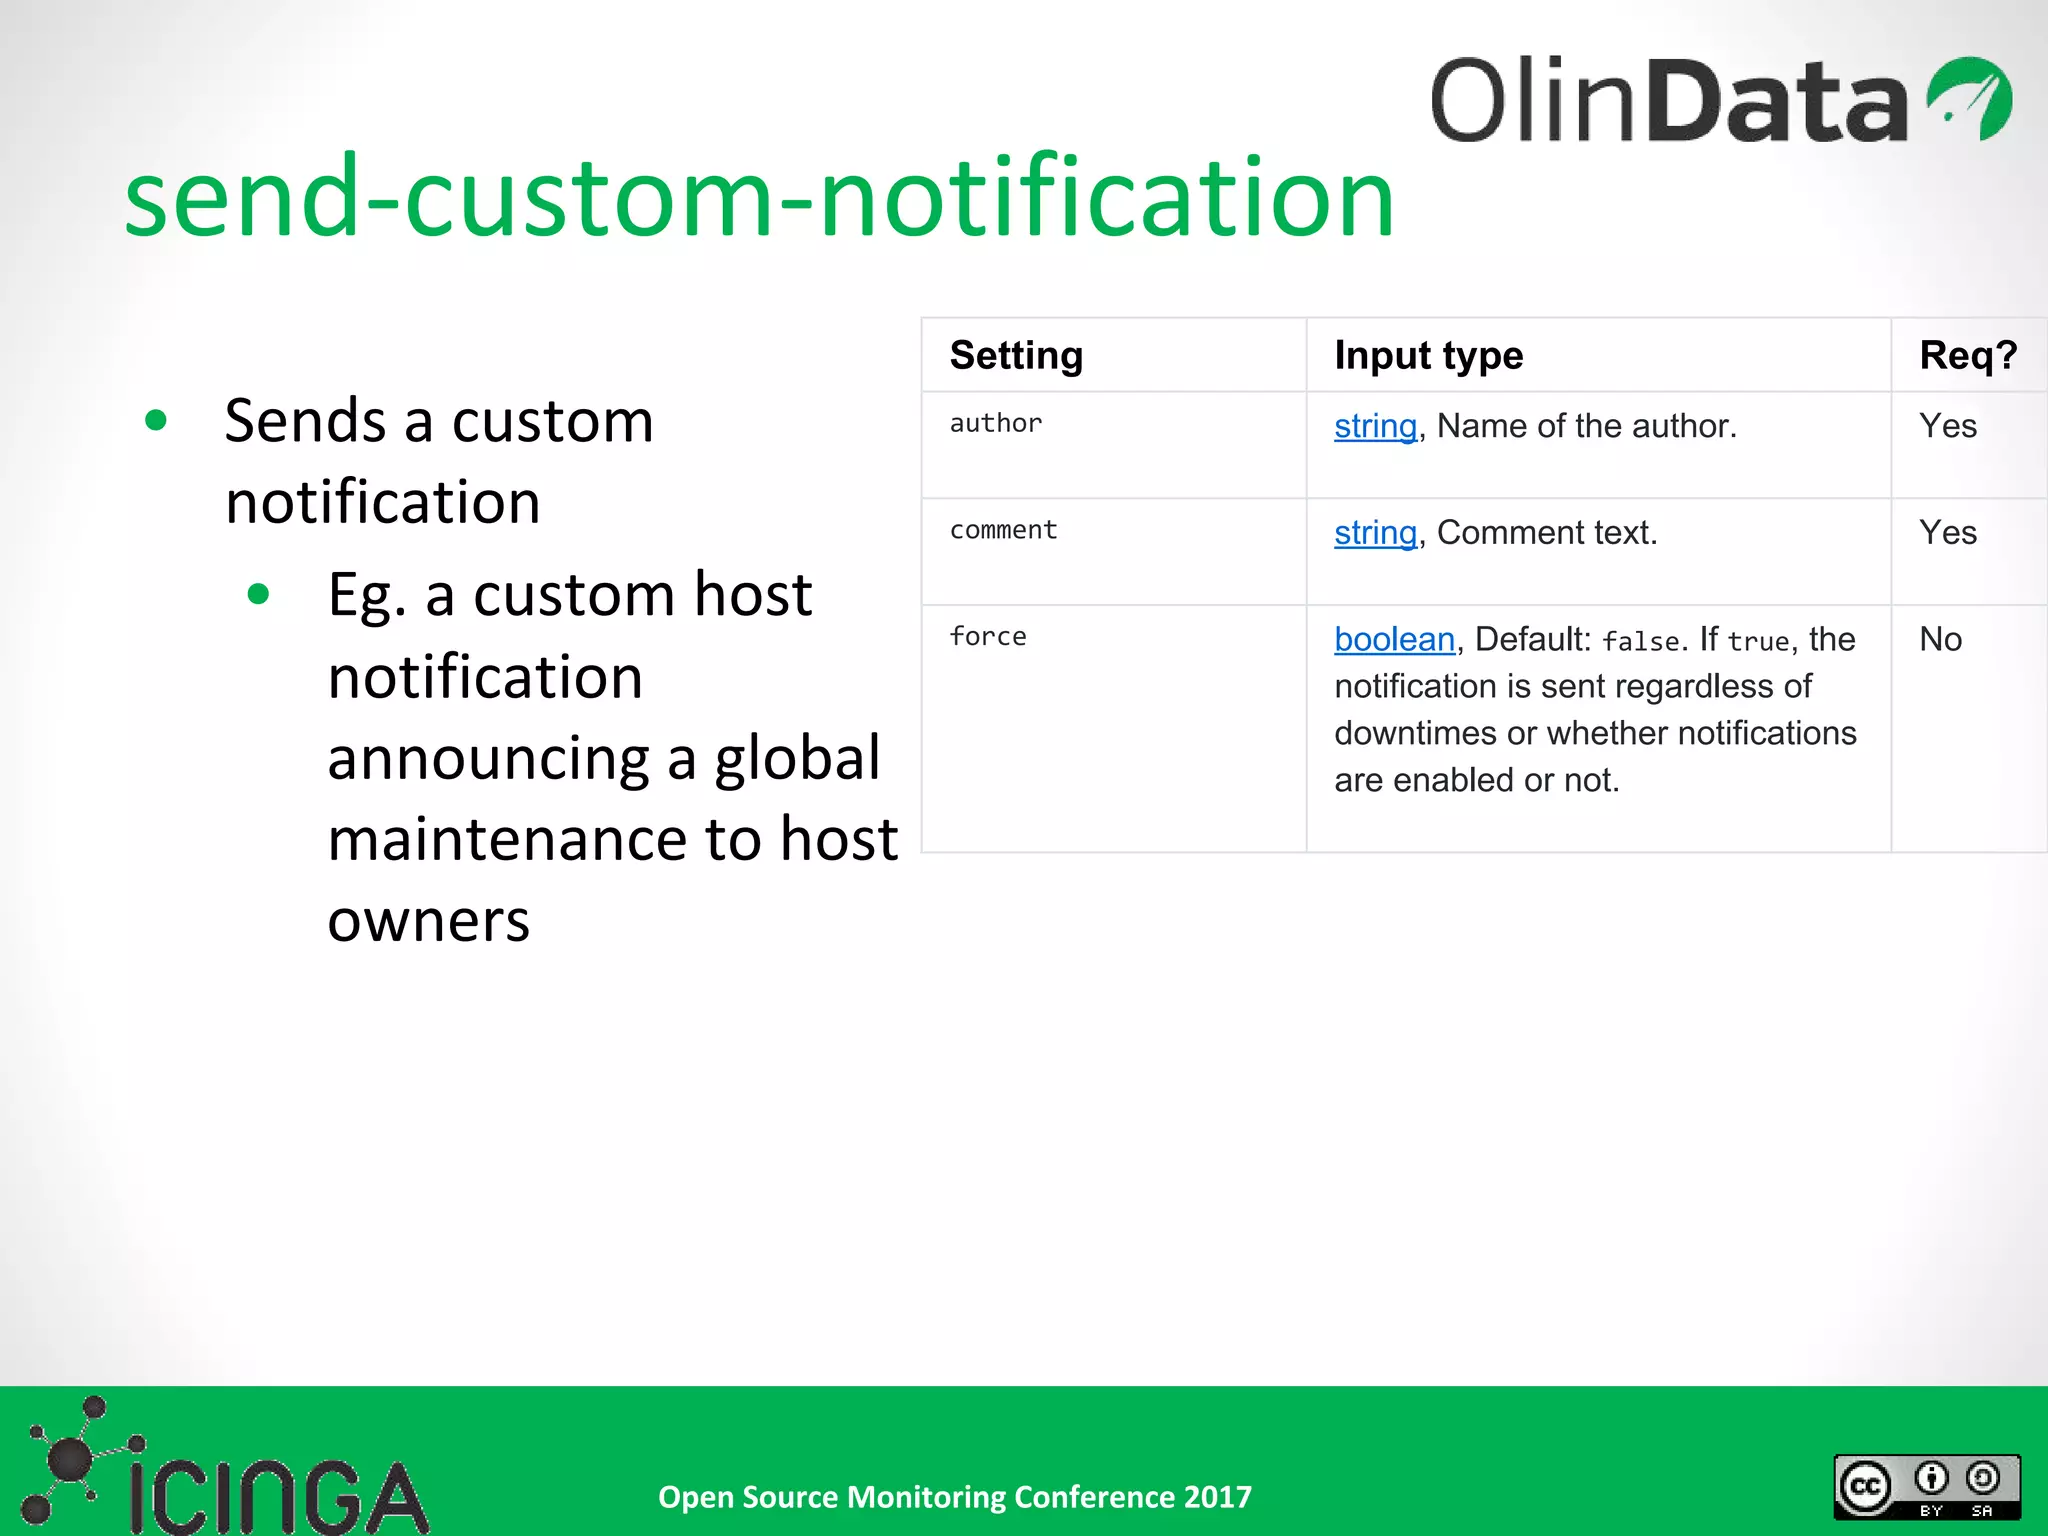
The document provides an introduction to log monitoring using Logstash and Icinga, highlighting the roles of Elastic, Logstash, and Filebeat in centralized logging and event processing. It covers configuration examples, Logstash plugin functionalities, and integration with Icinga for monitoring backups and managing alerts based on log events. The presentation also invites queries and mentions job opportunities at Olindata.