SlideShare a Scribd company logo
1 of 139
Order Code RL34309
How Crime in the United States Is Measured
January 3, 2008
Nathan James
Analyst in Crime Policy
Domestic Social Policy Division
Logan Rishard Council
Intern
Domestic Social Policy Division
http://www.fas.org/sgp/crs/misc/index.html
How Crime in the United States Is Measured
Summary
Crime data collected through the Uniform Crime Reports
(UCR), the National
Incident-Based Reporting System (NIBRS), and the National
Crime Victimization
Survey (NCVS) are used by Congress to inform policy decisions
and allocate federal
criminal justice funding to states. As such, it is important to
understand how each
program collects and reports crime data, and the limitations
associated with the data.
This report reviews (1) the history of the UCR, the NIBRS, and
the NCVS; (2)
the methods each program uses to collect crime data; and (3) the
limitations of the
data collected by each program. The report then compares the
similarities and
differences of UCR and NCVS data. It concludes by reviewing
issues related to the
NIBRS and the NCVS.
The UCR represents the first effort to create a national,
standardized measure
of the incidence of crime. It was conceived as a way to measure
the effectiveness of
local law enforcement and to provide law enforcement with data
that could be used
to help fight crime. UCR data are now used extensively by
researchers, government
officials, and the media for research, policy, and planning
purposes. The UCR also
provides some of the most commonly cited crime statistics in
the United States. The
UCR reports offense and arrest data for 8 different Part I
offenses and arrest data for
21 different Part II offenses.
The NIBRS was developed by the Federal Bureau of
Investigation to respond
to the law enforcement community’s belief that the UCR needed
to be updated to
provide more in-depth data to meet the needs of law
enforcement into the 21st
century. The NIBRS collects data, including data on offense(s),
offender(s),
victim(s), arrestee(s), and any property involved in an offense,
for 46 different Group
A offenses and 11 different Group B offenses. Despite the more
detailed crime data
that the NIBRS can provide, nationwide implementation of the
program has been
slow, for a variety of reasons, including cost considerations.
The NCVS is the primary source of information on the
characteristics of
criminal victimization, and on the number and types of crime
not reported to law
enforcement. The NCVS has four major objectives: (1) to
develop detailed
information about the victims and consequences of crime, (2) to
estimate the number
and types of crimes not reported to police, (3) to provide
uniform measures of
selected types of crimes, and (4) to permit comparisons over
time and population
type (e.g., urban, suburban, and rural). The NCVS asks
respondents whether they
have been the victim of rape and sexual assault, robbery, simple
and aggravated
assault, purse snatching/pickpocketing, burglary, theft, or motor
vehicle theft. In
addition to collecting data on the number of victimizations, the
NCVS gathers data
on the details of each incident of victimization. This report will
be updated as
warranted.
Contents
Introduction . . . . . . . . . . . . . . . . . . . . . . . . . . . . . . . . . . . . . .
. . . . . . . . . . . . . . . . 1
Uniform Crime Reports (UCR) . . . . . . . . . . . . . . . . . . . . . . . .
. . . . . . . . . . . . . . . 2
UCR’s History . . . . . . . . . . . . . . . . . . . . . . . . . . . . . . . . . . . .
. . . . . . . . . . . . 3
How UCR Data Are Collected . . . . . . . . . . . . . . . . . . . . . . . . .
. . . . . . . . . . . 5
UCR Participation in the United States . . . . . . . . . . . . . . . . . .
. . . . . . . 5
State UCR Programs . . . . . . . . . . . . . . . . . . . . . . . . . . . . . . . .
. . . . . . . 6
UCR Data . . . . . . . . . . . . . . . . . . . . . . . . . . . . . . . . . . . . . . . .
. . . . . . . . 7
Scoring and Classifying UCR Data . . . . . . . . . . . . . . . . . . . . .
. . . . . . . 8
Development of the NIBRS . . . . . . . . . . . . . . . . . . . . . . . . . . .
. . . . . . . . . . 11
The NIBRS Compared with the UCR . . . . . . . . . . . . . . . . . . . .
. . . . . . . . . 13
NIBRS Data . . . . . . . . . . . . . . . . . . . . . . . . . . . . . . . . . . . . . .
. . . . . . . 13
NIBRS Certification . . . . . . . . . . . . . . . . . . . . . . . . . . . . . . . .
. . . . . . . 14
Classifying and Scoring NIBRS Data . . . . . . . . . . . . . . . . . . . .
. . . . . 15
Advantages of the NIBRS . . . . . . . . . . . . . . . . . . . . . . . . . . . .
. . . . . . 16
Transition to the NIBRS . . . . . . . . . . . . . . . . . . . . . . . . . . . . .
. . . . . . . . . . 17
Limitations of UCR and NIBRS Data . . . . . . . . . . . . . . . . . . . .
. . . . . . . . . 17
Limited Offense Data . . . . . . . . . . . . . . . . . . . . . . . . . . . . . . .
. . . . . . . 17
Unreported Crimes . . . . . . . . . . . . . . . . . . . . . . . . . . . . . . . . .
. . . . . . . 18
Reporting Practices of Law Enforcement . . . . . . . . . . . . . . . . .
. . . . . 18
Missing Data . . . . . . . . . . . . . . . . . . . . . . . . . . . . . . . . . . . . .
. . . . . . . 19
Imputation Procedures . . . . . . . . . . . . . . . . . . . . . . . . . . . . . .
. . . . . . . 19
National Crime Victimization Survey (NCVS) . . . . . . . . . . . . .
. . . . . . . . . . . . . 21
NCVS’ History . . . . . . . . . . . . . . . . . . . . . . . . . . . . . . . . . . . .
. . . . . . . . . . . 21
How NCVS Data Are Collected . . . . . . . . . . . . . . . . . . . . . . . .
. . . . . . . . . 28
NCVS Data . . . . . . . . . . . . . . . . . . . . . . . . . . . . . . . . . . . . . .
. . . . . . . 28
NCVS Methodology . . . . . . . . . . . . . . . . . . . . . . . . . . . . . . . .
. . . . . . 29
Limitations of NCVS Data . . . . . . . . . . . . . . . . . . . . . . . . . . . .
. . . . . . . . . . 33
Sampling and Non-sampling Error . . . . . . . . . . . . . . . . . . . . . .
. . . . . 33
Sampling Bias . . . . . . . . . . . . . . . . . . . . . . . . . . . . . . . . . . . .
. . . . . . . 33
Series Victimizations . . . . . . . . . . . . . . . . . . . . . . . . . . . . . . .
. . . . . . . 34
Changes in Household Residents . . . . . . . . . . . . . . . . . . . . . . .
. . . . . . 35
Limitations on the Scope of Crimes Covered . . . . . . . . . . . . . .
. . . . . 35
Survey Design and Implementation . . . . . . . . . . . . . . . . . . . . .
. . . . . . 36
The UCR Compared with the NCVS . . . . . . . . . . . . . . . . . . . . .
. . . . . . . . . . . . . 37
Select Issues . . . . . . . . . . . . . . . . . . . . . . . . . . . . . . . . . . . . . .
. . . . . . . . . . . . . . . 38
Implementing the NIBRS Nationwide . . . . . . . . . . . . . . . . . . . .
. . . . . 39
Does the NIBRS Increase the Crime Rate? . . . . . . . . . . . . . . . .
. . . . . 41
Decreases in the NCVS Sample Size . . . . . . . . . . . . . . . . . . . .
. . . . . . 43
Appendix A. Status of UCR and NIBRS Reporting, by State . . .
. . . . . . . . . . . . 45
Appendix B. UCR Part I and Part II Offenses . . . . . . . . . . . . . .
. . . . . . . . . . . . . 47
Appendix C. UCR Hierarchy of Part I Offenses . . . . . . . . . . . .
. . . . . . . . . . . . . 48
Appendix D. NIBRS Data Elements . . . . . . . . . . . . . . . . . . . . .
. . . . . . . . . . . . . 49
Appendix E. Relationship Between NIBRS Data Elements . . . . .
. . . . . . . . . . . 51
Appendix F. NIBRS Group A and Group B Offenses . . . . . . . . .
. . . . . . . . . . . . 52
Appendix G. UCR Offense Definitions . . . . . . . . . . . . . . . . . . .
. . . . . . . . . . . . . 54
Appendix H. NIBRS Offense Definitions . . . . . . . . . . . . . . . . .
. . . . . . . . . . . . . 58
Appendix I. Number of Households and Persons Interviewed for
the NCVS, by Year
. . . . . . . . . . . . . . . . . . . . . . . . . . . . . . . . . . . . . . . . . . . . . . . .
. . . . . . . . . . . 64
List of Figures
Figure 1. Percentage of Victimizations Reported as Series
Victimizations, 2000-2005
. . . . . . . . . . . . . . . . . . . . . . . . . . . . . . . . . . . . . . . . . . . . . . . .
. . . . . . . . . . . 35
List of Tables
Table 1. Number and Percentage of Cases in Which NIBRS
Crime Rates Differ from
UCR Crime Rates by 5.5% or Less . . . . . . . . . . . . . . . . . . . . . .
. . . . . . . . . 42
1 Currently, there are not enough law enforcement agencies in
the country submitting NIBRS
data for the Federal Bureau of Investigation (FBI) to report
annual crime statistics using
NIBRS data. The FBI still publishes annual crime data using
the UCR summary format (see
below). As such, the FBI converts data submitted from NIBRS-
compliant law enforcement
agencies into UCR summary data.
2 U.S. Congress, Conference Committees, Violent Crime
Control and Law Enforcement Act
of 1994, conference report to accompany H.R. 3355, 103rd
Cong., 2nd sess., H.Rept. 103-711
(Washington: GPO, 1994), p. 372.
3 For more information on how UCR crime data are used in the
JAG program, see CRS
Report RS22416, Edward Byrne Memorial Justice Assistance
Grant Program: Legislative
and Funding History, by Nathan James.
4 For more information on S. 368, H.R. 1700, and the COPS
program, see CRS Report
RL33308, Community Oriented Policing Services (COPS):
Background, Legislation, and
Issues, by Nathan James.
5 U.S. Congress, House Committee on the Judiciary, COPS
Improvement Act of 2007, report
to accompany H.R. 1700, 110th Cong., 1st sess., H.Rept. 110-
150 (Washington: GPO, 2007),
pp. 6-7; U.S. Congress, Senate Committee on the Judiciary,
COPS Improvement Act of 2007,
report to accompany S. 368, 110th Cong., 1st sess., S.Rept. 110-
73 (Washington: GPO, 2007),
(continued...)
How Crime in the United States Is Measured
Introduction
Congress uses data from the Uniform Crime Reports (UCR), the
National
Incident-Based Reporting System (NIBRS),1 and the National
Crime Victimization
Survey (NCVS) to inform policy decisions and develop
appropriate responses to
crime. Such crime data have been used to shape policy in a
variety of ways. For
example, in the 103rd Congress, the Community Oriented
Policing Services (COPS)
program was created to provide state and local law enforcement
agencies with grants
to help them hire, rehire, and redeploy law enforcement officers
to engage in
community policing. Congress cited both UCR and NCVS
crime statistics when
articulating the need for more community policing officers.2
In addition to shaping policy, Congress has used crime data to
develop formula
allocations for certain grant programs. For example, the
Edward Byrne Memorial
Justice Assistance Grant (JAG) program formula uses UCR data
to allocate federal
funds to state and local governments for criminal justice
programs.3
In the 110th Congress, two bills have been introduced (S. 368
and H.R. 1700)
that would increase authorized funding for and expand the scope
of the COPS
program.4 The impetus for the legislation was a recent increase
in the violent crime
rate as reported by the UCR.5 Moreover, both the House and
Senate Appropriations
CRS-2
5 (...continued)
pp. 3, 7.
6 U.S. Congress, House Committee on Appropriations,
Subcommittee on Commerce, Justice,
Science, and Related Agencies, Making appropriations for the
Departments of Commerce
and Justice, and Science, and Related Agencies for the fiscal
year ending September 30,
2008, and for other purposes, report to accompany H.R. 3093,
110th Cong., 1st sess., H.Rept.
110-240 (Washington: GPO, 2007), p. 37.
7 Ibid., pp. 53-54; U.S. Congress, Senate Committee on
Appropriations, Subcommittee on
Commerce, Justice, Science, and Related Agencies,
Departments of Commerce and Justice,
Science, and Related Agencies Appropriations Act, 2008, report
to accompany S. 1745, 110th
Cong., 1st sess., S.Rept. 110-124 (Washington: GPO, 2007), pp.
65-66.
8 Ibid.
Committees recommended increased funding for state and local
law enforcement to
support efforts to fight and prevent crime. The House report
that accompanied the
House Commerce, Justice, and Science appropriations bill
stated that the committee
was concerned about the recent increase in the violent crime
rate.6 In addition, the
House and the Senate Appropriations Committees increased
funding for the Federal
Bureau of Investigation (FBI) to hire additional agents to
investigate violent crime.7
The committees felt it was important for the FBI to help state
and local law
enforcement investigate violent crime in light of the recent
increase in the violent
crime rate.8 The aforementioned legislation and congressional
action were based on
crime data collected by the UCR and the NCVS.
Because of the importance of crime data in both shaping policy
and allocating
federal funding, it is important to understand how each program
collects data and the
limitations of the data. This report reviews (1) the history of
the UCR, the NIBRS,
and the NCVS; (2) the methods each program uses to collect
crime data; and (3) the
limitations of the data collected by each program. The report
then compares the
similarities and differences of UCR and NCVS data. It
concludes by reviewing
issues related to the NIBRS and the NCVS.
Uniform Crime Reports
When the UCR was established in the late 1920s, it represented
the first
national, standardized measure of the incidence of crime. It
was originally conceived
as a way to measure the effectiveness of local law enforcement
to provide law
enforcement with data that could be used to help fight crime.
UCR data are now
used extensively by academics and government officials for
research, policy, and
planning purposes, and the data are widely cited in the media.
The UCR also
provides some of the most commonly cited crime statistics in
the United States. An
effort is currently underway to replace the UCR with the
NIBRS, a more detailed
version of the UCR. However, the transition from the UCR to
the NIBRS has been
slow.
CRS-3
9 U.S. Department of Justice, Federal Bureau of Investigation,
Uniform Crime Reporting
Handbook, Revised 2004, p. 2, hereafter “UCR Handbook.”
10 Michael D. Maltz, Bridging Gaps in Police Crime Data, NCJ
176365, September 1999,
U.S. Department of Justice, Office of Justice Programs, Bureau
of Justice Statistics, p. 4,
hereafter “M.D. Maltz, Bridging Gaps in Police Crime Data.”
11 Ibid.
12 UCR Handbook, p. 2.
13 Ibid.
14 Clayton J. Mosher, Terance D. Miethe, and Dretha M.
Phillips, The Mismeasure of Crime
(Thousand Oaks, CA: Sage Publications, 2002), p. 60, hereafter
“C.J. Mosher et al., The
Mismeasure of Crime.”
15 Ibid.
16 Ibid.
UCR’s History
In 1927, the International Association of Chiefs of Police
(IACP) formed the
Committee on Uniform Crime Records (the Committee) to
develop a system for
collecting uniform crime statistics.9 The IACP felt that a
national system of crime
reporting would put inevitable (and unpredictable) swings in the
number of reported
crimes in a single jurisdiction into a proper context.10 The
IACP felt that putting
changes in local crime incidence in the proper context would
help reduce media
pressure on local jurisdictions and police chiefs from
sensational or sporadic
increases in crime, which had resulted in some police
departments “cooking the
books” to reduce the amount of recorded crime (though there
was no reduction in the
amount of crime reported to the police).11 The Committee
decided that offenses
known to police would be the most appropriate measure of the
incidence of crime in
the United States.12 The Committee — after evaluating various
crimes on the basis
of their seriousness, frequency of occurrence, pervasiveness in
all areas of the
country, and likelihood of being reported to the police —
identified seven crimes for
which local law enforcement would report data to the national
program: felonious
murder, rape, robbery, aggravated assault, burglary,
larceny/theft, and auto theft.13
The IACP focused on these seven crimes because they were
prevalent, generally
serious in their nature, widely identified by victims and
witnesses as criminal
incidents, and most likely to be reported to police.14
Differences in the way that state
criminal codes defined different crimes prevented the IACP
from simply aggregating
state statistics to count the number of offenses known to
police.15 Thus, the IACP
developed standardized offense definitions for the seven offense
categories.
In 1929, IACP published Uniform Crime Reporting, a manual
for police records
and statistics, which included uniform definitions for law
enforcement agencies to
use when submitting data to IACP.16 In that same year, 400
cities in 43 states and the
territories of Puerto Rico, Hawaii, and Alaska submitted
statistics to IACP, which
published the data in Uniform Crime Reports for the United
States and Its
CRS-4
17 Ibid.
18 28 U.S.C. § 534.
19 UCR Handbook, p. 2.
20 Ibid.
21 M.D. Maltz, Bridging Gaps in Police Crime Data, p. 4.
22 UCR Handbook, p. 2.
23 Ibid.
24 Ibid.
25 Ibid.
Possessions.17 In 1930, Congress, at the urging of IACP,
authorized the Attorney
General to collect crime data.18 The Attorney General
designated the FBI as the
clearinghouse for crime data collected through the UCR.19
The scope of the UCR program has continued to expand since it
was created.
Some of the changes to the UCR program include the following:
! Starting in 1952, law enforcement agencies began to submit
data on
the age, sex, and race of people arrested for crimes.20
! Beginning in 1958, the FBI began to estimate annual crime
rates for
the nation as a whole.21 Prior to 1958, the FBI did not
aggregate the
data to the national level because there were not enough law
enforcement agencies submitting data to the FBI to allow it to
report
national crime rates. Instead, the FBI published data in tables
only
according to the size of the reporting jurisdiction.
! In 1958, the FBI created a national crime index to serve as a
general
indicator of criminality in the United States.22 The national
crime
index was the total number of reported murder, rape, robbery,
aggravated assault, burglary, larceny/theft (over $50), and auto
theft
offenses.23
! In 1960, the UCR started to collect national statistics on law
enforcement officers killed.24 In 1972, the UCR started to
collect
specific information on incidents in which law enforcement
officers
were killed or assaulted.25
! In 1962, the UCR, through the Supplementary Homicide
Report
(SHR), started to collect data, where available, on the age, sex,
and
race of murder victims, the weapon used, and the circumstances
surrounding the offense.
CRS-5
26 C.J. Mosher et al., The Mismeasure of Crime, p. 61.
27 UCR Handbook, p. 2.
28 Ibid.
29 For more information on the Hate Crime Statistics Act, see
CRS Report RL33403, Hate
Crime Legislation, by William J. Krouse.
30 UCR Handbook, p. 3.
31 Ibid.
32 The FBI reported that it chose to suspend using the crime
index and the modified crime
index after studying their appropriateness and usefulness for
several years. The FBI
determined that both indexes were not true indicators of the
degree of criminality because
they were driven upward by the offense with the highest
number, typically larceny-theft. The
FBI reported that the sheer volume of those offenses
overshadowed more serious but less
frequently committed offenses, creating a bias against a
jurisdiction with a high number of
larceny-thefts but a low number of other serious crimes such as
murder and forcible rape.
U.S. Department of Justice, Federal Bureau of Investigation,
Crime in the United States,
2005: About CUIS 2005, September 2006, hereafter “About
CUIS 2005.”
! In the late 1960s and throughout the 1970s, there was
continued
growth of state UCR programs, which served as an intermediary
between local law enforcement and the FBI (see below).26
! In 1978, Congress mandated the collection of arson data.27 In
1982,
Congress required the FBI to permanently count arson as a Part
I
offense (a definition of “Part I offense” is below).28 The FBI
started
to publish a “modified crime index,” which included the total
number of reported index crimes plus the total number of
reported
arsons.
! In 1990, following the passage of the Hate Crime Statistics
Act (P.L.
101-275),29 the FBI started to collect data on bias motivation in
criminal incidents in which the offense resulted in whole or in
part
because of the offender’s prejudice against a race, religion,
sexual
orientation, or ethnicity/nationality.30 In 1994, Congress
amended
the Act to require the FBI to collect data on incidents in which
the
offense resulted from the offender’s bias against a physical or
mental
disability.31
! In 2004, the FBI discontinued publishing both the crime index
and
the modified crime index. Since 2004, the FBI has published
only
a violent crime total and a property crime total.32
How UCR Data Are Collected
UCR Participation in the United States. According to the FBI,
17,456
law enforcement agencies in the United States submitted UCR
data in 2005, meaning
CRS-6
33 The Bureau of Justice Statistics reported that in 2004 there
were 17,876 state and local
law enforcement agencies in the United States. U.S.
Department of Justice, Office of Justice
Programs, Bureau of Justice Statistics, Law Enforcement
Statistics. Document on file with
author, available upon request.
34 About CUIS 2005.
35 UCR Handbook, p. 4.
36 Ibid.
that 98%33 of all agencies in the nation participated in the UCR
in 2005.34 Currently,
46 states and the District of Columbia submit UCR data through
a state UCR
program (see Appendix A). In the remaining four states, local
law enforcement
agencies submit UCR data directly to the FBI. In 25 of the
states with a state UCR
program, law enforcement agencies are required by the state to
submit UCR data to
the state program (see Appendix A).
State UCR Programs. In order for UCR data to be collected
from law
enforcement agencies and submitted to the FBI, the state UCR
programs must meet
certain requirements. The FBI established these requirements to
ensure consistency
and comparability in the data it receives from state UCR
programs.35 The FBI has
stated that should circumstances develop whereby a state UCR
program does not
comply with the requirements, the FBI might bypass the state
program and collect
UCR data directly from law enforcement agencies in the
state.36 The FBI’s
requirements for state UCR programs are as follows:
! The state UCR program must conform to national UCR
program
standards, definitions, and information required.
! The agency responsible for collecting UCR data must have a
proven,
effective, statewide program, and it must have instituted
acceptable
quality control procedures.
! The state crime reporting must cover a percentage of the
state’s
population at least equal to that covered by the national UCR
program.
! The state UCR program must have adequate field staff
assigned to
conduct audits and assist contributing agencies in record-
keeping
practices and crime-reporting procedures.
! The state UCR program must regularly provide the FBI with
all of
the detailed data collected from individual law enforcement
agencies
that report to the state UCR program in the form of duplicate
returns,
computer printouts, and/or appropriate electronic media.
CRS-7
37 Ibid.
38 Ibid.
39 Ibid., p. 3.
40 Ibid.
41 A “clearance” is when a known offense is “solved” through
either an arrest or through
exceptional means. An offense is cleared through an arrest
when at least one person is (1)
arrested, (2) charged with the commission of the offense, and
(3) turned over to the court
for prosecution. In some cases, law enforcement cannot follow
the three steps to clear an
offense by arrest. In these cases, law enforcement might be
able to clear an arrest through
exceptional means. An offense is cleared through exceptional
means when a law
enforcement agency can answer all of the following questions in
the affirmative:
! Has the investigation definitively established the identity of
the offender?
! Is there enough information to support an arrest, charge, and
turning over
to the court for prosecution?
! Is the exact location of the offender known so that the subject
could be
taken into custody now?
! Is there some reason outside the law enforcement control that
precludes
arresting, charging, and prosecuting the offender? UCR
handbook, p. 78-
82.
! The state UCR program must have the proven capability
(tested over
a period of time) to supply all the statistical data required in
time to
meet the publication deadlines of the national UCR program.37
The FBI helps state UCR programs meet these requirements by
(1) reviewing
and editing data submitted by individual agencies; (2)
contacting individual agencies
within a state when necessary in connection with crime
reporting matters; (3)
coordinating with the state UCR program to conduct training on
law enforcement
record-keeping and crime-reporting procedures; (4) sending
reporting forms to state
UCR programs so they can be distributed to law enforcement
agencies within the
state; and (5) coordinating individual law enforcement agency
contacts with the state
UCR program.38 The FBI also makes Quality Assurance
Reviews (QARs) available
to state UCR programs. QARs are voluntary and part of the
FBI’s triennial audit of
states’ criminal justice information systems.39 QARs help
ensure that each state UCR
program adheres to summary and incident-based (see discussion
of the NIBRS
below) reporting methods that are consistent with UCR
standards, thereby increasing
uniformity in the data reported.40
UCR Data. The FBI collects data on the number of offenses
known to police,
the number and characteristics of persons arrested, and the
number of “clearances”41
for eight different offenses (see Appendix B), collectively
referred to as Part I
offenses. Part I offenses include murder and nonnegligent
manslaughter, forcible
rape, robbery, aggravated assault, burglary, larceny-theft, motor
vehicle theft, and
arson. The FBI collects data on the number of arrests made for
21 other offenses (see
Appendix B), known as Part II offenses. The UCR is a
summary system, meaning
that offense data submitted to the FBI by local law enforcement
agencies show the
total number of known Part I offenses. Likewise, UCR arrest
data show the total
number of persons arrested by reporting law enforcement
agencies. Arrest data
CRS-8
42 Ibid., p. 96.
43 Ibid., p. 85.
44 About CUIS 2005.
45 Ibid.
46 U.S. Department of Justice, Federal Bureau of Investigation,
Law Enforcement Officers
Killed or Assaulted, 2005.
47 U.S. Department of Justice, Federal Bureau of Investigation,
Hate Crime Statistics, 2005.
48 C.J. Mosher et al., The Mismeasure of Crime, p. 63.
submitted to the UCR program by local law enforcement
agencies also provide data
on the basic characteristics — age, sex, and race — of persons
arrested.42 Because
the UCR is a summary system, there is no way to determine
whether a particular
offense was cleared by an arrest, or whether an arrest was made
pursuant to a certain
offense.
In addition to offense and arrest data, the FBI collects
supplemental data on the
type and value of property stolen and recovered pursuant to
reported crimes.43 The
FBI asks law enforcement agencies across the country to submit
data to the UCR
program on the number of sworn officers and civilian law
enforcement personnel.44
The FBI, through the UCR’s Supplementary Homicide Report
(SHR), collects data
on the age, sex, and race of murder victims and offenders; the
type of weapon(s) used
in the murders; relationships between victims and offenders;
and the circumstances
surrounding each incident.45 The FBI collects data on
incidents in which law
enforcement officers are killed, either feloniously or accidently,
or assaulted while
performing their duties.46 The FBI also collects data on
incidents of hate crime in the
United States. For each hate crime incident, law enforcement
agencies collect data
on the offense type, location, bias motivation, victim type,
number of offenders, and
the apparent race of the offenders.47
Law enforcement agencies submit offense, arrest, clearance, and
SHR data
monthly. Law enforcement agencies submit data on law
enforcement officers killed
or assaulted only when an officer has been killed or assaulted.
The FBI requires law
enforcement agencies to submit hate crime data on a quarterly
basis. The FBI
collects data on the number of sworn officers and law
enforcement personnel
annually. The FBI publishes offense, arrest, clearance, SHR,
and sworn law
enforcement officer data in its annual publication Crime in the
United States. Data
on law enforcement officers killed or assaulted and on hate
crimes are published by
the FBI in two separate publications: Law Enforcement Officers
Killed or Assaulted
and Hate Crime Statistics.
Scoring and Classifying UCR Data. All law enforcement
agencies
participating in the UCR system must classify and score
reported crimes. Classifying
criminal offenses refers to the process of translating offense
titles used in local and
state criminal codes into the standard UCR definitions for Part I
and Part II
offenses.48 Scoring criminal offenses refers to counting the
number of offenses after
CRS-9
49 Ibid.
50 UCR Handbook, p. 7.
51 Ibid.
52 C.J. Mosher et al., The Mismeasure of Crime, p. 63.
53 UCR Handbook, pp. 15, 41.
54 Ibid.
55 The FBI states that the hierarchy rule applies only to crime
reporting and does not affect
the number of charges for which a defendant may be prosecuted
for in court. UCR
Handbook, p. 10.
56 If multiple Part I offenses are committed concurrently with
the arson, the hierarchy rule
would be applied to the additional Part I offenses and only the
most serious offense would
be scored along with the arson. Cynthia Barnett-Ryan,
“Introduction to the Uniform Crime
Reporting Program,” in James P. Lynch and Lynn A. Addington,
eds., Understanding Crime
Statistics: Revisiting the Divergence of the NCVS and UCR
(New York: Cambridge
University Press, 2007), p. 65, hereafter “C. Barnett-Ryan,
‘Introduction to the UCR
Program.’”
57 Ibid.
they have been classified.49 The FBI reminds state and local
law enforcement
agencies that they must classify and score criminal offenses
based on records for calls
for service, complaints, and/or investigations.50 According to
the FBI, UCR data
must reflect offense counts, not the decision of a prosecutor or
the findings of a court,
coroner, or jury.51 Uniformity in the classification and scoring
of criminal offenses
across jurisdictions is essential for maintaining the integrity of
UCR data.52 In
general, reporting law enforcement agencies classify and score
attempted crimes as
though they were completed.53 For example, an attempt to
steal a motor vehicle
would be classified and scored as a motor vehicle theft. The
only exception to this
rule applies to attempted murder, which is classified and scored
as aggravated
assault.54
The FBI has instituted three rules — the hierarchy, hotel, and
separation of time
and place rules — that local law enforcement agencies must
apply when they are
classifying and scoring criminal offenses. The hierarchy rule
states that when
multiple Part I offenses occur in a single criminal incident, only
the most serious
offense is scored and reported to the FBI.55 The hierarchy of
Part I offenses is
provided in Appendix C. For example, if an offender raped and
then murdered a
victim, the reporting law enforcement agency would score only
the murder.
However, there are exceptions to the hierarchy rule. The
hierarchy rule does not
apply to cases of arson, which are always scored and reported to
the FBI, even if
other Part I offenses are committed during the incident.56
Another exception involves
motor vehicle theft. If a motor vehicle is stolen and, by
extension, the contents of the
vehicle constitute a larceny-theft, only the motor vehicle theft is
scored and reported
to the FBI, even though larceny-theft ranks higher on the
hierarchy of Part I
offenses.57 The final exception to the hierarchy rule involves
justifiable homicide.
In cases of justifiable homicide, two offenses are scored and
reported: one for the
CRS-10
58 “Unfounded” crimes are crimes that come to the attention of
law enforcement but are later
found to be false or baseless.
59 Ibid., pp. 65-66.
60 UCR Handbook, p. 62.
61 Ibid.
62 Ibid., p. 12.
63 C. Barnett-Ryan, “Introduction to the UCR Program,” p. 66.
64 UCR Handbook, p. 12.
65 Ibid.
66 Ibid.
67 Ibid, p. 41.
felonious offense connected with the offender and one for the
justifiable homicide,
which is reported as an unfounded58 murder/nonnegilgent
manslaughter.59
The hotel rule applies only to burglary offenses. In cases where
multiple
dwelling units under a single manager are burglarized and the
offenses are more
likely to be reported to the police by the manager rather than
the individual
occupants, the burglaries are scored as one offense.60 The
hotel rule usually applies
to burglaries of hotels, motels, lodging houses, or other places
where the lodging of
transients is the main purpose. The hotel rule would not apply
in instances where
multiple units that were leased or rented to tennants were
burglarized, such as
apartments or offices in a business building.61 For example, if
five hotel rooms were
burglarized, it would be scored as one burglary, but if five
apartments were
burglarized, it would be scored as five burglaries.
The separation of time and place rule applies in instances where
the same
offender commits multiple offenses over a short period of time
in different
locations.62 In such cases, the reporting agency treats the
offenses as separate events
and classifies and scores them accordingly (i.e., applies the
hierarchy and/or hotel
rule).63 According to the FBI, the “same time and place”
means that the time interval
between the offenses and the distance between the locations
where they occurred are
insignificant.64 Normally, the offenses must have occurred
during an unbroken
period of time and at the same or adjoining location(s).65
However, the time and
place rule does not apply in instances where offenses, even if
they are committed at
different times and places, are a part of continuing criminal
activity committed by the
same offender(s), and an investigation deems the activity to
constitute a single
criminal transaction.66
When scoring offenses, the UCR program distinguishes between
crimes against
persons (i.e., homicide/nonnegligent manslaughter, rape, and
aggravated assault) and
crimes against property (i.e., robbery, burglary, larceny-theft,
motor vehicle theft, and
arson).67 For crimes against persons, one offense is counted
for each victim in the
CRS-11
68 Ibid.
69 Ibid.
70 Ibid., p. 96.
71 Ibid., p. 97.
72 Ibid.
73 Ibid.
74 Ibid.
criminal incident.68 For example, if a gunman shot and killed
three people, the
reporting agency would report three homicides. For crimes
against property, one
offense is counted for each distinct operation or attempt in a
criminal incident, with
the exception of motor vehicle theft, in which case one offense
is counted for each
stolen vehicle and one offense for each attempt to steal a motor
vehicle in a criminal
incident.69 For example, if someone walked into a store, pulled
a gun, and robbed
five customers, it would be scored as one robbery. In instances
where multiple Part
I offenses are committed against multiple victims in the same
criminal incident, the
hierarchy rule is applied first, and then crimes are scored based
on whether they were
crimes against persons or crimes against property. For example,
if an assailant
robbed one person and murdered someone who tried to break up
the robbery, only
the murder would be scored, even though two crimes were
committed against two
different people in the same criminal incident.
In addition to classifying and scoring offense data, law
enforcement agencies
must classify and score arrest data. In many ways, arrests are
classified and scored
similar to the way offenses are classified and scored. Arrest
data submitted to the
FBI reflect the number of people arrested, not the number of
charges lodged.70 For
example, if one person is arrested for multiple crimes, the
reporting law enforcement
agency reports one arrest. However, if one person is arrested
multiple times, and
there is a separation of time and space between the arrests, each
arrest is recorded
separately. If a person is arrested for multiple charges, the
reporting agency must use
only one crime classification when reporting the arrest.71
Thus, if a person is arrested
for both Part I and Part II offenses, the reporting agency ignores
the Part II offenses
and scores only the most serious Part I crime (see Appendix C)
for which the person
was arrested. If a person is arrested for Part II offenses, the
reporting agency must
determine which is the most serious offense and score an arrest
only for that
offense.72 If multiple people are arrested for the same crime,
each person is counted
as a separate arrest.73 If a reporting agency determines that
someone in custody has
committed other crimes, the agency does not report additional
arrests; it reports only
the original arrest.74
Development of the NIBRS
The data collected and disseminated by the UCR remained
largely unchanged
over time (i.e., since the beginning of the UCR system in 1929).
Starting in the
1970s, consensus grew in the law enforcement community that
the UCR needed to
be updated to provide more in-depth data to meet the needs of
law enforcement into
CRS-12
75 SEARCH, Cost Issues of Implementing the National-Incident
Based Reporting System in
Local Law Enforcement Agencies, May 1997, hereafter
“SEARCH, ‘Cost Issues of
Implementing NIBRS.’”
76 C. Barnett-Ryan, “Introduction to the UCR Program,” p. 81.
77 U.S. Department of Justice, Federal Bureau of Investigation,
Crime in the United States
2005: About the UCR Program, September 2006, hereafter,
“About the UCR Program
2005.”
78 Ibid.
79 The Blueprint initially proposed that only a small sample of
law enforcement agencies
nationwide (3%-7%) would report comprehensive incident-
based statistics. The remaining
law enforcement agencies would report incident-based data but
in a much more abbreviated
format, focusing only on Part I UCR offenses, with a limited
range of victim, offender, and
incident data. All law enforcement agencies would collect and
submit arrest data, with
linkages to cleared offenses. U.S. Department of Justice, Office
of Justice Programs,
Bureau of Justice Statistics, Implementing the National
Incident-Based Reporting System:
A Project Status Report, NCJ 165581, July 1997, p. 5, hereafter
“BJS, ‘Implementing
NIBRS Status Report.’”
80 Ibid.
81 U.S. Department of Justice, Federal Bureau of Investigation,
National Incident-Based
Reporting System, Volume 1: Data Collection Guidelines,
August 2000, p. 1, hereafter
“NIBRS Data Collection Guidelines.”
82 Ibid.
83 Ibid., p. 2.
the 21st century.75 In response, the FBI, through the Bureau of
Justice Statistics
(BJS), contracted for a phased study of the UCR program, which
culminated with
recommendations on how it could be improved.76 The study’s
final report, Blueprint
for the Future of the Uniform Crime Reporting Program
(Blueprint), was released
in May 1985, and it outlined three areas where the UCR could
be enhanced to meet
the future needs of law enforcement.77 The study
recommended that law enforcement
agencies use an incident-based system to report offenses and
arrests.78 It also
recommended that some law enforcement agencies submit
incident-based data for all
of their known offenses and all arrests (i.e., full participation),
while other law
enforcement agencies submit only a more limited range of
incident-based data for
certain crimes (i.e., limited participation).79 The study also
recommended that the
national UCR program implement a quality assurance
program.80
Based on the recommendation outlined in the Blueprint, the FBI
developed
guidelines and design specifications for what would later
become the National
Incident-Based Reporting System (NIBRS).81 The FBI chose
the South Carolina Law
Enforcement Division (SLED) to conduct a pilot study of the
newly developed
NIBRS guidelines and design specifications.82 SLED adapted
its existing incident-
based UCR system to meet NIBRS specifications, and it enlisted
the assistance of
nine local law enforcement agencies in the state to participate in
the pilot study.83
CRS-13
84 Ibid.
85 Ibid.
86 Ibid.
87 Ibid.
88 About the UCR Program 2005.
89 C. Barnett-Ryan, “Introduction to the UCR Program,” p. 82.
90 An incident is defined for NIBRS reporting purposes as one
or more offenses committed
by the same offender, or group of offenders “acting in concert,”
at the “same time and
place.” “Acting in concert” requires that the offenders actually
commit or assist in the
commission of the crime(s). The offenders must be aware of
and consent to the commission
of the crime(s) or even if nonconsenting, their actions assist in
the commission of the
offense(s). As it is under the UCR system, for the purposes of
NIBRS reporting, “same time
and place” means that the time interval between the offenses
and the distance between
locations where they occurred are insignificant. Normally, the
offenses must have occurred
during an unbroken period of time and at the same or adjoining
location(s). However, the
time and place rule does not apply in instances where offenses,
even if they are committed
at different time and places, are a part of continuing criminal
activity committed by the same
offender(s), and an investigation deems the activity to
constitute a single criminal
transaction. NIBRS Data Collection Guidelines, pp.16-17.
91 Ibid., p. 5.
The pilot study ran from March 1 to September 30, 1987, and it
resulted in further
refinement of NIBRS’s guidelines and specifications.84
The FBI presented the NIBRS to law enforcement at a national
UCR conference
in March 1988.85 The conference gave the FBI the opportunity
to receive feedback
on the NIBRS from the law enforcement community.86
According to the FBI,
conference attendees overwhelmingly supported implementation
of the NIBRS
nationwide.87 Attendees passed three overall
recommendations: (1) that there be
established a new, incident-based national crime reporting
system; (2) that the FBI
manage the program; and (3) that an advisory policy board
composed of law
enforcement executives be formed to help direct and implement
the new program.88
The law enforcement community rejected the Blueprint’s
proposal to have both full
and limited participating law enforcement agencies, and
endorsed implementing the
full version of the NIBRS nationwide.89
The NIBRS Compared with the UCR
NIBRS Data. As discussed above, under the UCR, local law
enforcement
agencies tally the number of known offenses for each Part I
offense, as well as arrest
data for both Part I and Part II offenses, and submit aggregate
counts on a monthly
basis to the FBI. Under the NIBRS, data are not aggregated;
rather, data for each
criminal incident90 are submitted to the FBI in a separate
report.91 For each criminal
incident, participating law enforcement agencies collect data on
53 different data
elements, including data on the offense(s), the offender(s), the
victim(s), the
CRS-14
92 C.J. Mosher et al., The Mismeasure of Crime, p. 70.
93 Michael G. Maxfield, “The National Incident-Based
Reporting System: Research and
Policy Applications,” Journal of Quantitative Criminology, vol.
15, no. 2 (1999), p. 123.
94 SEARCH, “Cost Issues of Implementing NIBRS,” p. 1.
95 Ibid.
96 NIBRS Data Collection Guidelines, p. 5.
97 Ibid., p. 8.
98 C. Barnett-Ryan, “Introduction to the UCR Program,” p. 62.
99 BJS, Implementing NIBRS Status Report, p. 7.
arrestee(s), and any property involved in the offense.92 The
data elements are
combined into six different data segments (see Appendices D
and E). The NIBRS
allows for data on multiple offenses, offenders, and victims to
be collected for each
criminal incident.93
NIBRS data are intended to be a by-product of local incident-
based reporting
(IBR) systems.94 Therefore, local and state law enforcement
agencies can develop
their own IBR systems to suit their local needs, and they can
use the data from their
own IBR systems to participate in the NIBRS, as long as the
data submitted to the
FBI meets NIBRS specifications. State and local law
enforcement agencies can add
additional data elements or data values to their systems.95
The NIBRS does not use the UCR’s Part I and Part II offense
classifications.
Instead, offenses are classified as being either a Group A or
Group B offense (see
Appendix F). Group A contains 46 different offenses grouped
into 22 offense
categories. Group B contains 11 different offenses. Law
enforcement agencies are
required to submit incident reports, which contain data from all
six data segments,
for all Group A offenses.96 For Group B offenses, law
enforcement agencies are
required to submit only arrest reports, which contain data only
from the arrestee data
segment.97 The expanded list of crimes required the FBI to
create definitions for
crimes counted only in the NIBRS and to modify definitions for
crimes that are a part
of the UCR.98 For example, the FBI expanded the definition of
rape to include rapes
of both women and men. Under the UCR, rapes are defined as
being committed
against women only.
NIBRS Certification. Before a state can submit NIBRS data to
the FBI, the
state NIBRS program must be certified by the FBI.99 The FBI
has developed a state
certification policy, which uses the following criteria to
evaluate the NIBRS data
submitted by a state:
! Error rate — before a state can submit NIBRS data, the FBI
requires
that fewer than 4% of the incident reports submitted by the state
contain errors for three consecutive months.
CRS-15
100 Ibid.
101 Ibid.
102 Ibid.
103 NIBRS Data Collection Guidelines, p. 4.
104 Ibid.
105 Ibid.
106 Ibid.
107 Ibid.
! Statistical reasonableness — before a state can submit NIBRS
data,
the FBI evaluates the reasonableness of the data based on
analyses
of trends, volumes, and monthly fluctuations.
! Updating capability and responsiveness — the FBI requires
the state
program to have ample ability to update its records, meet
deadlines,
and respond in a timely manner to error messages from the
national
program.
! System appropriateness — the FBI requires a state’s NIBRS
program to be systematically compatible with the NIBRS data
reporting requirements and guidelines.100
Simply because a state’s IBR program is certified as NIBRS-
compliant does not
necessarily mean that every law enforcement agency in the state
is reporting NIBRS-
compliant data.101 If a state’s program is certified by the FBI,
it means that the state
program is capable of processing NIBRS data at the state level
and submitting
virtually error-free data to the FBI in an acceptable format.102
If a state program is certified as NIBRS-compliant, local law
enforcement
agencies within the state must submit their NIBRS data through
the state program.103
If a state does not have a certified state program, the FBI will
consider allowing local
law enforcement agencies with NIBRS-compliant IBR systems
to submit data
directly to the FBI, if the agency serves a population of over
100,000.104 The FBI
coordinates decisions regarding such requests with the
appropriate state UCR
program. If a local law enforcement agency in a state without a
state UCR program
wants to submit NIBRS data directly to the FBI, it will consider
such a request if the
agency has a NIBRS-compliant IBR system.105 The FBI
reported that the number of
local law enforcement agencies in states without UCR
programs allowed to submit
NIBRS data directly to the FBI is limited by the availability of
resources at the FBI.106
When a local law enforcement agency is allowed to submit
NIBRS data directly to
the FBI, the agency must sign an agreement stating that it will
discontinue direct
reporting to the FBI when the state has a certified program.107
Classifying and Scoring NIBRS Data. Like the UCR program,
law
enforcement agencies participating in the NIBRS have to
classify and score offenses.
However, the NIBRS does not use the hierarchy rule discussed
previously because
CRS-16
108 Ibid., p. 13.
109 Ibid., p. 15.
110 Ibid., pp.16-17.
111 Ibid., p. 14.
112 Ibid.
law enforcement agencies can report all of the offenses that
occurred in a criminal
incident.108
The FBI expanded the definition of the hotel rule under NIBRS
to apply to
rental storage facilities (i.e., mini-storage and self-storage
buildings).109 For example,
10 storage units burglarized in one self-storage building would
be counted as one
burglary offense. However, NIBRS data reporting allows law
enforcement agencies
to report how many premises were entered (see Appendix D,
data element 10 under
the Offense segment). Using the same example, the break-ins at
the storage facility
would be reported as one burglary, even though the law
enforcement agency would
include data in the incident report indicating that 10 premises
were entered.
The separation of time and place rule still applies when
classifying and scoring
offenses under the NIBRS.110 Law enforcement agencies have
to use the separation
of time and place rule to determine whether a group of offenses
should be reported
as individual incidents, or whether the offenses should be
reported as one incident
where multiple offenses occurred.
Like the UCR program, the NIBRS also distinguishes between
crimes against
persons and crimes against property. Crimes against persons
and crimes against
property are scored the same way for NIBRS reporting as they
are for UCR reporting.
However, because NIBRS Group A offenses include offenses
that cannot be
classified as crimes against persons (because they do not
involve an actual victim)
or classified as crimes against property (because property is not
the object of the
crime), the NIBRS includes another scoring category — crimes
against society.111
For NIBRS reporting, crimes against society include
drug/narcotics offenses,
gambling offenses, pornography/obscene materials, and
prostitution offenses (see
Appendix F). Reporting law enforcement agencies score one
offense for each crime
against society in an incident.112
Advantages of the NIBRS. Because of the expanded amount of
data
collected in NIBRS reporting, the NIBRS has several
advantages compared with the
traditional UCR system. In addition to those described above,
advantages of the
NIBRS include the following:
! Data collection is not restricted to a limited number of offense
categories (i.e., Part I offenses).
! Offense definitions can meet state, local, and national
reporting
needs.
CRS-17
113 Justice Research and Statistics Association, IBR Resource
Center, Advantages of
Incident-Based Reporting Over Summary Reporting. Document
on file with author,
available upon request.
114 Justice Research and Statistics Association, IBR Resource
Center, Status of NIBRS in the
States, document on file with author, available upon request.
! Details on individual crime incidents (offenses, offenders,
victims,
property, and arrests) can be collected and analyzed.
! Arrests and clearances can be linked to specific incidents and
offenses.
! Distinctions can be made between attempted and completed
crimes.
! Linkages can be established between variables for examining
interrelationships between offenses, offenders, victims,
property, and
arrestees.
! Detailed crime analyses can be made within and across law
enforcement jurisdictions.
! Strategic and tactical crime analyses can be made at the local
and
regional levels.113
Transition to the NIBRS
According to the Justice Research and Statistics Association’s
IBR Resource
Center, approximately 22% of the nation’s population is
covered by law enforcement
agencies that report NIBRS-compliant data and 17% of reported
crime is reported
through the NIBRS program.114 As of August 2007, and as
shown in Appendix A,
31 states had been certified by the FBI to submit NIBRS data.
In addition, the FBI
accepts NIBRS data directly from agencies in Alabama, Illinois,
Kentucky, and the
District of Columbia, even though each state does not have an
FBI-certified NIBRS
program. In 11 states (35% of all certified states), all law
enforcement agencies in
the state collect and submit NIBRS-compliant data. In another
10 states (32% of all
certified states), between 50%-99% of law enforcement agencies
in the state collect
and submit NIBRS-compliant data.
Limitations of UCR and NIBRS Data
Limited Offense Data. As discussed above, the UCR collects
offense data
on a limited number of crimes (Part I crimes), which means that
offense data are
available only for a small number of all crimes committed in the
United States.
Offense data are not available for Part II crimes, which tend to
be committed at a
greater frequency than Part I crimes. Currently, the UCR does
not collect data on
crimes commonly covered by the media, such as kidnapping,
bribery, or child
pornography. The FBI is trying to address this gap by
implementing the NIBRS, but
as discussed above, many jurisdictions have yet to make the
switch from the UCR to
CRS-18
115 C.J. Mosher et al., The Mismeasure of Crime, p. 86.
116 Ibid.
117 2005 NCVS data showed that 57.4% of all crimes, 51.3% of
personal crimes, 50.7% of
crimes of violence, and 59.3% of property crimes were not
reported to police. U.S.
Department of Justice, Office of Justice Programs, Bureau of
Justice Statistics, Criminal
Victimization in the United States, 2005 Statistical Tables,
National Crime Victimization
Survey, Table 91, NCJ 215244, December 2006, p. 107.
118 C.J. Mosher et al., The Mismeasure of Crime, p. 84.
119 David Seidman and Michael Couzens, “Getting the Crime
Rate Down: Political Pressures
and Crime Reporting,” Law and Society Review, vol. 8 (1973-
1974), p. 457; Larry J. Siegel,
Criminology (9th ed.) (Belmont, CA: Thompson and
Wadsworth, 2006), p. 35, hereafter,
“L.J. Seigel, Criminology”; C.J. Mosher et al., The Mismeasure
of Crime, pp. 91-93.
120 L.J. Siegel, Criminology, p. 35.
121 Ibid.
the NIBRS. Neither the UCR nor the NIBRS collect data on
political crimes, price-
fixing and illegal environmental pollution.115 Moreover, the
UCR and the NIBRS
most likely undercount corporate and occupational crimes.116
Unreported Crimes. As discussed above, both the UCR and the
NIBRS
collect data on the number of offenses known to law
enforcement each year.
However, not all crimes that occur are known to the police. In
some cases, the
victim(s) of or witness(es) to a crime might not report the
incident to the police.117
Researchers have reported that a majority of crimes become
known to the police only
after they are reported by either the victims or citizens who
witnessed the crime.118
If crimes are not reported to law enforcement, both the UCR and
NIBRS will
undercount the actual amount of crime that occurred.
Reporting Practices of Law Enforcement. Evidence shows that
UCR
data may be affected by the reporting practices of local law
enforcement. In some
instances, law enforcement officials, usually because of
political pressure to lower
the crime rates, might manipulate crime reports to decrease the
amount of reported
crime.119 In other instances, the number of reported offenses
might be a product of
how assiduously local law enforcement follow the FBI’s
definitions for crimes under
the UCR or the NIBRS.120 For example, if a local law
enforcement agency does not
closely follow UCR or NIBRS definitions, the agency might
classify an assault
against a woman as an attempted rape, or a trespass as a
burglary. Ironically, the
number of reported offenses might increase as local law
enforcement agencies
become more efficient.121 If a law enforcement agency puts
more officers on patrol,
the number of known offenses might increase because there are
more officers to
catch offenders. If law enforcement agencies work to develop a
better relationship
with the citizens they serve, the reported number of offenses
could increase because
citizens might report more crimes. The number of reported
offenses might also
increase as law enforcement agencies develop better record-
keeping systems and as
CRS-19
122 Ibid.
123 C.J. Mosher et al., The Mismeasure of Crime, p. 88.
124 C. Barnett-Ryan, “Introduction to the UCR Program,” p. 69.
125 Ibid.
126 Ibid.
127 Michael D. Maltz, Analysis of Missingness in UCR Crime
Data, U.S. Department of
Justice, Office of Justice Programs, August 2006, p. 11.
128 Ibid., p. 12.
129 The FBI converts all NIBRS data into summary UCR data
for publication in Crime in the
United States. If a law enforcement agency reports NIBRS data
and does not report any data
for the year, or if it reports data only for part of the year, the
FBI converts the reported data,
if any, to summary UCR data. The FBI then applies the
imputation procedures used for
summary UCR data to estimate the agency’s crime rate for the
full year.
they assign more employees to do dispatching, record keeping,
and criminal incident
reporting.122
Missing Data. Federal law does not require local law
enforcement agencies
to submit offense data to the UCR program. Although
participation in the UCR
program has been above 90% since the 1970s, not all law
enforcement agencies in
the country submit UCR data to the FBI.123 Also, law
enforcement agencies are not
required to submit a full year of UCR data to the FBI.124 In
some instances, a local
law enforcement agency will submit only a few months’ worth
of data, or will fall
shy of the full 12 months by 1 or 2 months.125 In other
instances, a local law
enforcement agency will submit offense data but will not submit
any of the other data
(e.g., the supplementary homicide report data or the hate crime
data; see discussion
above).126
One researcher found that missing data are not equally
distributed among all law
enforcement agencies in the country. The researcher reported
that, for the years
1960-2003, law enforcement agencies serving populations under
2,500 people and
university and college law enforcement agencies are more likely
to have missing data
than law enforcement agencies that serve populations over
2,500 people.127 In
general, the larger the population the law enforcement agency
served, the less likely
the agency was to have missing data. The analysis showed that
law enforcement
agencies that served 250,000 or more people did not have
missing data for the years
1960-2003.128
Imputation Procedures. If a law enforcement agency does not
report UCR
data to the FBI for the entire year, the FBI uses imputation
techniques to estimate the
law enforcement agency’s number of reported crimes for the
entire year.129 The
methodology differs depending on the number of months for
which crime data were
reported. If the law enforcement agency has submitted three or
more months of data,
the FBI estimates the total annual number of crimes for the
jurisdiction by
multiplying the reported number of crimes by a weight equal to
“12/N,” where “N”
CRS-20
130 M.D. Maltz, Bridging Gaps in Police Crime Data, p. 23; C.
Barnett-Ryan, “Introduction
to the UCR Program,” p. 70.
131 MSA is a designated area consisting of a principal city of at
least 50,000 people and the
surrounding counties that have strong economic ties.
132 The FBI classifies each law enforcement agency into one of
eight population groups. The
population groups are as follows: I (250,000 inhabitants or
more); II (100,000-249,999
inhabitants); III (50,000-99,999 inhabitants); IV (25,000-49,999
inhabitants); V (10,000-
24,999 inhabitants); VI (less than 10,000 inhabitants; includes
universities and colleges to
which no population is attributed); VIII (Nonmetropolitan
county; includes state police to
which no population is attributed); and IX (Metropolitan
county; includes state police to
which no population is attributed). About CUIS 2005.
133 The FBI attempts to collect data from core cities for the full
year in order to avoid
estimating crime data for the city. C. Barnett-Ryan,
“Introduction to the UCR Program,” p.
70.
134 Ibid.
135 Geographic divisions are as follows: Pacific (AK, HI, WA,
OR, and CA); Mountain (MT,
UT, ID, AZ, NM, NV, WY, and CO); West North Central (ND,
SD, MN, NE, KS, IA, and
MO); West South Central (OK, TX, AR, and LA); East North
Central (WI, MI, IL, IN, and
OH); East South Central (KY, TN, AL, and MS); South Atlantic
(DE, MD, WV, VA, NC,
SC, GA, and FL); Middle Atlantic (NY, PA, and NJ); and New
England (CT, RI, MA, VT,
NH, and ME). About CUIS 2005.
136 The geographic regions are as follows: West (AK, HI, WA,
OR, CA, MT, UT, ID, AZ,
NM, NV, WY, and CO); South (OK, TX, AR, LA, KY, TN, AL,
MS, DE, MD, WV, VA,
NC, SC, GA, and FL); Midwest (ND, SD, MN, NE, KS, IA, MO,
WI, MI, IL, IN, and OH);
and Northeast (NY, PA, NJ, CT, RI, MA, VT, NH, and ME).
About CUIS 2005.
137 C. Barnett-Ryan, “Introduction to the UCR Program,” p. 71.
equals the number of months of data submitted by the law
enforcement agency.130
For law enforcement agencies that have submitted less than
three months of data
(“non-reporting agencies”), the missing data are estimated
based on the reported
number of crimes from other similar agencies based on
population. For core cities
in a Metropolitan Statistical Area (MSA),131 the crime rate is
estimated by applying
the crime rate for all other law enforcement agencies in the
agency’s population
group132 to the agency’s population.133 For example, if a law
enforcement agency
served a city of 80,000 people and the murder rate for all other
MSA core cities in
its population group was 10 per 100,000, then the estimated
number of murders for
the city would be 8 (calculated as 80,000x10.0/100,000). The
crime rates for the
remaining agencies are estimated using the state rate for the
agency’s population
group from the current year.134 In absence of a state rate, the
FBI will apply the
division135 or region136 rate. Agency-level estimates are
always aggregated into larger
geographic areas, such as MSAs, state, geographic division,
region, and the nation.137
Researchers have stated that the imputation methods used by the
FBI to estimate
crime in jurisdictions that have not reported for the full year or
non-reporting
jurisdictions make questionable assumptions. The imputation
method used by the
FBI to estimate a full year’s worth of data for jurisdictions that
report three or more
months of data implicitly assumes that the crime rate for non-
reported months is the
CRS-21
138 C.J. Mosher et al., The Mismeasure of Crime, p. 89.
139 Ibid., p. 90.
140 U.S. Department of Justice, The Nation’s Two Crime
Measures, NCJ 122705, October
2004, p. 1, hereafter “U.S. DOJ, The Nation’s Two Crime
Measures.”
141 National Archive of Criminal Justice Data, National Crime
Victimization Survey
Resource Guide. Document on file with author, available upon
request.
142 Callie Marie Rennison and Michael Rand, “Introduction to
the National Crime
Victimization Survey,” in James P. Lynch and Lynn A.
Addington, eds., Understanding
Crime Statistics: Revisiting the Divergence of the NCVS and
UCR (New York: Cambridge
University Press, 2007), p. 19, hereafter “C.M. Rennison and M.
Rand, ‘Introduction to the
NCVS.’”
143 Ibid., p. 18.
144 Ibid.
145 The Commission found four limitations associated with
UCR data that prevented it from
addressing the needs of the Commission. The Commission
found that UCR data
(continued...)
same as for reported months.138 If the crime rates in the
months for which data were
not reported differ from the rates in the months for which data
were reported, then
the imputation procedure could either overestimate or
underestimate the
jurisdiction’s annual crime rate. The imputation procedure used
to estimate the crime
rate for non-reporting jurisdictions assumes that cities and
towns with similar sized
populations are also similar in other factors that might affect
the city or town’s crime
rate, such as income distribution, unemployment rates,
population density, and racial
composition.139
National Crime Victimization Survey
The National Crime Victimization Survey (NCVS) is the
primary source for
information on the characteristics of criminal victimization and
on the number and
types of crime not reported to law enforcement.140 The NCVS
has four major
objectives: (1) developing detailed information about the
victims and consequences
of crime, (2) estimating the number and types of crimes not
reported to police, (3)
providing uniform measures of selected types of crimes, and (4)
permitting
comparisons over time and population types (e.g., urban,
suburban, and rural).141
NCVS’s History
The NCVS began as a way to supplement UCR data.142 In
1965, President
Lyndon Johnson convened the President’s Commission on Law
Enforcement and the
Administration of Justice (hereafter referred to as “the
Commission”).143 The
Commission was charged with examining the causes and
characteristics of crime in
the United States and formulating recommendations for polices
and programs that
could address crime in the country.144 At the time, the UCR
was the only source for
official crime data, and the Commission found that several
limitations145 associated
CRS-22
145 (...continued)
! reflected only crimes known to law enforcement;
! reflected law enforcement activity and not necessarily actual
crime trends;
! were open to possible manipulation and misrepresentation that
could
threaten their validity; and
! lacked important information about the criminal incident,
including details
about the characteristics of offenders, offenses, and victims.
(Ibid., pp.
18-19.)
146 Ibid.
147 Ibid., p. 19.
148 C.J. Mosher et al., The Mismeasure of Crime, p. 54.
149 Ibid.
150 Ibid.
151 Ibid., pp. 54-55.
152 Ibid., p. 55.
153 Ibid.
154 Ibid.
with the data prevented it from helping the Commission develop
policy
recommendations.146 To help rectify some of the limitations
associated with UCR
data, the Commission recommended the creation of a national
survey of crime
victimization.147
The first crime victimization survey pilot study was conducted
in three
Washington, D.C., police precincts in the spring of 1966.148
The survey asked 511
Washington, D.C., residents, chosen from a probability sample
of homes, whether
they had been a victim of one or more of a list of crimes.149
The Washington, D.C.,
pilot study demonstrated that household surveys could provide a
different picture of
crime than the one derived from UCR data. The study showed
that, depending on the
type of crime, there were 3 to 10 times as many criminal
incidents reported by
victims than there were recorded in UCR data.150
A supplementary study was conducted in three cities: Boston,
Chicago, and
Washington, D.C. The second study surveyed businesses and
organizations in
selected high-crime areas of all three cities about criminal
victimizations they had
experienced.151 The supplementary study also surveyed
residents of Chicago and
Boston about their household’s criminal victimizations.152
Like the Washington,
D.C., pilot study, the supplementary study found that the
number of reported
victimizations exceeded the number of reported crimes.153
A third victimization survey sponsored by the Commission was
conducted by
the National Opinion Research Center (NORC).154 NORC’s
victimization survey
differed from the two previous surveys in that it involved a
national sample, not just
a sample of local households and businesses. NORC’s
victimization survey
CRS-23
155 Ibid.
156 Ibid.
157 Ibid.
158 Ibid.
159 David Cantor and James P. Lynch, “Self-Report Surveys as
Measures of Crime and
Criminal Victimization,” in U.S. Department of Justice, Office
of Justice Programs,
National Institute of Justice, Criminal Justice 2000, Volume 4,
NCJ 182411, July 2000, p.
105, hereafter “D. Cantor and J.P. Lynch, ‘Self-Report Surveys
as Measures of Crime and
Criminal Victimization.’”
160 C.M. Rennison and M. Rand, “Introduction to the NCVS,”
p. 20.
161 Ibid.
162 The LEAA was the predecessor to the Office of Justice
Programs.
163 C.M. Rennison and M. Rand, “Introduction to the NCVS,”
p. 20.
164 D. Cantor and J.P. Lynch, “Self-Report Surveys as
Measures of Crime and Criminal
Victimization,” p. 105.
165 Ibid.
interviewed one person in each of 10,000 households
nationwide.155 Like the two
previous pilot studies, NORC’s survey found that more crime
was being committed
than was being reported to law enforcement.156 Unlike the
other two studies,
NORC’s survey collected data on which crimes were not
reported to the police and
on the respondent’s reason for not reporting the crime. Non-
reporting was found to
vary by offense. For example, the study found that 90% of
consumer frauds were not
reported, but 11% of motor vehicle thefts were unreported.157
NORC found that most
people who chose not to report a crime to the police did so
because they either
thought the incident was a private matter or did not think the
police could do
anything about it.158
The three pilot studies indicated that UCR data underestimated
the true level of
crime in the United States. Moreover, the studies showed that a
household survey
could help estimate the extent of unreported crime, also known
as the “dark figure
of crime.”159 They also demonstrated that a household survey
was a reasonable
method for estimating the number of criminal victimizations in
the United States.160
The Commission recommended that a national criminal justice
statistics center be
established to collect victimization data on an ongoing
basis.161 In 1968, the Law
Enforcement Assistance Administration (LEAA)162 was created
and charged with
implementing a national victimization survey.163
In the early 1970s, LEAA, in cooperation with the Census
Bureau, worked to
develop a national victimization survey, which would come to
be known as the
National Crime Survey (NCS). The pilot studies for the NCS
demonstrated that a
large national sample of households would be required to obtain
an accurate estimate
of some crimes.164 The Census Bureau was chosen to conduct
the NCS because it
was the only organization that had the capacity to field such a
large survey.165 During
the development of the NCS, the survey’s methodology was
refined based on some
CRS-24
166 Ibid.
167 Record-check experiments involve comparing police
records to reported victimizations
to determine whether crimes are being reported and, if so, how
frequently they are being
reported.
168 Ibid.
169 C.M. Rennison and M. Rand, “Introduction to the NCVS,”
pp. 20-21.
170 D. Cantor and J.P. Lynch, “Self-Report Surveys as
Measures of Crime and Criminal
Victimization,” p. 106.
171 Ibid.
172 Ibid.
173 U.S. Department of Commerce, Bureau of the Census,
National Crime Victimization
Survey: Interviewing Manual for Field Representatives,
February 2003, p. A1-5, hereafter
“Census Bureau, NCVS Interviewing Manual.”
174 Data collected from a nationwide sample of households in
central cities were designed
to estimate the level and change of victimization for a selected
set of crime committed
against residents of major cities in the United States. The
surveys were designed to obtain
benchmark estimates of crime in cities, which could then be
updated in subsequent
enumerations for each city. For example, in 1972 and 1975,
approximately 12,000
households in eight different cities (Atlanta, Baltimore,
Cleveland, Dallas, Denver, Newark
(continued...)
of the lessons learned from the three pilot studies.166 There
were a series of pretests,
trial surveys, and record-check experiments167 to help address
some of the
methodological issues associated with implementing a
nationwide victimization
survey.168 Some of the issues examined included
! the use of a single household respondent, as opposed to
interviewing
everyone in the household;
! the respondent’s ability to recall events;
! the length of the reference period;
! the minimum age of the respondent; and
! the appropriate question cues and wording.169
As a result of the studies, the NCS chose to interview all
members of the
household about victimizations they experienced.170 It was
decided that the NCS
would use a six-month reference period.171 It was also decided
that only one person
(referred to as a “household respondent”) would answer
questions about crimes
against household property.172
The first NCS was conducted in July 1972 by the Census
Bureau.173 The NCS
was originally composed of four interrelated surveys: a national
sample of
households, referred to as the “Crime Panel”; a sample of
households from central
cities;174 and a national and central city sample of commercial
establishments.175 As
CRS-25
174 (...continued)
[NJ], Portland [OR], and St. Louis) were surveyed. The central
city household survey was
also fielded in the five largest cities in 1973 and 1975. An
additional 13 cities received the
survey once in 1974. C.M. Rennison and M. Rand,
“Introduction to the NCVS,” p. 21.
175 The national survey of commercial establishments was
conducted once in 1972. The
survey of commercial establishments was conducted
concurrently with the central city
household survey. Both surveys collected data on robbery and
burglary victimizations of
commercial establishments. Ibid.
176 D. Cantor and J.P. Lynch, “Self-Report Surveys as
Measures of Crime and Criminal
Victimization,” p. 108.
177 C.M. Rennison and M. Rand, “Introduction to the NCVS,”
p. 33.
178 Charles Kindermann, James Lynch, and David Cantor,
Effects of the Redesign on
Victimization Estimates, NCJ 164381, April 1997, U.S.
Department of Justice, Office of
Justice Programs, Bureau of Justice Statistics, p. 1, hereafter,
“C. Kindermann et al., Effects
of the Redesign on Victimization Estimates.”
179 U.S. Department of Justice, Office of Justice Programs,
Bureau of Justice Statistics,
National Crime Victimization Survey: Questions and Answers
about the Redesign, NCJ
151171, October 1994, p. 4, hereafter “BJS, Questions and
Answers about the Redesign.”
of 1976, data were no longer collected for the sample of
households from central
cities, nor were data collected for the national and central city
sample of commercial
establishments. Since 1976, the NCS consisted only of the
national sample of
households (i.e., the Crime Panel).
In the mid-1970s, in response to concerns about the quality and
usefulness of
NCS data, the LEAA asked the National Academy of Sciences
(NAS) to evaluate the
NCS.176 In 1976, the NAS published a report that provided
recommendations for
how to improve the NCS.177 The NAS found that although the
NCS was an effective
instrument for measuring crime, certain aspects of the survey’s
methodology and
scope could be improved.178 The NAS recommended that
researchers investigate the
following:
! Enhanced screening questions that would better stimulate
respondents’ recall of victimizations, thus reducing
underreporting
resulting from forgotten incidents.
! Screening questions that would sharpen the concepts of
criminal
victimization and diminish the effects of subjective
interpretations
of the survey questions.
! Additional questions on the nature and consequences of
victimizations that would yield useful data for analysis.
! Enhanced questions and inquiries about domestic violence,
rape, and
sexual attack to get better estimates of these victimizations.179
The Bureau of Justice Statistics (BJS) sponsored a research
consortium that
investigated the issues raised in the NAS review and provided
recommendations that
CRS-26
180 Ibid.
181 David Cantor and James P. Lynch, “Exploring the Effects
of Changes in Design on the
Analytical Uses of the NCVS Data,” Journal of Quantitative
Criminology, vol. 21, no. 3
(2005), p. 295.
182 BJS, Questions and Answers about the Redesign, p. 4.
183 Ibid.
184 Census Bureau, NCVS Interviewing Manual, p. A1-6.
185 Ibid.
186 Ibid.
187 Ibid.
would improve the accuracy and utility of the NCS.180 In
1986, the consortium
proposed new instrumentation and procedures to improve the
NCS.181
BJS chose to implement the consortium’s proposals and
redesign the NCS. BJS
stated that the overall objectives for redesigning the NCS were
to increase reporting
of crime victimization and provide additional details on
individual crime incidents.182
BJS also had more specific objectives for the redesign,
including
! developing improved screening questions, thereby stimulating
recall
of incidents;
! sharpening concepts of victimization for survey respondents
by
providing a more thorough description of criminal incidents,
thus
diminishing effects of cognitive and subcultural differences
among
respondents;
! improving data collection techniques by adopting Computer-
Assisted Telephone Interviewing (CATI) for some segments of
survey participants;
! improving measures of rape and sexual attack by asking
respondents
directly about these crimes; and
! providing better measures of domestic violence.183
The recommended changes were phased in as part of a two stage
process: near-
term and long-term.184 The near-term changes focused on the
NCS’s procedures and
questionnaires, but they were not substantial enough to affect
the comparability of
the crime rates for previous years (i.e., they were non-rate
affecting changes).185 The
near-term changes were implemented by the Census Bureau in
July 1986.186 Long-
term changes had a substantial impact on the crime rate reported
by the NCS.187 The
long-term changes to the NCS’s design were phased in
gradually. Starting in 1989,
BJS and the Census Bureau pre-tested the long-term changes
using 5% and 10%
CRS-27
188 C.M. Rennison and M. Rand, “Introduction to the NCVS,”
p. 37.
189 Ibid.
190 Census Bureau, NCVS Interviewing Manual, pp. A1-6 to
A1-7.
191 C. Kindermann et al., Effects of the Redesign on
Victimization Estimates, p. 2.
192 Ibid.
193 Ibid.
194 BJS reported that the NCVS accomplished its overall
objective of producing higher
estimates of crime rates than the NCS. In general, the
implementation of the NCVS had the
effect of increasing the number of crimes counted by the survey.
BJS found that the NCVS
produced higher estimates of violent crime rates regardless of
the context (i.e., victimized
by a stranger vs. a non-stranger, crime was completed vs.
attempted, victimization was
reported to the police vs. not reported). However, the NCVS
had a larger impact on the
estimates of non-stranger and attempted crimes and crimes
reported to the police than on
stranger, completed and non-reported crime. For household
crimes, the NCVS produced
higher estimates of rates for completed crimes and for crimes
either reported or unreported
to the police. However, the magnitude of the effect on
household crimes is less than the
magnitude of the effect on violent crimes. Ibid., pp.2-3.
subsamples of the NCS sample.188 After extensive pre-testing,
the long-term changes
were fully implemented by BJS in 1992.189 Between 1986 and
1992, the following
changes were made to the survey:
! Better “short cue” screening questions were added to stimulate
respondent recall of victimization incidents.
! More thorough descriptions of crime incidents were added in
an
effort to help all respondents interpret NCS concepts correctly.
! CATI was introduced to improve data collection.
! Specific questions about rape and sexual assaults were added
to
improve measurement of these crimes.
! Screening questions were reworded and added to get a better
measure of domestic violence.190
After the implementation of the redesigned NCS, BJS changed
the name of the
NCS to the National Crime Victimization Survey (NCVS).
From January 1992
through June 1993, the full NCS-NCVS sample was divided into
two parts.191 One
half of the sample was administered the NCS, and the other half
was administered
the NCVS.192 BJS chose to give each half of the sample either
the NCS or the NCVS
to permit the continuous publication of estimates of the year-to-
year change in crime
rates with comparable data while the NCVS was being
introduced.193 The procedure
was also intended to provide data on how the reported rate of
victimization might
have changed from the NCS to the NCVS.194
Periodically, BJS has expanded the scope of the NCVS to
address new issues
in crime. In 1998, Congress required BJS to add questions to
the NCVS to identify
CRS-28
195 See the Crime Victims with Disabilities Awareness Act
(P.L. 105-301). C.M. Rennison
and M. Rand, “Introduction to the NCVS,” p. 46.
196 Ibid.
197 Ibid.
198 Ibid.
199 BJS, Questions and Answers about the Redesign, p. 2.
200 Ibid.
crime victims with developmental disabilities.195 In 1999, BJS
added questions to the
NCVS to determine the extent to which respondents who were
victims of crime
perceived the crimes to be hate crimes.196 In 2001, BJS added
questions to the NCVS
to explore the extent to which people were victimized by
computer-related crimes.197
In 2004, the computer crimes questions were replaced by
questions about identity
theft.198
How NCVS Data Are Collected
NCVS Data. The Census Bureau conducts the NCVS for
BJS.199 As shown
in Appendix I, in 2005, data were collected from 67,000 people
in 38,600
households. The survey asks respondents whether they have
been the victim of
! rape and sexual assault,
! robbery,
! simple and aggravated assault,
! purse snatching/pickpocketing,
! burglary,
! theft, or
! motor vehicle theft.200
In addition to estimating the number of annual victimizations,
the NCVS also
gathers data on the details of each victimization incident. To do
this, the survey
collects data on
! the month, time, and location of the crime;
! the relationship between the victim and the offender;
! characteristics of the offender;
! self-protective actions taken by the victim during the incident
and
results of those actions;
! consequences of the victimization, including any injury or
property
loss;
! whether the crime was reported to the police and the reason
for
reporting or not reporting; and
CRS-29
201 Ibid.
202 C.J. Mosher et al., The Mismeasure of Crime, p. 138.
203 Ibid.
204 Ibid.; C.M. Rennison and M. Rand, “Introduction to the
NCVS,” p. 24.
205 C.J. Mosher et al., The Mismeasure of Crime, p. 138.
206 Census Bureau, NCVS Interviewing Manual, p. A1-9.
207 C.M. Rennison and M. Rand, “Introduction to the NCVS,”
p. 24.
208 Census Bureau, NCVS Interviewing Manual, p. A1-10.
209 C.J. Mosher et al., The Mismeasure of Crime, p. 138.
210 Ibid.
211 Ibid.
! offender use of weapons, drugs, and alcohol.201
NCVS Methodology. The NCVS sample is selected using a
stratified,
multistage cluster sample.202 The sampling process starts by
identifying
approximately 2,000 primary sampling units (PSUs) that are
composed of standard
metropolitan statistical areas, a county, or a small group of
contiguous counties.203
PSUs are stratified with respect to important demographic
characteristics, such as
geographic region, population density, population growth rate,
and proportion of
nonwhite population.204 A sample of households is chosen
from each stratum in a
manner that is proportionate to their representation in the larger
population.205 When
a household is selected for the sample, all eligible people in the
household are
interviewed. Non-institutionalized persons aged 12 and older
living in the United
States are eligible to be interviewed for the NCVS.206 When a
household is selected
for the NCVS sample, eligible members of the household are
interviewed once every
six months for three years, for a total of seven interviews.
After three years, the
household is rotated out of the sample and a new one is brought
in. The rotational
panel design of the NCVS is accomplished by dividing all
sampled households into
six rotational groups, with each group containing six panels of
households.207 Each
month, one panel from each group is interviewed, so that in any
given month, one-
sixth of the sample is being interviewed for the first time, one-
sixth is being
interviewed for the second time, and so forth.208
The survey instrument used in the NCVS consists of three parts:
the “control
card,” a basic “screen” questionnaire, and crime incident
reports. The control card
contains basic administrative information for the sampled
household, including the
house’s address and basic household data, such as the
household’s income, whether
the house is owned or rented, and the names, age, race, sex,
marital status, and
education of all individuals living in the household.209 The
control card also contains
a record of visits, telephone calls, interviews, and information
about non-
interviews.210 Information on the control card is provided by a
“knowledgeable
adult” in the household.211 The “knowledgeable adult” is
interviewed about
CRS-30
212 Ibid.
213 Ibid.
214 BJS, Questions and Answers about the Redesign, p. 3.
215 Ibid.
216 C.J. Mosher et al., The Mismeasure of Crime, p. 139.
217 Janet L. Lauritsen, “Social and Scientific Influences on the
Measurement of Criminal
Victimization,” Journal of Quantitative Criminology, vol. 21,
no. 3 (2005), p. 247, hereafter
“J. Lauritsen, ‘Social and Scientific Influences on the
Measurement of Criminal
(continued...)
victimizations against the household (i.e., burglaries, motor
vehicle thefts, and
household larcenies).212
The screen questionnaire is designed to elicit information about
whether the
household or a particular respondent has experienced certain
types of
victimizations.213 The screen questionnaire provides
respondents with a series of
detailed questions and cues about victimizations and situations
in which crimes may
take place.214 Questions on the screen questionnaire describe
crimes in plain
language, avoiding technical legal terms. To elicit an accurate
response, respondents
are provided with detailed features that may characterize a
criminal incident.215 If a
screening question elicits a positive response, more information
about the incident
is collected on an incident report.
For each separate victimization incident mentioned on the
screening
questionnaire, the respondent is asked to complete an incident
report. Incident
reports include a series of questions about the particular crime
event, the offending
parties, and the consequences of the crime. Some of the
questions on incident reports
include the following:
! Was the crime reported to the police?
! Was the offense completed or just attempted?
! Did the victim know the offender, or was the offender
identified?
! If known, what were the demographic characteristics (i.e.,
race,
gender, age) of the offender?
! Was a weapon used in the crime?
! Did the victim resist?
! Was there any monetary loss or physical injury, or both, that
resulted
from the victimization?216
The first interview is conducted in person, and all subsequent
interviews, unless
requested by the respondent, are conducted by telephone.217
Data collected during
CRS-31
217 (...continued)
Victimization.’”
218 Ibid.
219 C.M. Rennison and M. Rand, “Introduction to the NCVS,”
p. 29.
220 Ibid.
221 Ibid.
222 Ibid.
223 Ibid.
224 Ibid., p. 43.
225 Ibid., p. 28.
226 Ibid., p. 48.
227 BJS, Questions and Answers about the Redesign, p. 6.
first interviews are used for bounding purposes and are
excluded when calculating
the crime rate.218 In the context of the NCVS, “bounding”
refers to a process
whereby the prior interview and the data collected during it are
used in subsequent
interviews to ensure that victimizations before the reference
period and
victimizations reported in prior interviews are not counted
twice.219 Bounding
procedures can help reduce the effects of “telescoping,” which
refers to the tendency
of people to incorrectly identify the timing of past events.220
For example, if a
respondent is asked whether he or she has been the victim of a
crime in the past six
months, the respondent might report a victimization that
actually occurred seven
months ago. The bounding procedure provides respondents with
both a cognitive
and mechanical bound.221 The prior interview can serve as an
event that respondents
can use to help determine whether a victimization occurred
within the current
reference period.222 Furthermore, if the interviewer finds that a
reported victimization
is similar to one reported previously, the interviewer can
question the respondent
further to ensure that the reported victimization did indeed
occur in the current
reference period.223 Data collected during bounding interviews
are not used by BJS
to calculate annual victimization rates.
A growing number of interviews for the NCVS are being
conducted via
Computer-Assisted Telephone Interviewing (CATI). Currently,
about 30% of all
NCVS interviews are conducted by using CATI.224 As
discussed above, the first
interview is conducted face-to-face, and subsequent interviews
are conducted by
phone. Face-to-face and non-CATI telephone interviews are
conducted using Paper
and Pencil Interviewing (PAPI); that is, the respondent’s
answers are recorded on
printed instruments.225 The survey has evolved from one in
which all interviews were
done face-to-face to one in which most interviews are conducted
over the telephone,
with a growing number of phone interviews employing
CATI.226 With CATI,
interviews are conducted from a centralized telephone facility
where they read
questions from a computer screen and record answers directly
into a computer.227
The computer provides the interviewer with the next appropriate
question based on
the last answer; it also allows for automated internal
consistency checks and reduces
CRS-32
228 Ibid.
229 Ibid.
230 Michael R. Rand, The National Crime Victimization
Survey: 32 Years of Measuring
Crime in the United States, paper prepared for the Siena Group
on Social Statistics meeting
in Helsinki, Finland, February 2005, p. 9, hereafter “M.R. Rand,
The National Crime
Victimization Survey: 32 Years of Measuring Crime in the
United States.”
231 Ibid.
232 Ibid.
233 Ibid.
234 Ibid.
235 Ibid.
236 J. Lauritsen, “Social and Scientific Influences on the
Measurement of Criminal
Victimization,” p. 247.
237 BJS, Questions and Answers about the Redesign, p. 3.
transcription errors.228 CATI improves data quality because all
interviewers are in
a centralized facility, allowing them to be monitored for
adherence to standardized
interviewing techniques.229
In some instances, an interviewer is unable to complete an
interview with a
household or an individual in the household (i.e., they are
“noninterviews”).230 The
NCVS classifies various types of noninterviews. Because the
sample is a sample of
households, and not of the people who live in the household,
some sampled
households may not be able to be interviewed.231 For example,
the household may
be vacant, occupied by persons who have usual residences
elsewhere, or temporarily
or permanently converted to a business.232 In these instances,
the households are
removed from the sample, either until the next time the
household is to be
interviewed (if the situation is temporary) or permanently, if the
household will not
be eligible for interviewing in the future.233 Other
noninterviews occur when an
interview cannot be completed with the entire eligible
household, or when an
interview cannot be completed with an eligible member of a
household.234 Such
noninterviews occur for a variety of reasons, including if no one
is home during the
three-week interview period, if the household or persons in the
household refuse to
be interviewed, and if the household is not reachable, for
example, because of
impassable roads.235
The NCVS does not rely on the respondent or the interviewer to
classify
reported victimizations. Rather, victimizations are classified
based on details of the
reported incident provided by the respondent.236 For example,
a woman does not
have to report that she was the victim of a rape for the
victimization to be classified
as a rape. If the details provided by the respondent indicate that
the respondent was
the victim of a rape, the victimization will be classified as a
rape in the NCVS.
Moreover, if the details of the incident do not meet the criteria
necessary to define
a victimization as a particular crime, the victimization will not
be counted as a
crime.237 For example, if a respondent believes that he/she
was assaulted but the
CRS-33
238 Michael R. Rand and Callie M. Rennison, “True Crime
Stories? Accounting for
Differences in Our National Crime Indicators,” Chance, vol. 15,
no. 1 (2002), p. 49,
hereafter “M.R. Rand and C.M Rennison ‘Accounting for
Differences in Our National
Crime Indicators.’”
239 Ibid.
240 A confidence interval shows the range within which the true
value of a calculated statistic
is likely to fall a certain percentage of the time. In this case,
the NCVS estimated that 95%
of the time, the true violent crime victimization rate was in the
range of 25.85 to 29.95
victimizations per 100,000 people aged 12 or older. There was
a 5% chance that it was
either higher or lower than that range.
241 M.R. Rand and C.M Rennison “Accounting for Differences
in Our National Crime
Indicators,” p. 49.
242 Ibid.
243 Ibid.
details do not meet the criteria of a simple assault, the
victimization will not be
counted as a simple assault in the NCVS.
Limitations of NCVS Data
Sampling and Non-sampling Error. As described above, the
NCVS
estimates national crime rates by interviewing a sample of
households across the
country. Because the NCVS is a sample survey, it is subject to
both sampling and
non-sampling error, meaning that the estimated victimization
rate might not
accurately reflect the true victimization rate. Whenever
samples are used to represent
entire populations, there could be a discrepancy between the
sample estimate and the
true value of what the sample is trying to estimate. The NCVS
accounts for sampling
error by calculating confidence intervals for estimated rates of
victimization.238 For
example, in 2000, the estimated violent crime victimization rate
was 27.9
victimizations per 100,000 people aged 12 and older.239 The
calculated 95%
confidence interval240 for the estimated violent crime
victimization rate was 25.85 to
29.95 victimizations per 100,000 people aged 12 and older.241
The NCVS is also subject to non-sampling error. The
methodology employed
by the NCVS attempts to reduce the effects of non-sampling
error as much as
possible, but an unquantified amount remains.242 Non-
sampling error can result from
respondents not being able to recall victimizations that occurred
to them during the
reference period. Non-sampling error can also occur when
respondents do not report
crimes to the interviewer. Respondents may not report crimes
because they know the
perpetrator or because they are victims of certain crimes
frequently enough that they
forget that they were victimized or they do not consider the
victimizations important
enough to report.243
Sampling Bias. The NCVS relies on interviews with household
members to
collect its data, but it is likely that some people sampled will
not complete the survey.
As shown in Appendix G, between 1996 and 2005, anywhere
from 9% to 16% of
people included in the sample did not complete the survey. If
non-responders differ
from responders in the number of victimizations they
experienced, the estimated
CRS-34
244 C.J. Mosher et al., The Mismeasure of Crime, p. 159.
245 C.M. Rennison and M. Rand, “Introduction to the NCVS,”
pp. 42-43.
246 U.S. Department of Justice, Office of Justice Programs,
Bureau of Justice Statistics,
Criminal Victimization in the United States, 2005 Statistical
Tables, National Crime
Victimization Survey, NCJ 215244, December 2006, p. 134.
247 See, for example, Callie Marie Rennison, Intimate Partner
Violence and Age of Victim,
1993-99, U.S Department of Justice, Office of Justice Programs,
Bureau of Justice Statistics,
NCJ 187635, October 2001.
national victimization rate might be lower or higher than the
true victimization rate.
Researchers have reported that homeless people, young males,
and members of
minority groups are less likely to be included in the NCVS
sample and have higher
rates of victimization than their older, female, non-minority
counterparts.244
Series Victimizations. When a respondent experiences six or
more similar
but separate victimizations, and when the respondent is unable
to recall the details
of each incident well enough to describe them to the
interviewer, the interviewer
completes one incident report to cover the series of
incidents.245 The incident report
is completed using information from the most recent incident.
BJS does not include
series victimizations when it calculates annual victimization
rates.246 However, BJS
does use series victimization data in special reports where series
victimizations are
an important aspect of the subject being analyzed (e.g.,
domestic violence).247 In
these instances, one series is counted as one incident.
It is likely that not including series victimization estimates in
the annual
victimization estimates would result in an underestimation of
the true national
victimization rate. But the question remains, how large would
this effect be? Each
year, BJS includes data on the number and percentage of total
victimizations reported
as series victimizations. As shown in Figure 1, the percentage
of personal crimes
reported as series victimizations ranged from 3.5% in 2001 to
4.7% in 2003 and
2004. The percentage of property crimes reported as series
victimizations was
consistent from 2001 to 2004 (0.8%) and decreased to 0.5% in
2005.
CRS-35
248 C.M. Rennison and M. Rand, “Introduction to the NCVS,”
pp. 30-31.
249 As cited in Ibid.
Source: U.S. Department of Justice, Office of Justice Programs,
Bureau of Justice Statistics, Criminal
Victimization in the United States, 2005 Statistical Tables,
National Crime Victimization Survey, NCJ
215244, December 2006.
Changes in Household Residents. As described above, a sample
of
households is selected to be interviewed for the NCVS, and it is
the household, not
the people in the household, that remains in the sample. Hence,
the interviewer
interviews anyone in the household over the age of 12 at each
enumeration, even if
the residents of the household have changed from the previous
interview. This can
result in some cases where unbounded interviews can be
included in the national
victimization estimates. For example, if a new family moves
into the household
while the household is in the sample, the interviews with the
family will be
unbounded because the bounding interview for the household
was conducted during
Order Code RL34309How Crime in the United States Is Measur.docx

More Related Content

Similar to Order Code RL34309How Crime in the United States Is Measur.docx

Senate
SenateSenate
Senatetsnua
 
Thesis Final Draft
Thesis Final DraftThesis Final Draft
Thesis Final Draftjoycemi_la
 
Rapporto Rand Lgbt nell'esercito Usa
Rapporto Rand Lgbt nell'esercito UsaRapporto Rand Lgbt nell'esercito Usa
Rapporto Rand Lgbt nell'esercito UsaCarlo Rossi
 
INTIMATE PARTNER VIOLENCE SURVEILLANCE UNIFORM DEFINITIONS AND RECOMMENDED DA...
INTIMATE PARTNER VIOLENCE SURVEILLANCE UNIFORM DEFINITIONS AND RECOMMENDED DA...INTIMATE PARTNER VIOLENCE SURVEILLANCE UNIFORM DEFINITIONS AND RECOMMENDED DA...
INTIMATE PARTNER VIOLENCE SURVEILLANCE UNIFORM DEFINITIONS AND RECOMMENDED DA...InstitutodeEstadstic
 
Social Vulnerability Assessment Tools for Climate Change and DRR Programming
Social Vulnerability Assessment Tools for Climate Change and DRR ProgrammingSocial Vulnerability Assessment Tools for Climate Change and DRR Programming
Social Vulnerability Assessment Tools for Climate Change and DRR ProgrammingUNDP Climate
 
The Guide to Medicare Preventative Services for Physicans, Providers and Supp...
The Guide to Medicare Preventative Services for Physicans, Providers and Supp...The Guide to Medicare Preventative Services for Physicans, Providers and Supp...
The Guide to Medicare Preventative Services for Physicans, Providers and Supp...Tim Boucher
 
Informe sobre la situación mundial de la seguridad vial 2013
Informe sobre la situación mundial de la seguridad vial 2013Informe sobre la situación mundial de la seguridad vial 2013
Informe sobre la situación mundial de la seguridad vial 2013Eduardo Nelson German
 
IUCRC_EconImpactFeasibilityReport_FinalFinal
IUCRC_EconImpactFeasibilityReport_FinalFinalIUCRC_EconImpactFeasibilityReport_FinalFinal
IUCRC_EconImpactFeasibilityReport_FinalFinalJay Lee
 
Animal Cruelty As A Gateway Crime
Animal Cruelty As A Gateway CrimeAnimal Cruelty As A Gateway Crime
Animal Cruelty As A Gateway CrimeCassie Romero
 
GuidanceAdressingConflictRelatedSexualViolence_UNDPA(english)_1
GuidanceAdressingConflictRelatedSexualViolence_UNDPA(english)_1GuidanceAdressingConflictRelatedSexualViolence_UNDPA(english)_1
GuidanceAdressingConflictRelatedSexualViolence_UNDPA(english)_1Gina Torry
 
Modeling, simulation, and operations analysis in afghanistan and iraq
Modeling, simulation, and operations analysis in afghanistan and iraqModeling, simulation, and operations analysis in afghanistan and iraq
Modeling, simulation, and operations analysis in afghanistan and iraqMamuka Mchedlidze
 

Similar to Order Code RL34309How Crime in the United States Is Measur.docx (20)

Senate
SenateSenate
Senate
 
911
911911
911
 
Rand rr4212 (1)
Rand rr4212 (1)Rand rr4212 (1)
Rand rr4212 (1)
 
Thesis Final Draft
Thesis Final DraftThesis Final Draft
Thesis Final Draft
 
Rand rr2637
Rand rr2637Rand rr2637
Rand rr2637
 
Rapporto Rand Lgbt nell'esercito Usa
Rapporto Rand Lgbt nell'esercito UsaRapporto Rand Lgbt nell'esercito Usa
Rapporto Rand Lgbt nell'esercito Usa
 
INTIMATE PARTNER VIOLENCE SURVEILLANCE UNIFORM DEFINITIONS AND RECOMMENDED DA...
INTIMATE PARTNER VIOLENCE SURVEILLANCE UNIFORM DEFINITIONS AND RECOMMENDED DA...INTIMATE PARTNER VIOLENCE SURVEILLANCE UNIFORM DEFINITIONS AND RECOMMENDED DA...
INTIMATE PARTNER VIOLENCE SURVEILLANCE UNIFORM DEFINITIONS AND RECOMMENDED DA...
 
Social Vulnerability Assessment Tools for Climate Change and DRR Programming
Social Vulnerability Assessment Tools for Climate Change and DRR ProgrammingSocial Vulnerability Assessment Tools for Climate Change and DRR Programming
Social Vulnerability Assessment Tools for Climate Change and DRR Programming
 
Rand rr2621
Rand rr2621Rand rr2621
Rand rr2621
 
The Guide to Medicare Preventative Services for Physicans, Providers and Supp...
The Guide to Medicare Preventative Services for Physicans, Providers and Supp...The Guide to Medicare Preventative Services for Physicans, Providers and Supp...
The Guide to Medicare Preventative Services for Physicans, Providers and Supp...
 
Informe sobre la situación mundial de la seguridad vial 2013
Informe sobre la situación mundial de la seguridad vial 2013Informe sobre la situación mundial de la seguridad vial 2013
Informe sobre la situación mundial de la seguridad vial 2013
 
Ps64 36-2007 e
Ps64 36-2007 ePs64 36-2007 e
Ps64 36-2007 e
 
IUCRC_EconImpactFeasibilityReport_FinalFinal
IUCRC_EconImpactFeasibilityReport_FinalFinalIUCRC_EconImpactFeasibilityReport_FinalFinal
IUCRC_EconImpactFeasibilityReport_FinalFinal
 
Animal Cruelty As A Gateway Crime
Animal Cruelty As A Gateway CrimeAnimal Cruelty As A Gateway Crime
Animal Cruelty As A Gateway Crime
 
LSC 2014 factbook
LSC 2014 factbookLSC 2014 factbook
LSC 2014 factbook
 
GuidanceAdressingConflictRelatedSexualViolence_UNDPA(english)_1
GuidanceAdressingConflictRelatedSexualViolence_UNDPA(english)_1GuidanceAdressingConflictRelatedSexualViolence_UNDPA(english)_1
GuidanceAdressingConflictRelatedSexualViolence_UNDPA(english)_1
 
Cambodia rape final
Cambodia rape finalCambodia rape final
Cambodia rape final
 
Material Indifference
Material IndifferenceMaterial Indifference
Material Indifference
 
Modeling, simulation, and operations analysis in afghanistan and iraq
Modeling, simulation, and operations analysis in afghanistan and iraqModeling, simulation, and operations analysis in afghanistan and iraq
Modeling, simulation, and operations analysis in afghanistan and iraq
 
Matrix_2022_eng.pdf
Matrix_2022_eng.pdfMatrix_2022_eng.pdf
Matrix_2022_eng.pdf
 

More from vannagoforth

1. Primary sources2. Secondary sources3. La Malinche4. Bacon’s.docx
1. Primary sources2. Secondary sources3. La Malinche4. Bacon’s.docx1. Primary sources2. Secondary sources3. La Malinche4. Bacon’s.docx
1. Primary sources2. Secondary sources3. La Malinche4. Bacon’s.docxvannagoforth
 
1. Prepare an outline, an introduction, and a summary.docx
1. Prepare an outline, an introduction, and a summary.docx1. Prepare an outline, an introduction, and a summary.docx
1. Prepare an outline, an introduction, and a summary.docxvannagoforth
 
1. Normative moral philosophy typically focuses on the determining t.docx
1. Normative moral philosophy typically focuses on the determining t.docx1. Normative moral philosophy typically focuses on the determining t.docx
1. Normative moral philosophy typically focuses on the determining t.docxvannagoforth
 
1. Paper should be 5-pages min. + 1 page works cited2. Should have.docx
1. Paper should be 5-pages min. + 1 page works cited2. Should have.docx1. Paper should be 5-pages min. + 1 page works cited2. Should have.docx
1. Paper should be 5-pages min. + 1 page works cited2. Should have.docxvannagoforth
 
1. Name and describe the three steps of the looking-glass self.2.docx
1. Name and describe the three steps of the looking-glass self.2.docx1. Name and describe the three steps of the looking-glass self.2.docx
1. Name and describe the three steps of the looking-glass self.2.docxvannagoforth
 
1. Provide an example of a business or specific person(s) that effec.docx
1. Provide an example of a business or specific person(s) that effec.docx1. Provide an example of a business or specific person(s) that effec.docx
1. Provide an example of a business or specific person(s) that effec.docxvannagoforth
 
1. Mexico and Guatemala. Research the political and economic situati.docx
1. Mexico and Guatemala. Research the political and economic situati.docx1. Mexico and Guatemala. Research the political and economic situati.docx
1. Mexico and Guatemala. Research the political and economic situati.docxvannagoforth
 
1. Many scholars have set some standards to judge a system for taxat.docx
1. Many scholars have set some standards to judge a system for taxat.docx1. Many scholars have set some standards to judge a system for taxat.docx
1. Many scholars have set some standards to judge a system for taxat.docxvannagoforth
 
1. List and (in 1-2 sentences) describe the 4 interlocking factors t.docx
1. List and (in 1-2 sentences) describe the 4 interlocking factors t.docx1. List and (in 1-2 sentences) describe the 4 interlocking factors t.docx
1. List and (in 1-2 sentences) describe the 4 interlocking factors t.docxvannagoforth
 
1. Please explain how the Constitution provides for a system of sepa.docx
1. Please explain how the Constitution provides for a system of sepa.docx1. Please explain how the Constitution provides for a system of sepa.docx
1. Please explain how the Constitution provides for a system of sepa.docxvannagoforth
 
1. Please watch the following The Diving Bell & The Butterfly, Amel.docx
1. Please watch the following The Diving Bell & The Butterfly, Amel.docx1. Please watch the following The Diving Bell & The Butterfly, Amel.docx
1. Please watch the following The Diving Bell & The Butterfly, Amel.docxvannagoforth
 
1. Most sociologists interpret social life from one of the three maj.docx
1. Most sociologists interpret social life from one of the three maj.docx1. Most sociologists interpret social life from one of the three maj.docx
1. Most sociologists interpret social life from one of the three maj.docxvannagoforth
 
1. Members of one species cannot successfully interbreed and produc.docx
1. Members of one species cannot successfully interbreed and produc.docx1. Members of one species cannot successfully interbreed and produc.docx
1. Members of one species cannot successfully interbreed and produc.docxvannagoforth
 
1. Of the three chemical bonds discussed in class, which of them is .docx
1. Of the three chemical bonds discussed in class, which of them is .docx1. Of the three chemical bonds discussed in class, which of them is .docx
1. Of the three chemical bonds discussed in class, which of them is .docxvannagoforth
 
1. Look at your diagrams for hydrogen, lithium, and sodium. What do .docx
1. Look at your diagrams for hydrogen, lithium, and sodium. What do .docx1. Look at your diagrams for hydrogen, lithium, and sodium. What do .docx
1. Look at your diagrams for hydrogen, lithium, and sodium. What do .docxvannagoforth
 
1. Name the following molecules2. Sketch the following molecules.docx
1. Name the following molecules2. Sketch the following molecules.docx1. Name the following molecules2. Sketch the following molecules.docx
1. Name the following molecules2. Sketch the following molecules.docxvannagoforth
 
1. List the horizontal and vertical levels of systems that exist in .docx
1. List the horizontal and vertical levels of systems that exist in .docx1. List the horizontal and vertical levels of systems that exist in .docx
1. List the horizontal and vertical levels of systems that exist in .docxvannagoforth
 
1. Kemal Ataturk carried out policies that distanced the new Turkish.docx
1. Kemal Ataturk carried out policies that distanced the new Turkish.docx1. Kemal Ataturk carried out policies that distanced the new Turkish.docx
1. Kemal Ataturk carried out policies that distanced the new Turkish.docxvannagoforth
 
1. If we consider a gallon of gas as having 100 units of energy, and.docx
1. If we consider a gallon of gas as having 100 units of energy, and.docx1. If we consider a gallon of gas as having 100 units of energy, and.docx
1. If we consider a gallon of gas as having 100 units of energy, and.docxvannagoforth
 
1. In 200-250 words, analyze the basic issues of human biology as th.docx
1. In 200-250 words, analyze the basic issues of human biology as th.docx1. In 200-250 words, analyze the basic issues of human biology as th.docx
1. In 200-250 words, analyze the basic issues of human biology as th.docxvannagoforth
 

More from vannagoforth (20)

1. Primary sources2. Secondary sources3. La Malinche4. Bacon’s.docx
1. Primary sources2. Secondary sources3. La Malinche4. Bacon’s.docx1. Primary sources2. Secondary sources3. La Malinche4. Bacon’s.docx
1. Primary sources2. Secondary sources3. La Malinche4. Bacon’s.docx
 
1. Prepare an outline, an introduction, and a summary.docx
1. Prepare an outline, an introduction, and a summary.docx1. Prepare an outline, an introduction, and a summary.docx
1. Prepare an outline, an introduction, and a summary.docx
 
1. Normative moral philosophy typically focuses on the determining t.docx
1. Normative moral philosophy typically focuses on the determining t.docx1. Normative moral philosophy typically focuses on the determining t.docx
1. Normative moral philosophy typically focuses on the determining t.docx
 
1. Paper should be 5-pages min. + 1 page works cited2. Should have.docx
1. Paper should be 5-pages min. + 1 page works cited2. Should have.docx1. Paper should be 5-pages min. + 1 page works cited2. Should have.docx
1. Paper should be 5-pages min. + 1 page works cited2. Should have.docx
 
1. Name and describe the three steps of the looking-glass self.2.docx
1. Name and describe the three steps of the looking-glass self.2.docx1. Name and describe the three steps of the looking-glass self.2.docx
1. Name and describe the three steps of the looking-glass self.2.docx
 
1. Provide an example of a business or specific person(s) that effec.docx
1. Provide an example of a business or specific person(s) that effec.docx1. Provide an example of a business or specific person(s) that effec.docx
1. Provide an example of a business or specific person(s) that effec.docx
 
1. Mexico and Guatemala. Research the political and economic situati.docx
1. Mexico and Guatemala. Research the political and economic situati.docx1. Mexico and Guatemala. Research the political and economic situati.docx
1. Mexico and Guatemala. Research the political and economic situati.docx
 
1. Many scholars have set some standards to judge a system for taxat.docx
1. Many scholars have set some standards to judge a system for taxat.docx1. Many scholars have set some standards to judge a system for taxat.docx
1. Many scholars have set some standards to judge a system for taxat.docx
 
1. List and (in 1-2 sentences) describe the 4 interlocking factors t.docx
1. List and (in 1-2 sentences) describe the 4 interlocking factors t.docx1. List and (in 1-2 sentences) describe the 4 interlocking factors t.docx
1. List and (in 1-2 sentences) describe the 4 interlocking factors t.docx
 
1. Please explain how the Constitution provides for a system of sepa.docx
1. Please explain how the Constitution provides for a system of sepa.docx1. Please explain how the Constitution provides for a system of sepa.docx
1. Please explain how the Constitution provides for a system of sepa.docx
 
1. Please watch the following The Diving Bell & The Butterfly, Amel.docx
1. Please watch the following The Diving Bell & The Butterfly, Amel.docx1. Please watch the following The Diving Bell & The Butterfly, Amel.docx
1. Please watch the following The Diving Bell & The Butterfly, Amel.docx
 
1. Most sociologists interpret social life from one of the three maj.docx
1. Most sociologists interpret social life from one of the three maj.docx1. Most sociologists interpret social life from one of the three maj.docx
1. Most sociologists interpret social life from one of the three maj.docx
 
1. Members of one species cannot successfully interbreed and produc.docx
1. Members of one species cannot successfully interbreed and produc.docx1. Members of one species cannot successfully interbreed and produc.docx
1. Members of one species cannot successfully interbreed and produc.docx
 
1. Of the three chemical bonds discussed in class, which of them is .docx
1. Of the three chemical bonds discussed in class, which of them is .docx1. Of the three chemical bonds discussed in class, which of them is .docx
1. Of the three chemical bonds discussed in class, which of them is .docx
 
1. Look at your diagrams for hydrogen, lithium, and sodium. What do .docx
1. Look at your diagrams for hydrogen, lithium, and sodium. What do .docx1. Look at your diagrams for hydrogen, lithium, and sodium. What do .docx
1. Look at your diagrams for hydrogen, lithium, and sodium. What do .docx
 
1. Name the following molecules2. Sketch the following molecules.docx
1. Name the following molecules2. Sketch the following molecules.docx1. Name the following molecules2. Sketch the following molecules.docx
1. Name the following molecules2. Sketch the following molecules.docx
 
1. List the horizontal and vertical levels of systems that exist in .docx
1. List the horizontal and vertical levels of systems that exist in .docx1. List the horizontal and vertical levels of systems that exist in .docx
1. List the horizontal and vertical levels of systems that exist in .docx
 
1. Kemal Ataturk carried out policies that distanced the new Turkish.docx
1. Kemal Ataturk carried out policies that distanced the new Turkish.docx1. Kemal Ataturk carried out policies that distanced the new Turkish.docx
1. Kemal Ataturk carried out policies that distanced the new Turkish.docx
 
1. If we consider a gallon of gas as having 100 units of energy, and.docx
1. If we consider a gallon of gas as having 100 units of energy, and.docx1. If we consider a gallon of gas as having 100 units of energy, and.docx
1. If we consider a gallon of gas as having 100 units of energy, and.docx
 
1. In 200-250 words, analyze the basic issues of human biology as th.docx
1. In 200-250 words, analyze the basic issues of human biology as th.docx1. In 200-250 words, analyze the basic issues of human biology as th.docx
1. In 200-250 words, analyze the basic issues of human biology as th.docx
 

Recently uploaded

Sanyam Choudhary Chemistry practical.pdf
Sanyam Choudhary Chemistry practical.pdfSanyam Choudhary Chemistry practical.pdf
Sanyam Choudhary Chemistry practical.pdfsanyamsingh5019
 
Measures of Central Tendency: Mean, Median and Mode
Measures of Central Tendency: Mean, Median and ModeMeasures of Central Tendency: Mean, Median and Mode
Measures of Central Tendency: Mean, Median and ModeThiyagu K
 
Alper Gobel In Media Res Media Component
Alper Gobel In Media Res Media ComponentAlper Gobel In Media Res Media Component
Alper Gobel In Media Res Media ComponentInMediaRes1
 
Kisan Call Centre - To harness potential of ICT in Agriculture by answer farm...
Kisan Call Centre - To harness potential of ICT in Agriculture by answer farm...Kisan Call Centre - To harness potential of ICT in Agriculture by answer farm...
Kisan Call Centre - To harness potential of ICT in Agriculture by answer farm...Krashi Coaching
 
Concept of Vouching. B.Com(Hons) /B.Compdf
Concept of Vouching. B.Com(Hons) /B.CompdfConcept of Vouching. B.Com(Hons) /B.Compdf
Concept of Vouching. B.Com(Hons) /B.CompdfUmakantAnnand
 
Paris 2024 Olympic Geographies - an activity
Paris 2024 Olympic Geographies - an activityParis 2024 Olympic Geographies - an activity
Paris 2024 Olympic Geographies - an activityGeoBlogs
 
Call Girls in Dwarka Mor Delhi Contact Us 9654467111
Call Girls in Dwarka Mor Delhi Contact Us 9654467111Call Girls in Dwarka Mor Delhi Contact Us 9654467111
Call Girls in Dwarka Mor Delhi Contact Us 9654467111Sapana Sha
 
Arihant handbook biology for class 11 .pdf
Arihant handbook biology for class 11 .pdfArihant handbook biology for class 11 .pdf
Arihant handbook biology for class 11 .pdfchloefrazer622
 
The Most Excellent Way | 1 Corinthians 13
The Most Excellent Way | 1 Corinthians 13The Most Excellent Way | 1 Corinthians 13
The Most Excellent Way | 1 Corinthians 13Steve Thomason
 
Contemporary philippine arts from the regions_PPT_Module_12 [Autosaved] (1).pptx
Contemporary philippine arts from the regions_PPT_Module_12 [Autosaved] (1).pptxContemporary philippine arts from the regions_PPT_Module_12 [Autosaved] (1).pptx
Contemporary philippine arts from the regions_PPT_Module_12 [Autosaved] (1).pptxRoyAbrique
 
Incoming and Outgoing Shipments in 1 STEP Using Odoo 17
Incoming and Outgoing Shipments in 1 STEP Using Odoo 17Incoming and Outgoing Shipments in 1 STEP Using Odoo 17
Incoming and Outgoing Shipments in 1 STEP Using Odoo 17Celine George
 
CARE OF CHILD IN INCUBATOR..........pptx
CARE OF CHILD IN INCUBATOR..........pptxCARE OF CHILD IN INCUBATOR..........pptx
CARE OF CHILD IN INCUBATOR..........pptxGaneshChakor2
 
18-04-UA_REPORT_MEDIALITERAСY_INDEX-DM_23-1-final-eng.pdf
18-04-UA_REPORT_MEDIALITERAСY_INDEX-DM_23-1-final-eng.pdf18-04-UA_REPORT_MEDIALITERAСY_INDEX-DM_23-1-final-eng.pdf
18-04-UA_REPORT_MEDIALITERAСY_INDEX-DM_23-1-final-eng.pdfssuser54595a
 
Introduction to ArtificiaI Intelligence in Higher Education
Introduction to ArtificiaI Intelligence in Higher EducationIntroduction to ArtificiaI Intelligence in Higher Education
Introduction to ArtificiaI Intelligence in Higher Educationpboyjonauth
 
Separation of Lanthanides/ Lanthanides and Actinides
Separation of Lanthanides/ Lanthanides and ActinidesSeparation of Lanthanides/ Lanthanides and Actinides
Separation of Lanthanides/ Lanthanides and ActinidesFatimaKhan178732
 
PSYCHIATRIC History collection FORMAT.pptx
PSYCHIATRIC   History collection FORMAT.pptxPSYCHIATRIC   History collection FORMAT.pptx
PSYCHIATRIC History collection FORMAT.pptxPoojaSen20
 

Recently uploaded (20)

Sanyam Choudhary Chemistry practical.pdf
Sanyam Choudhary Chemistry practical.pdfSanyam Choudhary Chemistry practical.pdf
Sanyam Choudhary Chemistry practical.pdf
 
Measures of Central Tendency: Mean, Median and Mode
Measures of Central Tendency: Mean, Median and ModeMeasures of Central Tendency: Mean, Median and Mode
Measures of Central Tendency: Mean, Median and Mode
 
Alper Gobel In Media Res Media Component
Alper Gobel In Media Res Media ComponentAlper Gobel In Media Res Media Component
Alper Gobel In Media Res Media Component
 
Kisan Call Centre - To harness potential of ICT in Agriculture by answer farm...
Kisan Call Centre - To harness potential of ICT in Agriculture by answer farm...Kisan Call Centre - To harness potential of ICT in Agriculture by answer farm...
Kisan Call Centre - To harness potential of ICT in Agriculture by answer farm...
 
Concept of Vouching. B.Com(Hons) /B.Compdf
Concept of Vouching. B.Com(Hons) /B.CompdfConcept of Vouching. B.Com(Hons) /B.Compdf
Concept of Vouching. B.Com(Hons) /B.Compdf
 
Código Creativo y Arte de Software | Unidad 1
Código Creativo y Arte de Software | Unidad 1Código Creativo y Arte de Software | Unidad 1
Código Creativo y Arte de Software | Unidad 1
 
Paris 2024 Olympic Geographies - an activity
Paris 2024 Olympic Geographies - an activityParis 2024 Olympic Geographies - an activity
Paris 2024 Olympic Geographies - an activity
 
Call Girls in Dwarka Mor Delhi Contact Us 9654467111
Call Girls in Dwarka Mor Delhi Contact Us 9654467111Call Girls in Dwarka Mor Delhi Contact Us 9654467111
Call Girls in Dwarka Mor Delhi Contact Us 9654467111
 
Arihant handbook biology for class 11 .pdf
Arihant handbook biology for class 11 .pdfArihant handbook biology for class 11 .pdf
Arihant handbook biology for class 11 .pdf
 
The Most Excellent Way | 1 Corinthians 13
The Most Excellent Way | 1 Corinthians 13The Most Excellent Way | 1 Corinthians 13
The Most Excellent Way | 1 Corinthians 13
 
Contemporary philippine arts from the regions_PPT_Module_12 [Autosaved] (1).pptx
Contemporary philippine arts from the regions_PPT_Module_12 [Autosaved] (1).pptxContemporary philippine arts from the regions_PPT_Module_12 [Autosaved] (1).pptx
Contemporary philippine arts from the regions_PPT_Module_12 [Autosaved] (1).pptx
 
Incoming and Outgoing Shipments in 1 STEP Using Odoo 17
Incoming and Outgoing Shipments in 1 STEP Using Odoo 17Incoming and Outgoing Shipments in 1 STEP Using Odoo 17
Incoming and Outgoing Shipments in 1 STEP Using Odoo 17
 
CARE OF CHILD IN INCUBATOR..........pptx
CARE OF CHILD IN INCUBATOR..........pptxCARE OF CHILD IN INCUBATOR..........pptx
CARE OF CHILD IN INCUBATOR..........pptx
 
TataKelola dan KamSiber Kecerdasan Buatan v022.pdf
TataKelola dan KamSiber Kecerdasan Buatan v022.pdfTataKelola dan KamSiber Kecerdasan Buatan v022.pdf
TataKelola dan KamSiber Kecerdasan Buatan v022.pdf
 
18-04-UA_REPORT_MEDIALITERAСY_INDEX-DM_23-1-final-eng.pdf
18-04-UA_REPORT_MEDIALITERAСY_INDEX-DM_23-1-final-eng.pdf18-04-UA_REPORT_MEDIALITERAСY_INDEX-DM_23-1-final-eng.pdf
18-04-UA_REPORT_MEDIALITERAСY_INDEX-DM_23-1-final-eng.pdf
 
Staff of Color (SOC) Retention Efforts DDSD
Staff of Color (SOC) Retention Efforts DDSDStaff of Color (SOC) Retention Efforts DDSD
Staff of Color (SOC) Retention Efforts DDSD
 
Introduction to ArtificiaI Intelligence in Higher Education
Introduction to ArtificiaI Intelligence in Higher EducationIntroduction to ArtificiaI Intelligence in Higher Education
Introduction to ArtificiaI Intelligence in Higher Education
 
Separation of Lanthanides/ Lanthanides and Actinides
Separation of Lanthanides/ Lanthanides and ActinidesSeparation of Lanthanides/ Lanthanides and Actinides
Separation of Lanthanides/ Lanthanides and Actinides
 
PSYCHIATRIC History collection FORMAT.pptx
PSYCHIATRIC   History collection FORMAT.pptxPSYCHIATRIC   History collection FORMAT.pptx
PSYCHIATRIC History collection FORMAT.pptx
 
Model Call Girl in Tilak Nagar Delhi reach out to us at 🔝9953056974🔝
Model Call Girl in Tilak Nagar Delhi reach out to us at 🔝9953056974🔝Model Call Girl in Tilak Nagar Delhi reach out to us at 🔝9953056974🔝
Model Call Girl in Tilak Nagar Delhi reach out to us at 🔝9953056974🔝
 

Order Code RL34309How Crime in the United States Is Measur.docx

  • 1. Order Code RL34309 How Crime in the United States Is Measured January 3, 2008 Nathan James Analyst in Crime Policy Domestic Social Policy Division Logan Rishard Council Intern Domestic Social Policy Division http://www.fas.org/sgp/crs/misc/index.html How Crime in the United States Is Measured Summary Crime data collected through the Uniform Crime Reports (UCR), the National Incident-Based Reporting System (NIBRS), and the National Crime Victimization Survey (NCVS) are used by Congress to inform policy decisions and allocate federal criminal justice funding to states. As such, it is important to understand how each program collects and reports crime data, and the limitations
  • 2. associated with the data. This report reviews (1) the history of the UCR, the NIBRS, and the NCVS; (2) the methods each program uses to collect crime data; and (3) the limitations of the data collected by each program. The report then compares the similarities and differences of UCR and NCVS data. It concludes by reviewing issues related to the NIBRS and the NCVS. The UCR represents the first effort to create a national, standardized measure of the incidence of crime. It was conceived as a way to measure the effectiveness of local law enforcement and to provide law enforcement with data that could be used to help fight crime. UCR data are now used extensively by researchers, government officials, and the media for research, policy, and planning purposes. The UCR also provides some of the most commonly cited crime statistics in the United States. The UCR reports offense and arrest data for 8 different Part I offenses and arrest data for 21 different Part II offenses. The NIBRS was developed by the Federal Bureau of Investigation to respond to the law enforcement community’s belief that the UCR needed to be updated to provide more in-depth data to meet the needs of law enforcement into the 21st century. The NIBRS collects data, including data on offense(s),
  • 3. offender(s), victim(s), arrestee(s), and any property involved in an offense, for 46 different Group A offenses and 11 different Group B offenses. Despite the more detailed crime data that the NIBRS can provide, nationwide implementation of the program has been slow, for a variety of reasons, including cost considerations. The NCVS is the primary source of information on the characteristics of criminal victimization, and on the number and types of crime not reported to law enforcement. The NCVS has four major objectives: (1) to develop detailed information about the victims and consequences of crime, (2) to estimate the number and types of crimes not reported to police, (3) to provide uniform measures of selected types of crimes, and (4) to permit comparisons over time and population type (e.g., urban, suburban, and rural). The NCVS asks respondents whether they have been the victim of rape and sexual assault, robbery, simple and aggravated assault, purse snatching/pickpocketing, burglary, theft, or motor vehicle theft. In addition to collecting data on the number of victimizations, the NCVS gathers data on the details of each incident of victimization. This report will be updated as warranted.
  • 4. Contents Introduction . . . . . . . . . . . . . . . . . . . . . . . . . . . . . . . . . . . . . . . . . . . . . . . . . . . . . . 1 Uniform Crime Reports (UCR) . . . . . . . . . . . . . . . . . . . . . . . . . . . . . . . . . . . . . . . 2 UCR’s History . . . . . . . . . . . . . . . . . . . . . . . . . . . . . . . . . . . . . . . . . . . . . . . . 3 How UCR Data Are Collected . . . . . . . . . . . . . . . . . . . . . . . . . . . . . . . . . . . . 5 UCR Participation in the United States . . . . . . . . . . . . . . . . . . . . . . . . . 5 State UCR Programs . . . . . . . . . . . . . . . . . . . . . . . . . . . . . . . . . . . . . . . 6 UCR Data . . . . . . . . . . . . . . . . . . . . . . . . . . . . . . . . . . . . . . . . . . . . . . . . 7 Scoring and Classifying UCR Data . . . . . . . . . . . . . . . . . . . . . . . . . . . . 8 Development of the NIBRS . . . . . . . . . . . . . . . . . . . . . . . . . . . . . . . . . . . . . 11 The NIBRS Compared with the UCR . . . . . . . . . . . . . . . . . . . . . . . . . . . . . 13 NIBRS Data . . . . . . . . . . . . . . . . . . . . . . . . . . . . . . . . . . . . . . . . . . . . . 13 NIBRS Certification . . . . . . . . . . . . . . . . . . . . . . . . . . . . . . . . . . . . . . . 14 Classifying and Scoring NIBRS Data . . . . . . . . . . . . . . . . . . . . . . . . . 15 Advantages of the NIBRS . . . . . . . . . . . . . . . . . . . . . . . . . . . . . . . . . . 16 Transition to the NIBRS . . . . . . . . . . . . . . . . . . . . . . . . . . . . .
  • 5. . . . . . . . . . . 17 Limitations of UCR and NIBRS Data . . . . . . . . . . . . . . . . . . . . . . . . . . . . . 17 Limited Offense Data . . . . . . . . . . . . . . . . . . . . . . . . . . . . . . . . . . . . . . 17 Unreported Crimes . . . . . . . . . . . . . . . . . . . . . . . . . . . . . . . . . . . . . . . . 18 Reporting Practices of Law Enforcement . . . . . . . . . . . . . . . . . . . . . . 18 Missing Data . . . . . . . . . . . . . . . . . . . . . . . . . . . . . . . . . . . . . . . . . . . . 19 Imputation Procedures . . . . . . . . . . . . . . . . . . . . . . . . . . . . . . . . . . . . . 19 National Crime Victimization Survey (NCVS) . . . . . . . . . . . . . . . . . . . . . . . . . . 21 NCVS’ History . . . . . . . . . . . . . . . . . . . . . . . . . . . . . . . . . . . . . . . . . . . . . . . 21 How NCVS Data Are Collected . . . . . . . . . . . . . . . . . . . . . . . . . . . . . . . . . 28 NCVS Data . . . . . . . . . . . . . . . . . . . . . . . . . . . . . . . . . . . . . . . . . . . . . 28 NCVS Methodology . . . . . . . . . . . . . . . . . . . . . . . . . . . . . . . . . . . . . . 29 Limitations of NCVS Data . . . . . . . . . . . . . . . . . . . . . . . . . . . . . . . . . . . . . . 33 Sampling and Non-sampling Error . . . . . . . . . . . . . . . . . . . . . . . . . . . 33 Sampling Bias . . . . . . . . . . . . . . . . . . . . . . . . . . . . . . . . . . . . . . . . . . . 33 Series Victimizations . . . . . . . . . . . . . . . . . . . . . . . . . . . . . . . . . . . . . . 34 Changes in Household Residents . . . . . . . . . . . . . . . . . . . . . . .
  • 6. . . . . . . 35 Limitations on the Scope of Crimes Covered . . . . . . . . . . . . . . . . . . . 35 Survey Design and Implementation . . . . . . . . . . . . . . . . . . . . . . . . . . . 36 The UCR Compared with the NCVS . . . . . . . . . . . . . . . . . . . . . . . . . . . . . . . . . . 37 Select Issues . . . . . . . . . . . . . . . . . . . . . . . . . . . . . . . . . . . . . . . . . . . . . . . . . . . . . 38 Implementing the NIBRS Nationwide . . . . . . . . . . . . . . . . . . . . . . . . . 39 Does the NIBRS Increase the Crime Rate? . . . . . . . . . . . . . . . . . . . . . 41 Decreases in the NCVS Sample Size . . . . . . . . . . . . . . . . . . . . . . . . . . 43 Appendix A. Status of UCR and NIBRS Reporting, by State . . . . . . . . . . . . . . . 45 Appendix B. UCR Part I and Part II Offenses . . . . . . . . . . . . . . . . . . . . . . . . . . . 47 Appendix C. UCR Hierarchy of Part I Offenses . . . . . . . . . . . . . . . . . . . . . . . . . 48 Appendix D. NIBRS Data Elements . . . . . . . . . . . . . . . . . . . . . . . . . . . . . . . . . . 49 Appendix E. Relationship Between NIBRS Data Elements . . . . . . . . . . . . . . . . 51 Appendix F. NIBRS Group A and Group B Offenses . . . . . . . . .
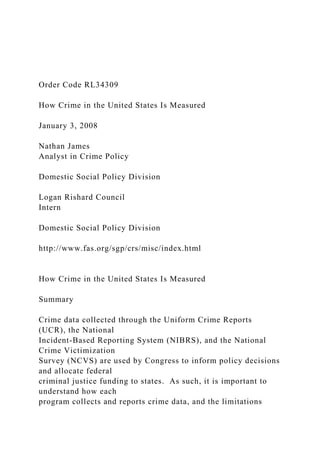
  • 7. . . . . . . . . . . . . 52 Appendix G. UCR Offense Definitions . . . . . . . . . . . . . . . . . . . . . . . . . . . . . . . . 54 Appendix H. NIBRS Offense Definitions . . . . . . . . . . . . . . . . . . . . . . . . . . . . . . 58 Appendix I. Number of Households and Persons Interviewed for the NCVS, by Year . . . . . . . . . . . . . . . . . . . . . . . . . . . . . . . . . . . . . . . . . . . . . . . . . . . . . . . . . . . 64 List of Figures Figure 1. Percentage of Victimizations Reported as Series Victimizations, 2000-2005 . . . . . . . . . . . . . . . . . . . . . . . . . . . . . . . . . . . . . . . . . . . . . . . . . . . . . . . . . . . 35 List of Tables Table 1. Number and Percentage of Cases in Which NIBRS Crime Rates Differ from UCR Crime Rates by 5.5% or Less . . . . . . . . . . . . . . . . . . . . . . . . . . . . . . . 42 1 Currently, there are not enough law enforcement agencies in the country submitting NIBRS data for the Federal Bureau of Investigation (FBI) to report annual crime statistics using NIBRS data. The FBI still publishes annual crime data using
  • 8. the UCR summary format (see below). As such, the FBI converts data submitted from NIBRS- compliant law enforcement agencies into UCR summary data. 2 U.S. Congress, Conference Committees, Violent Crime Control and Law Enforcement Act of 1994, conference report to accompany H.R. 3355, 103rd Cong., 2nd sess., H.Rept. 103-711 (Washington: GPO, 1994), p. 372. 3 For more information on how UCR crime data are used in the JAG program, see CRS Report RS22416, Edward Byrne Memorial Justice Assistance Grant Program: Legislative and Funding History, by Nathan James. 4 For more information on S. 368, H.R. 1700, and the COPS program, see CRS Report RL33308, Community Oriented Policing Services (COPS): Background, Legislation, and Issues, by Nathan James. 5 U.S. Congress, House Committee on the Judiciary, COPS Improvement Act of 2007, report to accompany H.R. 1700, 110th Cong., 1st sess., H.Rept. 110- 150 (Washington: GPO, 2007), pp. 6-7; U.S. Congress, Senate Committee on the Judiciary, COPS Improvement Act of 2007, report to accompany S. 368, 110th Cong., 1st sess., S.Rept. 110- 73 (Washington: GPO, 2007), (continued...) How Crime in the United States Is Measured Introduction Congress uses data from the Uniform Crime Reports (UCR), the National
  • 9. Incident-Based Reporting System (NIBRS),1 and the National Crime Victimization Survey (NCVS) to inform policy decisions and develop appropriate responses to crime. Such crime data have been used to shape policy in a variety of ways. For example, in the 103rd Congress, the Community Oriented Policing Services (COPS) program was created to provide state and local law enforcement agencies with grants to help them hire, rehire, and redeploy law enforcement officers to engage in community policing. Congress cited both UCR and NCVS crime statistics when articulating the need for more community policing officers.2 In addition to shaping policy, Congress has used crime data to develop formula allocations for certain grant programs. For example, the Edward Byrne Memorial Justice Assistance Grant (JAG) program formula uses UCR data to allocate federal funds to state and local governments for criminal justice programs.3 In the 110th Congress, two bills have been introduced (S. 368 and H.R. 1700) that would increase authorized funding for and expand the scope of the COPS program.4 The impetus for the legislation was a recent increase in the violent crime rate as reported by the UCR.5 Moreover, both the House and Senate Appropriations
  • 10. CRS-2 5 (...continued) pp. 3, 7. 6 U.S. Congress, House Committee on Appropriations, Subcommittee on Commerce, Justice, Science, and Related Agencies, Making appropriations for the Departments of Commerce and Justice, and Science, and Related Agencies for the fiscal year ending September 30, 2008, and for other purposes, report to accompany H.R. 3093, 110th Cong., 1st sess., H.Rept. 110-240 (Washington: GPO, 2007), p. 37. 7 Ibid., pp. 53-54; U.S. Congress, Senate Committee on Appropriations, Subcommittee on Commerce, Justice, Science, and Related Agencies, Departments of Commerce and Justice, Science, and Related Agencies Appropriations Act, 2008, report to accompany S. 1745, 110th Cong., 1st sess., S.Rept. 110-124 (Washington: GPO, 2007), pp. 65-66. 8 Ibid. Committees recommended increased funding for state and local law enforcement to support efforts to fight and prevent crime. The House report that accompanied the House Commerce, Justice, and Science appropriations bill stated that the committee was concerned about the recent increase in the violent crime rate.6 In addition, the House and the Senate Appropriations Committees increased funding for the Federal Bureau of Investigation (FBI) to hire additional agents to investigate violent crime.7
  • 11. The committees felt it was important for the FBI to help state and local law enforcement investigate violent crime in light of the recent increase in the violent crime rate.8 The aforementioned legislation and congressional action were based on crime data collected by the UCR and the NCVS. Because of the importance of crime data in both shaping policy and allocating federal funding, it is important to understand how each program collects data and the limitations of the data. This report reviews (1) the history of the UCR, the NIBRS, and the NCVS; (2) the methods each program uses to collect crime data; and (3) the limitations of the data collected by each program. The report then compares the similarities and differences of UCR and NCVS data. It concludes by reviewing issues related to the NIBRS and the NCVS. Uniform Crime Reports When the UCR was established in the late 1920s, it represented the first national, standardized measure of the incidence of crime. It was originally conceived as a way to measure the effectiveness of local law enforcement to provide law enforcement with data that could be used to help fight crime. UCR data are now used extensively by academics and government officials for research, policy, and planning purposes, and the data are widely cited in the media.
  • 12. The UCR also provides some of the most commonly cited crime statistics in the United States. An effort is currently underway to replace the UCR with the NIBRS, a more detailed version of the UCR. However, the transition from the UCR to the NIBRS has been slow. CRS-3 9 U.S. Department of Justice, Federal Bureau of Investigation, Uniform Crime Reporting Handbook, Revised 2004, p. 2, hereafter “UCR Handbook.” 10 Michael D. Maltz, Bridging Gaps in Police Crime Data, NCJ 176365, September 1999, U.S. Department of Justice, Office of Justice Programs, Bureau of Justice Statistics, p. 4, hereafter “M.D. Maltz, Bridging Gaps in Police Crime Data.” 11 Ibid. 12 UCR Handbook, p. 2. 13 Ibid. 14 Clayton J. Mosher, Terance D. Miethe, and Dretha M. Phillips, The Mismeasure of Crime (Thousand Oaks, CA: Sage Publications, 2002), p. 60, hereafter “C.J. Mosher et al., The Mismeasure of Crime.” 15 Ibid. 16 Ibid. UCR’s History In 1927, the International Association of Chiefs of Police (IACP) formed the
  • 13. Committee on Uniform Crime Records (the Committee) to develop a system for collecting uniform crime statistics.9 The IACP felt that a national system of crime reporting would put inevitable (and unpredictable) swings in the number of reported crimes in a single jurisdiction into a proper context.10 The IACP felt that putting changes in local crime incidence in the proper context would help reduce media pressure on local jurisdictions and police chiefs from sensational or sporadic increases in crime, which had resulted in some police departments “cooking the books” to reduce the amount of recorded crime (though there was no reduction in the amount of crime reported to the police).11 The Committee decided that offenses known to police would be the most appropriate measure of the incidence of crime in the United States.12 The Committee — after evaluating various crimes on the basis of their seriousness, frequency of occurrence, pervasiveness in all areas of the country, and likelihood of being reported to the police — identified seven crimes for which local law enforcement would report data to the national program: felonious murder, rape, robbery, aggravated assault, burglary, larceny/theft, and auto theft.13 The IACP focused on these seven crimes because they were prevalent, generally serious in their nature, widely identified by victims and witnesses as criminal incidents, and most likely to be reported to police.14
  • 14. Differences in the way that state criminal codes defined different crimes prevented the IACP from simply aggregating state statistics to count the number of offenses known to police.15 Thus, the IACP developed standardized offense definitions for the seven offense categories. In 1929, IACP published Uniform Crime Reporting, a manual for police records and statistics, which included uniform definitions for law enforcement agencies to use when submitting data to IACP.16 In that same year, 400 cities in 43 states and the territories of Puerto Rico, Hawaii, and Alaska submitted statistics to IACP, which published the data in Uniform Crime Reports for the United States and Its CRS-4 17 Ibid. 18 28 U.S.C. § 534. 19 UCR Handbook, p. 2. 20 Ibid. 21 M.D. Maltz, Bridging Gaps in Police Crime Data, p. 4. 22 UCR Handbook, p. 2. 23 Ibid. 24 Ibid. 25 Ibid. Possessions.17 In 1930, Congress, at the urging of IACP, authorized the Attorney General to collect crime data.18 The Attorney General
  • 15. designated the FBI as the clearinghouse for crime data collected through the UCR.19 The scope of the UCR program has continued to expand since it was created. Some of the changes to the UCR program include the following: ! Starting in 1952, law enforcement agencies began to submit data on the age, sex, and race of people arrested for crimes.20 ! Beginning in 1958, the FBI began to estimate annual crime rates for the nation as a whole.21 Prior to 1958, the FBI did not aggregate the data to the national level because there were not enough law enforcement agencies submitting data to the FBI to allow it to report national crime rates. Instead, the FBI published data in tables only according to the size of the reporting jurisdiction. ! In 1958, the FBI created a national crime index to serve as a general indicator of criminality in the United States.22 The national crime index was the total number of reported murder, rape, robbery, aggravated assault, burglary, larceny/theft (over $50), and auto theft offenses.23 ! In 1960, the UCR started to collect national statistics on law enforcement officers killed.24 In 1972, the UCR started to collect specific information on incidents in which law enforcement officers
  • 16. were killed or assaulted.25 ! In 1962, the UCR, through the Supplementary Homicide Report (SHR), started to collect data, where available, on the age, sex, and race of murder victims, the weapon used, and the circumstances surrounding the offense. CRS-5 26 C.J. Mosher et al., The Mismeasure of Crime, p. 61. 27 UCR Handbook, p. 2. 28 Ibid. 29 For more information on the Hate Crime Statistics Act, see CRS Report RL33403, Hate Crime Legislation, by William J. Krouse. 30 UCR Handbook, p. 3. 31 Ibid. 32 The FBI reported that it chose to suspend using the crime index and the modified crime index after studying their appropriateness and usefulness for several years. The FBI determined that both indexes were not true indicators of the degree of criminality because they were driven upward by the offense with the highest number, typically larceny-theft. The FBI reported that the sheer volume of those offenses overshadowed more serious but less frequently committed offenses, creating a bias against a jurisdiction with a high number of larceny-thefts but a low number of other serious crimes such as murder and forcible rape. U.S. Department of Justice, Federal Bureau of Investigation,
  • 17. Crime in the United States, 2005: About CUIS 2005, September 2006, hereafter “About CUIS 2005.” ! In the late 1960s and throughout the 1970s, there was continued growth of state UCR programs, which served as an intermediary between local law enforcement and the FBI (see below).26 ! In 1978, Congress mandated the collection of arson data.27 In 1982, Congress required the FBI to permanently count arson as a Part I offense (a definition of “Part I offense” is below).28 The FBI started to publish a “modified crime index,” which included the total number of reported index crimes plus the total number of reported arsons. ! In 1990, following the passage of the Hate Crime Statistics Act (P.L. 101-275),29 the FBI started to collect data on bias motivation in criminal incidents in which the offense resulted in whole or in part because of the offender’s prejudice against a race, religion, sexual orientation, or ethnicity/nationality.30 In 1994, Congress amended the Act to require the FBI to collect data on incidents in which the offense resulted from the offender’s bias against a physical or mental disability.31 ! In 2004, the FBI discontinued publishing both the crime index
  • 18. and the modified crime index. Since 2004, the FBI has published only a violent crime total and a property crime total.32 How UCR Data Are Collected UCR Participation in the United States. According to the FBI, 17,456 law enforcement agencies in the United States submitted UCR data in 2005, meaning CRS-6 33 The Bureau of Justice Statistics reported that in 2004 there were 17,876 state and local law enforcement agencies in the United States. U.S. Department of Justice, Office of Justice Programs, Bureau of Justice Statistics, Law Enforcement Statistics. Document on file with author, available upon request. 34 About CUIS 2005. 35 UCR Handbook, p. 4. 36 Ibid. that 98%33 of all agencies in the nation participated in the UCR in 2005.34 Currently, 46 states and the District of Columbia submit UCR data through a state UCR program (see Appendix A). In the remaining four states, local law enforcement agencies submit UCR data directly to the FBI. In 25 of the states with a state UCR program, law enforcement agencies are required by the state to
  • 19. submit UCR data to the state program (see Appendix A). State UCR Programs. In order for UCR data to be collected from law enforcement agencies and submitted to the FBI, the state UCR programs must meet certain requirements. The FBI established these requirements to ensure consistency and comparability in the data it receives from state UCR programs.35 The FBI has stated that should circumstances develop whereby a state UCR program does not comply with the requirements, the FBI might bypass the state program and collect UCR data directly from law enforcement agencies in the state.36 The FBI’s requirements for state UCR programs are as follows: ! The state UCR program must conform to national UCR program standards, definitions, and information required. ! The agency responsible for collecting UCR data must have a proven, effective, statewide program, and it must have instituted acceptable quality control procedures. ! The state crime reporting must cover a percentage of the state’s population at least equal to that covered by the national UCR program. ! The state UCR program must have adequate field staff assigned to
  • 20. conduct audits and assist contributing agencies in record- keeping practices and crime-reporting procedures. ! The state UCR program must regularly provide the FBI with all of the detailed data collected from individual law enforcement agencies that report to the state UCR program in the form of duplicate returns, computer printouts, and/or appropriate electronic media. CRS-7 37 Ibid. 38 Ibid. 39 Ibid., p. 3. 40 Ibid. 41 A “clearance” is when a known offense is “solved” through either an arrest or through exceptional means. An offense is cleared through an arrest when at least one person is (1) arrested, (2) charged with the commission of the offense, and (3) turned over to the court for prosecution. In some cases, law enforcement cannot follow the three steps to clear an offense by arrest. In these cases, law enforcement might be able to clear an arrest through exceptional means. An offense is cleared through exceptional means when a law enforcement agency can answer all of the following questions in the affirmative: ! Has the investigation definitively established the identity of
  • 21. the offender? ! Is there enough information to support an arrest, charge, and turning over to the court for prosecution? ! Is the exact location of the offender known so that the subject could be taken into custody now? ! Is there some reason outside the law enforcement control that precludes arresting, charging, and prosecuting the offender? UCR handbook, p. 78- 82. ! The state UCR program must have the proven capability (tested over a period of time) to supply all the statistical data required in time to meet the publication deadlines of the national UCR program.37 The FBI helps state UCR programs meet these requirements by (1) reviewing and editing data submitted by individual agencies; (2) contacting individual agencies within a state when necessary in connection with crime reporting matters; (3) coordinating with the state UCR program to conduct training on law enforcement record-keeping and crime-reporting procedures; (4) sending reporting forms to state UCR programs so they can be distributed to law enforcement agencies within the state; and (5) coordinating individual law enforcement agency contacts with the state
  • 22. UCR program.38 The FBI also makes Quality Assurance Reviews (QARs) available to state UCR programs. QARs are voluntary and part of the FBI’s triennial audit of states’ criminal justice information systems.39 QARs help ensure that each state UCR program adheres to summary and incident-based (see discussion of the NIBRS below) reporting methods that are consistent with UCR standards, thereby increasing uniformity in the data reported.40 UCR Data. The FBI collects data on the number of offenses known to police, the number and characteristics of persons arrested, and the number of “clearances”41 for eight different offenses (see Appendix B), collectively referred to as Part I offenses. Part I offenses include murder and nonnegligent manslaughter, forcible rape, robbery, aggravated assault, burglary, larceny-theft, motor vehicle theft, and arson. The FBI collects data on the number of arrests made for 21 other offenses (see Appendix B), known as Part II offenses. The UCR is a summary system, meaning that offense data submitted to the FBI by local law enforcement agencies show the total number of known Part I offenses. Likewise, UCR arrest data show the total number of persons arrested by reporting law enforcement agencies. Arrest data
  • 23. CRS-8 42 Ibid., p. 96. 43 Ibid., p. 85. 44 About CUIS 2005. 45 Ibid. 46 U.S. Department of Justice, Federal Bureau of Investigation, Law Enforcement Officers Killed or Assaulted, 2005. 47 U.S. Department of Justice, Federal Bureau of Investigation, Hate Crime Statistics, 2005. 48 C.J. Mosher et al., The Mismeasure of Crime, p. 63. submitted to the UCR program by local law enforcement agencies also provide data on the basic characteristics — age, sex, and race — of persons arrested.42 Because the UCR is a summary system, there is no way to determine whether a particular offense was cleared by an arrest, or whether an arrest was made pursuant to a certain offense. In addition to offense and arrest data, the FBI collects supplemental data on the type and value of property stolen and recovered pursuant to reported crimes.43 The FBI asks law enforcement agencies across the country to submit data to the UCR program on the number of sworn officers and civilian law enforcement personnel.44 The FBI, through the UCR’s Supplementary Homicide Report (SHR), collects data on the age, sex, and race of murder victims and offenders; the type of weapon(s) used
  • 24. in the murders; relationships between victims and offenders; and the circumstances surrounding each incident.45 The FBI collects data on incidents in which law enforcement officers are killed, either feloniously or accidently, or assaulted while performing their duties.46 The FBI also collects data on incidents of hate crime in the United States. For each hate crime incident, law enforcement agencies collect data on the offense type, location, bias motivation, victim type, number of offenders, and the apparent race of the offenders.47 Law enforcement agencies submit offense, arrest, clearance, and SHR data monthly. Law enforcement agencies submit data on law enforcement officers killed or assaulted only when an officer has been killed or assaulted. The FBI requires law enforcement agencies to submit hate crime data on a quarterly basis. The FBI collects data on the number of sworn officers and law enforcement personnel annually. The FBI publishes offense, arrest, clearance, SHR, and sworn law enforcement officer data in its annual publication Crime in the United States. Data on law enforcement officers killed or assaulted and on hate crimes are published by the FBI in two separate publications: Law Enforcement Officers Killed or Assaulted and Hate Crime Statistics. Scoring and Classifying UCR Data. All law enforcement agencies
  • 25. participating in the UCR system must classify and score reported crimes. Classifying criminal offenses refers to the process of translating offense titles used in local and state criminal codes into the standard UCR definitions for Part I and Part II offenses.48 Scoring criminal offenses refers to counting the number of offenses after CRS-9 49 Ibid. 50 UCR Handbook, p. 7. 51 Ibid. 52 C.J. Mosher et al., The Mismeasure of Crime, p. 63. 53 UCR Handbook, pp. 15, 41. 54 Ibid. 55 The FBI states that the hierarchy rule applies only to crime reporting and does not affect the number of charges for which a defendant may be prosecuted for in court. UCR Handbook, p. 10. 56 If multiple Part I offenses are committed concurrently with the arson, the hierarchy rule would be applied to the additional Part I offenses and only the most serious offense would be scored along with the arson. Cynthia Barnett-Ryan, “Introduction to the Uniform Crime Reporting Program,” in James P. Lynch and Lynn A. Addington, eds., Understanding Crime Statistics: Revisiting the Divergence of the NCVS and UCR (New York: Cambridge University Press, 2007), p. 65, hereafter “C. Barnett-Ryan, ‘Introduction to the UCR
  • 26. Program.’” 57 Ibid. they have been classified.49 The FBI reminds state and local law enforcement agencies that they must classify and score criminal offenses based on records for calls for service, complaints, and/or investigations.50 According to the FBI, UCR data must reflect offense counts, not the decision of a prosecutor or the findings of a court, coroner, or jury.51 Uniformity in the classification and scoring of criminal offenses across jurisdictions is essential for maintaining the integrity of UCR data.52 In general, reporting law enforcement agencies classify and score attempted crimes as though they were completed.53 For example, an attempt to steal a motor vehicle would be classified and scored as a motor vehicle theft. The only exception to this rule applies to attempted murder, which is classified and scored as aggravated assault.54 The FBI has instituted three rules — the hierarchy, hotel, and separation of time and place rules — that local law enforcement agencies must apply when they are classifying and scoring criminal offenses. The hierarchy rule states that when multiple Part I offenses occur in a single criminal incident, only the most serious offense is scored and reported to the FBI.55 The hierarchy of Part I offenses is provided in Appendix C. For example, if an offender raped and
  • 27. then murdered a victim, the reporting law enforcement agency would score only the murder. However, there are exceptions to the hierarchy rule. The hierarchy rule does not apply to cases of arson, which are always scored and reported to the FBI, even if other Part I offenses are committed during the incident.56 Another exception involves motor vehicle theft. If a motor vehicle is stolen and, by extension, the contents of the vehicle constitute a larceny-theft, only the motor vehicle theft is scored and reported to the FBI, even though larceny-theft ranks higher on the hierarchy of Part I offenses.57 The final exception to the hierarchy rule involves justifiable homicide. In cases of justifiable homicide, two offenses are scored and reported: one for the CRS-10 58 “Unfounded” crimes are crimes that come to the attention of law enforcement but are later found to be false or baseless. 59 Ibid., pp. 65-66. 60 UCR Handbook, p. 62. 61 Ibid. 62 Ibid., p. 12. 63 C. Barnett-Ryan, “Introduction to the UCR Program,” p. 66. 64 UCR Handbook, p. 12. 65 Ibid. 66 Ibid. 67 Ibid, p. 41.
  • 28. felonious offense connected with the offender and one for the justifiable homicide, which is reported as an unfounded58 murder/nonnegilgent manslaughter.59 The hotel rule applies only to burglary offenses. In cases where multiple dwelling units under a single manager are burglarized and the offenses are more likely to be reported to the police by the manager rather than the individual occupants, the burglaries are scored as one offense.60 The hotel rule usually applies to burglaries of hotels, motels, lodging houses, or other places where the lodging of transients is the main purpose. The hotel rule would not apply in instances where multiple units that were leased or rented to tennants were burglarized, such as apartments or offices in a business building.61 For example, if five hotel rooms were burglarized, it would be scored as one burglary, but if five apartments were burglarized, it would be scored as five burglaries. The separation of time and place rule applies in instances where the same offender commits multiple offenses over a short period of time in different locations.62 In such cases, the reporting agency treats the offenses as separate events and classifies and scores them accordingly (i.e., applies the hierarchy and/or hotel rule).63 According to the FBI, the “same time and place” means that the time interval
  • 29. between the offenses and the distance between the locations where they occurred are insignificant.64 Normally, the offenses must have occurred during an unbroken period of time and at the same or adjoining location(s).65 However, the time and place rule does not apply in instances where offenses, even if they are committed at different times and places, are a part of continuing criminal activity committed by the same offender(s), and an investigation deems the activity to constitute a single criminal transaction.66 When scoring offenses, the UCR program distinguishes between crimes against persons (i.e., homicide/nonnegligent manslaughter, rape, and aggravated assault) and crimes against property (i.e., robbery, burglary, larceny-theft, motor vehicle theft, and arson).67 For crimes against persons, one offense is counted for each victim in the CRS-11 68 Ibid. 69 Ibid. 70 Ibid., p. 96. 71 Ibid., p. 97. 72 Ibid. 73 Ibid. 74 Ibid. criminal incident.68 For example, if a gunman shot and killed
  • 30. three people, the reporting agency would report three homicides. For crimes against property, one offense is counted for each distinct operation or attempt in a criminal incident, with the exception of motor vehicle theft, in which case one offense is counted for each stolen vehicle and one offense for each attempt to steal a motor vehicle in a criminal incident.69 For example, if someone walked into a store, pulled a gun, and robbed five customers, it would be scored as one robbery. In instances where multiple Part I offenses are committed against multiple victims in the same criminal incident, the hierarchy rule is applied first, and then crimes are scored based on whether they were crimes against persons or crimes against property. For example, if an assailant robbed one person and murdered someone who tried to break up the robbery, only the murder would be scored, even though two crimes were committed against two different people in the same criminal incident. In addition to classifying and scoring offense data, law enforcement agencies must classify and score arrest data. In many ways, arrests are classified and scored similar to the way offenses are classified and scored. Arrest data submitted to the FBI reflect the number of people arrested, not the number of charges lodged.70 For example, if one person is arrested for multiple crimes, the reporting law enforcement agency reports one arrest. However, if one person is arrested
  • 31. multiple times, and there is a separation of time and space between the arrests, each arrest is recorded separately. If a person is arrested for multiple charges, the reporting agency must use only one crime classification when reporting the arrest.71 Thus, if a person is arrested for both Part I and Part II offenses, the reporting agency ignores the Part II offenses and scores only the most serious Part I crime (see Appendix C) for which the person was arrested. If a person is arrested for Part II offenses, the reporting agency must determine which is the most serious offense and score an arrest only for that offense.72 If multiple people are arrested for the same crime, each person is counted as a separate arrest.73 If a reporting agency determines that someone in custody has committed other crimes, the agency does not report additional arrests; it reports only the original arrest.74 Development of the NIBRS The data collected and disseminated by the UCR remained largely unchanged over time (i.e., since the beginning of the UCR system in 1929). Starting in the 1970s, consensus grew in the law enforcement community that the UCR needed to be updated to provide more in-depth data to meet the needs of law enforcement into
  • 32. CRS-12 75 SEARCH, Cost Issues of Implementing the National-Incident Based Reporting System in Local Law Enforcement Agencies, May 1997, hereafter “SEARCH, ‘Cost Issues of Implementing NIBRS.’” 76 C. Barnett-Ryan, “Introduction to the UCR Program,” p. 81. 77 U.S. Department of Justice, Federal Bureau of Investigation, Crime in the United States 2005: About the UCR Program, September 2006, hereafter, “About the UCR Program 2005.” 78 Ibid. 79 The Blueprint initially proposed that only a small sample of law enforcement agencies nationwide (3%-7%) would report comprehensive incident- based statistics. The remaining law enforcement agencies would report incident-based data but in a much more abbreviated format, focusing only on Part I UCR offenses, with a limited range of victim, offender, and incident data. All law enforcement agencies would collect and submit arrest data, with linkages to cleared offenses. U.S. Department of Justice, Office of Justice Programs, Bureau of Justice Statistics, Implementing the National Incident-Based Reporting System: A Project Status Report, NCJ 165581, July 1997, p. 5, hereafter “BJS, ‘Implementing NIBRS Status Report.’” 80 Ibid. 81 U.S. Department of Justice, Federal Bureau of Investigation, National Incident-Based Reporting System, Volume 1: Data Collection Guidelines, August 2000, p. 1, hereafter
  • 33. “NIBRS Data Collection Guidelines.” 82 Ibid. 83 Ibid., p. 2. the 21st century.75 In response, the FBI, through the Bureau of Justice Statistics (BJS), contracted for a phased study of the UCR program, which culminated with recommendations on how it could be improved.76 The study’s final report, Blueprint for the Future of the Uniform Crime Reporting Program (Blueprint), was released in May 1985, and it outlined three areas where the UCR could be enhanced to meet the future needs of law enforcement.77 The study recommended that law enforcement agencies use an incident-based system to report offenses and arrests.78 It also recommended that some law enforcement agencies submit incident-based data for all of their known offenses and all arrests (i.e., full participation), while other law enforcement agencies submit only a more limited range of incident-based data for certain crimes (i.e., limited participation).79 The study also recommended that the national UCR program implement a quality assurance program.80 Based on the recommendation outlined in the Blueprint, the FBI developed guidelines and design specifications for what would later become the National Incident-Based Reporting System (NIBRS).81 The FBI chose the South Carolina Law Enforcement Division (SLED) to conduct a pilot study of the
  • 34. newly developed NIBRS guidelines and design specifications.82 SLED adapted its existing incident- based UCR system to meet NIBRS specifications, and it enlisted the assistance of nine local law enforcement agencies in the state to participate in the pilot study.83 CRS-13 84 Ibid. 85 Ibid. 86 Ibid. 87 Ibid. 88 About the UCR Program 2005. 89 C. Barnett-Ryan, “Introduction to the UCR Program,” p. 82. 90 An incident is defined for NIBRS reporting purposes as one or more offenses committed by the same offender, or group of offenders “acting in concert,” at the “same time and place.” “Acting in concert” requires that the offenders actually commit or assist in the commission of the crime(s). The offenders must be aware of and consent to the commission of the crime(s) or even if nonconsenting, their actions assist in the commission of the offense(s). As it is under the UCR system, for the purposes of NIBRS reporting, “same time and place” means that the time interval between the offenses and the distance between locations where they occurred are insignificant. Normally, the offenses must have occurred during an unbroken period of time and at the same or adjoining location(s). However, the
  • 35. time and place rule does not apply in instances where offenses, even if they are committed at different time and places, are a part of continuing criminal activity committed by the same offender(s), and an investigation deems the activity to constitute a single criminal transaction. NIBRS Data Collection Guidelines, pp.16-17. 91 Ibid., p. 5. The pilot study ran from March 1 to September 30, 1987, and it resulted in further refinement of NIBRS’s guidelines and specifications.84 The FBI presented the NIBRS to law enforcement at a national UCR conference in March 1988.85 The conference gave the FBI the opportunity to receive feedback on the NIBRS from the law enforcement community.86 According to the FBI, conference attendees overwhelmingly supported implementation of the NIBRS nationwide.87 Attendees passed three overall recommendations: (1) that there be established a new, incident-based national crime reporting system; (2) that the FBI manage the program; and (3) that an advisory policy board composed of law enforcement executives be formed to help direct and implement the new program.88 The law enforcement community rejected the Blueprint’s proposal to have both full and limited participating law enforcement agencies, and endorsed implementing the full version of the NIBRS nationwide.89
  • 36. The NIBRS Compared with the UCR NIBRS Data. As discussed above, under the UCR, local law enforcement agencies tally the number of known offenses for each Part I offense, as well as arrest data for both Part I and Part II offenses, and submit aggregate counts on a monthly basis to the FBI. Under the NIBRS, data are not aggregated; rather, data for each criminal incident90 are submitted to the FBI in a separate report.91 For each criminal incident, participating law enforcement agencies collect data on 53 different data elements, including data on the offense(s), the offender(s), the victim(s), the CRS-14 92 C.J. Mosher et al., The Mismeasure of Crime, p. 70. 93 Michael G. Maxfield, “The National Incident-Based Reporting System: Research and Policy Applications,” Journal of Quantitative Criminology, vol. 15, no. 2 (1999), p. 123. 94 SEARCH, “Cost Issues of Implementing NIBRS,” p. 1. 95 Ibid. 96 NIBRS Data Collection Guidelines, p. 5. 97 Ibid., p. 8. 98 C. Barnett-Ryan, “Introduction to the UCR Program,” p. 62. 99 BJS, Implementing NIBRS Status Report, p. 7. arrestee(s), and any property involved in the offense.92 The data elements are combined into six different data segments (see Appendices D
  • 37. and E). The NIBRS allows for data on multiple offenses, offenders, and victims to be collected for each criminal incident.93 NIBRS data are intended to be a by-product of local incident- based reporting (IBR) systems.94 Therefore, local and state law enforcement agencies can develop their own IBR systems to suit their local needs, and they can use the data from their own IBR systems to participate in the NIBRS, as long as the data submitted to the FBI meets NIBRS specifications. State and local law enforcement agencies can add additional data elements or data values to their systems.95 The NIBRS does not use the UCR’s Part I and Part II offense classifications. Instead, offenses are classified as being either a Group A or Group B offense (see Appendix F). Group A contains 46 different offenses grouped into 22 offense categories. Group B contains 11 different offenses. Law enforcement agencies are required to submit incident reports, which contain data from all six data segments, for all Group A offenses.96 For Group B offenses, law enforcement agencies are required to submit only arrest reports, which contain data only from the arrestee data segment.97 The expanded list of crimes required the FBI to create definitions for crimes counted only in the NIBRS and to modify definitions for crimes that are a part of the UCR.98 For example, the FBI expanded the definition of
  • 38. rape to include rapes of both women and men. Under the UCR, rapes are defined as being committed against women only. NIBRS Certification. Before a state can submit NIBRS data to the FBI, the state NIBRS program must be certified by the FBI.99 The FBI has developed a state certification policy, which uses the following criteria to evaluate the NIBRS data submitted by a state: ! Error rate — before a state can submit NIBRS data, the FBI requires that fewer than 4% of the incident reports submitted by the state contain errors for three consecutive months. CRS-15 100 Ibid. 101 Ibid. 102 Ibid. 103 NIBRS Data Collection Guidelines, p. 4. 104 Ibid. 105 Ibid. 106 Ibid. 107 Ibid. ! Statistical reasonableness — before a state can submit NIBRS data, the FBI evaluates the reasonableness of the data based on analyses of trends, volumes, and monthly fluctuations.
  • 39. ! Updating capability and responsiveness — the FBI requires the state program to have ample ability to update its records, meet deadlines, and respond in a timely manner to error messages from the national program. ! System appropriateness — the FBI requires a state’s NIBRS program to be systematically compatible with the NIBRS data reporting requirements and guidelines.100 Simply because a state’s IBR program is certified as NIBRS- compliant does not necessarily mean that every law enforcement agency in the state is reporting NIBRS- compliant data.101 If a state’s program is certified by the FBI, it means that the state program is capable of processing NIBRS data at the state level and submitting virtually error-free data to the FBI in an acceptable format.102 If a state program is certified as NIBRS-compliant, local law enforcement agencies within the state must submit their NIBRS data through the state program.103 If a state does not have a certified state program, the FBI will consider allowing local law enforcement agencies with NIBRS-compliant IBR systems to submit data directly to the FBI, if the agency serves a population of over 100,000.104 The FBI coordinates decisions regarding such requests with the appropriate state UCR
  • 40. program. If a local law enforcement agency in a state without a state UCR program wants to submit NIBRS data directly to the FBI, it will consider such a request if the agency has a NIBRS-compliant IBR system.105 The FBI reported that the number of local law enforcement agencies in states without UCR programs allowed to submit NIBRS data directly to the FBI is limited by the availability of resources at the FBI.106 When a local law enforcement agency is allowed to submit NIBRS data directly to the FBI, the agency must sign an agreement stating that it will discontinue direct reporting to the FBI when the state has a certified program.107 Classifying and Scoring NIBRS Data. Like the UCR program, law enforcement agencies participating in the NIBRS have to classify and score offenses. However, the NIBRS does not use the hierarchy rule discussed previously because CRS-16 108 Ibid., p. 13. 109 Ibid., p. 15. 110 Ibid., pp.16-17. 111 Ibid., p. 14. 112 Ibid. law enforcement agencies can report all of the offenses that occurred in a criminal
  • 41. incident.108 The FBI expanded the definition of the hotel rule under NIBRS to apply to rental storage facilities (i.e., mini-storage and self-storage buildings).109 For example, 10 storage units burglarized in one self-storage building would be counted as one burglary offense. However, NIBRS data reporting allows law enforcement agencies to report how many premises were entered (see Appendix D, data element 10 under the Offense segment). Using the same example, the break-ins at the storage facility would be reported as one burglary, even though the law enforcement agency would include data in the incident report indicating that 10 premises were entered. The separation of time and place rule still applies when classifying and scoring offenses under the NIBRS.110 Law enforcement agencies have to use the separation of time and place rule to determine whether a group of offenses should be reported as individual incidents, or whether the offenses should be reported as one incident where multiple offenses occurred. Like the UCR program, the NIBRS also distinguishes between crimes against persons and crimes against property. Crimes against persons and crimes against property are scored the same way for NIBRS reporting as they are for UCR reporting. However, because NIBRS Group A offenses include offenses
  • 42. that cannot be classified as crimes against persons (because they do not involve an actual victim) or classified as crimes against property (because property is not the object of the crime), the NIBRS includes another scoring category — crimes against society.111 For NIBRS reporting, crimes against society include drug/narcotics offenses, gambling offenses, pornography/obscene materials, and prostitution offenses (see Appendix F). Reporting law enforcement agencies score one offense for each crime against society in an incident.112 Advantages of the NIBRS. Because of the expanded amount of data collected in NIBRS reporting, the NIBRS has several advantages compared with the traditional UCR system. In addition to those described above, advantages of the NIBRS include the following: ! Data collection is not restricted to a limited number of offense categories (i.e., Part I offenses). ! Offense definitions can meet state, local, and national reporting needs. CRS-17 113 Justice Research and Statistics Association, IBR Resource
  • 43. Center, Advantages of Incident-Based Reporting Over Summary Reporting. Document on file with author, available upon request. 114 Justice Research and Statistics Association, IBR Resource Center, Status of NIBRS in the States, document on file with author, available upon request. ! Details on individual crime incidents (offenses, offenders, victims, property, and arrests) can be collected and analyzed. ! Arrests and clearances can be linked to specific incidents and offenses. ! Distinctions can be made between attempted and completed crimes. ! Linkages can be established between variables for examining interrelationships between offenses, offenders, victims, property, and arrestees. ! Detailed crime analyses can be made within and across law enforcement jurisdictions. ! Strategic and tactical crime analyses can be made at the local and regional levels.113 Transition to the NIBRS According to the Justice Research and Statistics Association’s IBR Resource Center, approximately 22% of the nation’s population is covered by law enforcement
  • 44. agencies that report NIBRS-compliant data and 17% of reported crime is reported through the NIBRS program.114 As of August 2007, and as shown in Appendix A, 31 states had been certified by the FBI to submit NIBRS data. In addition, the FBI accepts NIBRS data directly from agencies in Alabama, Illinois, Kentucky, and the District of Columbia, even though each state does not have an FBI-certified NIBRS program. In 11 states (35% of all certified states), all law enforcement agencies in the state collect and submit NIBRS-compliant data. In another 10 states (32% of all certified states), between 50%-99% of law enforcement agencies in the state collect and submit NIBRS-compliant data. Limitations of UCR and NIBRS Data Limited Offense Data. As discussed above, the UCR collects offense data on a limited number of crimes (Part I crimes), which means that offense data are available only for a small number of all crimes committed in the United States. Offense data are not available for Part II crimes, which tend to be committed at a greater frequency than Part I crimes. Currently, the UCR does not collect data on crimes commonly covered by the media, such as kidnapping, bribery, or child pornography. The FBI is trying to address this gap by implementing the NIBRS, but as discussed above, many jurisdictions have yet to make the switch from the UCR to
  • 45. CRS-18 115 C.J. Mosher et al., The Mismeasure of Crime, p. 86. 116 Ibid. 117 2005 NCVS data showed that 57.4% of all crimes, 51.3% of personal crimes, 50.7% of crimes of violence, and 59.3% of property crimes were not reported to police. U.S. Department of Justice, Office of Justice Programs, Bureau of Justice Statistics, Criminal Victimization in the United States, 2005 Statistical Tables, National Crime Victimization Survey, Table 91, NCJ 215244, December 2006, p. 107. 118 C.J. Mosher et al., The Mismeasure of Crime, p. 84. 119 David Seidman and Michael Couzens, “Getting the Crime Rate Down: Political Pressures and Crime Reporting,” Law and Society Review, vol. 8 (1973- 1974), p. 457; Larry J. Siegel, Criminology (9th ed.) (Belmont, CA: Thompson and Wadsworth, 2006), p. 35, hereafter, “L.J. Seigel, Criminology”; C.J. Mosher et al., The Mismeasure of Crime, pp. 91-93. 120 L.J. Siegel, Criminology, p. 35. 121 Ibid. the NIBRS. Neither the UCR nor the NIBRS collect data on political crimes, price- fixing and illegal environmental pollution.115 Moreover, the UCR and the NIBRS most likely undercount corporate and occupational crimes.116 Unreported Crimes. As discussed above, both the UCR and the NIBRS
  • 46. collect data on the number of offenses known to law enforcement each year. However, not all crimes that occur are known to the police. In some cases, the victim(s) of or witness(es) to a crime might not report the incident to the police.117 Researchers have reported that a majority of crimes become known to the police only after they are reported by either the victims or citizens who witnessed the crime.118 If crimes are not reported to law enforcement, both the UCR and NIBRS will undercount the actual amount of crime that occurred. Reporting Practices of Law Enforcement. Evidence shows that UCR data may be affected by the reporting practices of local law enforcement. In some instances, law enforcement officials, usually because of political pressure to lower the crime rates, might manipulate crime reports to decrease the amount of reported crime.119 In other instances, the number of reported offenses might be a product of how assiduously local law enforcement follow the FBI’s definitions for crimes under the UCR or the NIBRS.120 For example, if a local law enforcement agency does not closely follow UCR or NIBRS definitions, the agency might classify an assault against a woman as an attempted rape, or a trespass as a burglary. Ironically, the number of reported offenses might increase as local law enforcement agencies
  • 47. become more efficient.121 If a law enforcement agency puts more officers on patrol, the number of known offenses might increase because there are more officers to catch offenders. If law enforcement agencies work to develop a better relationship with the citizens they serve, the reported number of offenses could increase because citizens might report more crimes. The number of reported offenses might also increase as law enforcement agencies develop better record- keeping systems and as CRS-19 122 Ibid. 123 C.J. Mosher et al., The Mismeasure of Crime, p. 88. 124 C. Barnett-Ryan, “Introduction to the UCR Program,” p. 69. 125 Ibid. 126 Ibid. 127 Michael D. Maltz, Analysis of Missingness in UCR Crime Data, U.S. Department of Justice, Office of Justice Programs, August 2006, p. 11. 128 Ibid., p. 12. 129 The FBI converts all NIBRS data into summary UCR data for publication in Crime in the United States. If a law enforcement agency reports NIBRS data and does not report any data for the year, or if it reports data only for part of the year, the FBI converts the reported data, if any, to summary UCR data. The FBI then applies the imputation procedures used for summary UCR data to estimate the agency’s crime rate for the full year.
  • 48. they assign more employees to do dispatching, record keeping, and criminal incident reporting.122 Missing Data. Federal law does not require local law enforcement agencies to submit offense data to the UCR program. Although participation in the UCR program has been above 90% since the 1970s, not all law enforcement agencies in the country submit UCR data to the FBI.123 Also, law enforcement agencies are not required to submit a full year of UCR data to the FBI.124 In some instances, a local law enforcement agency will submit only a few months’ worth of data, or will fall shy of the full 12 months by 1 or 2 months.125 In other instances, a local law enforcement agency will submit offense data but will not submit any of the other data (e.g., the supplementary homicide report data or the hate crime data; see discussion above).126 One researcher found that missing data are not equally distributed among all law enforcement agencies in the country. The researcher reported that, for the years 1960-2003, law enforcement agencies serving populations under 2,500 people and university and college law enforcement agencies are more likely to have missing data than law enforcement agencies that serve populations over 2,500 people.127 In general, the larger the population the law enforcement agency
  • 49. served, the less likely the agency was to have missing data. The analysis showed that law enforcement agencies that served 250,000 or more people did not have missing data for the years 1960-2003.128 Imputation Procedures. If a law enforcement agency does not report UCR data to the FBI for the entire year, the FBI uses imputation techniques to estimate the law enforcement agency’s number of reported crimes for the entire year.129 The methodology differs depending on the number of months for which crime data were reported. If the law enforcement agency has submitted three or more months of data, the FBI estimates the total annual number of crimes for the jurisdiction by multiplying the reported number of crimes by a weight equal to “12/N,” where “N” CRS-20 130 M.D. Maltz, Bridging Gaps in Police Crime Data, p. 23; C. Barnett-Ryan, “Introduction to the UCR Program,” p. 70. 131 MSA is a designated area consisting of a principal city of at least 50,000 people and the surrounding counties that have strong economic ties. 132 The FBI classifies each law enforcement agency into one of eight population groups. The population groups are as follows: I (250,000 inhabitants or more); II (100,000-249,999
  • 50. inhabitants); III (50,000-99,999 inhabitants); IV (25,000-49,999 inhabitants); V (10,000- 24,999 inhabitants); VI (less than 10,000 inhabitants; includes universities and colleges to which no population is attributed); VIII (Nonmetropolitan county; includes state police to which no population is attributed); and IX (Metropolitan county; includes state police to which no population is attributed). About CUIS 2005. 133 The FBI attempts to collect data from core cities for the full year in order to avoid estimating crime data for the city. C. Barnett-Ryan, “Introduction to the UCR Program,” p. 70. 134 Ibid. 135 Geographic divisions are as follows: Pacific (AK, HI, WA, OR, and CA); Mountain (MT, UT, ID, AZ, NM, NV, WY, and CO); West North Central (ND, SD, MN, NE, KS, IA, and MO); West South Central (OK, TX, AR, and LA); East North Central (WI, MI, IL, IN, and OH); East South Central (KY, TN, AL, and MS); South Atlantic (DE, MD, WV, VA, NC, SC, GA, and FL); Middle Atlantic (NY, PA, and NJ); and New England (CT, RI, MA, VT, NH, and ME). About CUIS 2005. 136 The geographic regions are as follows: West (AK, HI, WA, OR, CA, MT, UT, ID, AZ, NM, NV, WY, and CO); South (OK, TX, AR, LA, KY, TN, AL, MS, DE, MD, WV, VA, NC, SC, GA, and FL); Midwest (ND, SD, MN, NE, KS, IA, MO, WI, MI, IL, IN, and OH); and Northeast (NY, PA, NJ, CT, RI, MA, VT, NH, and ME). About CUIS 2005. 137 C. Barnett-Ryan, “Introduction to the UCR Program,” p. 71.
  • 51. equals the number of months of data submitted by the law enforcement agency.130 For law enforcement agencies that have submitted less than three months of data (“non-reporting agencies”), the missing data are estimated based on the reported number of crimes from other similar agencies based on population. For core cities in a Metropolitan Statistical Area (MSA),131 the crime rate is estimated by applying the crime rate for all other law enforcement agencies in the agency’s population group132 to the agency’s population.133 For example, if a law enforcement agency served a city of 80,000 people and the murder rate for all other MSA core cities in its population group was 10 per 100,000, then the estimated number of murders for the city would be 8 (calculated as 80,000x10.0/100,000). The crime rates for the remaining agencies are estimated using the state rate for the agency’s population group from the current year.134 In absence of a state rate, the FBI will apply the division135 or region136 rate. Agency-level estimates are always aggregated into larger geographic areas, such as MSAs, state, geographic division, region, and the nation.137 Researchers have stated that the imputation methods used by the FBI to estimate crime in jurisdictions that have not reported for the full year or non-reporting jurisdictions make questionable assumptions. The imputation method used by the
  • 52. FBI to estimate a full year’s worth of data for jurisdictions that report three or more months of data implicitly assumes that the crime rate for non- reported months is the CRS-21 138 C.J. Mosher et al., The Mismeasure of Crime, p. 89. 139 Ibid., p. 90. 140 U.S. Department of Justice, The Nation’s Two Crime Measures, NCJ 122705, October 2004, p. 1, hereafter “U.S. DOJ, The Nation’s Two Crime Measures.” 141 National Archive of Criminal Justice Data, National Crime Victimization Survey Resource Guide. Document on file with author, available upon request. 142 Callie Marie Rennison and Michael Rand, “Introduction to the National Crime Victimization Survey,” in James P. Lynch and Lynn A. Addington, eds., Understanding Crime Statistics: Revisiting the Divergence of the NCVS and UCR (New York: Cambridge University Press, 2007), p. 19, hereafter “C.M. Rennison and M. Rand, ‘Introduction to the NCVS.’” 143 Ibid., p. 18. 144 Ibid. 145 The Commission found four limitations associated with UCR data that prevented it from addressing the needs of the Commission. The Commission found that UCR data (continued...)
  • 53. same as for reported months.138 If the crime rates in the months for which data were not reported differ from the rates in the months for which data were reported, then the imputation procedure could either overestimate or underestimate the jurisdiction’s annual crime rate. The imputation procedure used to estimate the crime rate for non-reporting jurisdictions assumes that cities and towns with similar sized populations are also similar in other factors that might affect the city or town’s crime rate, such as income distribution, unemployment rates, population density, and racial composition.139 National Crime Victimization Survey The National Crime Victimization Survey (NCVS) is the primary source for information on the characteristics of criminal victimization and on the number and types of crime not reported to law enforcement.140 The NCVS has four major objectives: (1) developing detailed information about the victims and consequences of crime, (2) estimating the number and types of crimes not reported to police, (3) providing uniform measures of selected types of crimes, and (4) permitting comparisons over time and population types (e.g., urban, suburban, and rural).141 NCVS’s History
  • 54. The NCVS began as a way to supplement UCR data.142 In 1965, President Lyndon Johnson convened the President’s Commission on Law Enforcement and the Administration of Justice (hereafter referred to as “the Commission”).143 The Commission was charged with examining the causes and characteristics of crime in the United States and formulating recommendations for polices and programs that could address crime in the country.144 At the time, the UCR was the only source for official crime data, and the Commission found that several limitations145 associated CRS-22 145 (...continued) ! reflected only crimes known to law enforcement; ! reflected law enforcement activity and not necessarily actual crime trends; ! were open to possible manipulation and misrepresentation that could threaten their validity; and ! lacked important information about the criminal incident, including details about the characteristics of offenders, offenses, and victims. (Ibid., pp. 18-19.) 146 Ibid. 147 Ibid., p. 19.
  • 55. 148 C.J. Mosher et al., The Mismeasure of Crime, p. 54. 149 Ibid. 150 Ibid. 151 Ibid., pp. 54-55. 152 Ibid., p. 55. 153 Ibid. 154 Ibid. with the data prevented it from helping the Commission develop policy recommendations.146 To help rectify some of the limitations associated with UCR data, the Commission recommended the creation of a national survey of crime victimization.147 The first crime victimization survey pilot study was conducted in three Washington, D.C., police precincts in the spring of 1966.148 The survey asked 511 Washington, D.C., residents, chosen from a probability sample of homes, whether they had been a victim of one or more of a list of crimes.149 The Washington, D.C., pilot study demonstrated that household surveys could provide a different picture of crime than the one derived from UCR data. The study showed that, depending on the type of crime, there were 3 to 10 times as many criminal incidents reported by victims than there were recorded in UCR data.150 A supplementary study was conducted in three cities: Boston, Chicago, and Washington, D.C. The second study surveyed businesses and organizations in
  • 56. selected high-crime areas of all three cities about criminal victimizations they had experienced.151 The supplementary study also surveyed residents of Chicago and Boston about their household’s criminal victimizations.152 Like the Washington, D.C., pilot study, the supplementary study found that the number of reported victimizations exceeded the number of reported crimes.153 A third victimization survey sponsored by the Commission was conducted by the National Opinion Research Center (NORC).154 NORC’s victimization survey differed from the two previous surveys in that it involved a national sample, not just a sample of local households and businesses. NORC’s victimization survey CRS-23 155 Ibid. 156 Ibid. 157 Ibid. 158 Ibid. 159 David Cantor and James P. Lynch, “Self-Report Surveys as Measures of Crime and Criminal Victimization,” in U.S. Department of Justice, Office of Justice Programs, National Institute of Justice, Criminal Justice 2000, Volume 4, NCJ 182411, July 2000, p. 105, hereafter “D. Cantor and J.P. Lynch, ‘Self-Report Surveys as Measures of Crime and Criminal Victimization.’”
  • 57. 160 C.M. Rennison and M. Rand, “Introduction to the NCVS,” p. 20. 161 Ibid. 162 The LEAA was the predecessor to the Office of Justice Programs. 163 C.M. Rennison and M. Rand, “Introduction to the NCVS,” p. 20. 164 D. Cantor and J.P. Lynch, “Self-Report Surveys as Measures of Crime and Criminal Victimization,” p. 105. 165 Ibid. interviewed one person in each of 10,000 households nationwide.155 Like the two previous pilot studies, NORC’s survey found that more crime was being committed than was being reported to law enforcement.156 Unlike the other two studies, NORC’s survey collected data on which crimes were not reported to the police and on the respondent’s reason for not reporting the crime. Non- reporting was found to vary by offense. For example, the study found that 90% of consumer frauds were not reported, but 11% of motor vehicle thefts were unreported.157 NORC found that most people who chose not to report a crime to the police did so because they either thought the incident was a private matter or did not think the police could do anything about it.158 The three pilot studies indicated that UCR data underestimated the true level of crime in the United States. Moreover, the studies showed that a household survey
  • 58. could help estimate the extent of unreported crime, also known as the “dark figure of crime.”159 They also demonstrated that a household survey was a reasonable method for estimating the number of criminal victimizations in the United States.160 The Commission recommended that a national criminal justice statistics center be established to collect victimization data on an ongoing basis.161 In 1968, the Law Enforcement Assistance Administration (LEAA)162 was created and charged with implementing a national victimization survey.163 In the early 1970s, LEAA, in cooperation with the Census Bureau, worked to develop a national victimization survey, which would come to be known as the National Crime Survey (NCS). The pilot studies for the NCS demonstrated that a large national sample of households would be required to obtain an accurate estimate of some crimes.164 The Census Bureau was chosen to conduct the NCS because it was the only organization that had the capacity to field such a large survey.165 During the development of the NCS, the survey’s methodology was refined based on some CRS-24 166 Ibid. 167 Record-check experiments involve comparing police
  • 59. records to reported victimizations to determine whether crimes are being reported and, if so, how frequently they are being reported. 168 Ibid. 169 C.M. Rennison and M. Rand, “Introduction to the NCVS,” pp. 20-21. 170 D. Cantor and J.P. Lynch, “Self-Report Surveys as Measures of Crime and Criminal Victimization,” p. 106. 171 Ibid. 172 Ibid. 173 U.S. Department of Commerce, Bureau of the Census, National Crime Victimization Survey: Interviewing Manual for Field Representatives, February 2003, p. A1-5, hereafter “Census Bureau, NCVS Interviewing Manual.” 174 Data collected from a nationwide sample of households in central cities were designed to estimate the level and change of victimization for a selected set of crime committed against residents of major cities in the United States. The surveys were designed to obtain benchmark estimates of crime in cities, which could then be updated in subsequent enumerations for each city. For example, in 1972 and 1975, approximately 12,000 households in eight different cities (Atlanta, Baltimore, Cleveland, Dallas, Denver, Newark (continued...) of the lessons learned from the three pilot studies.166 There were a series of pretests, trial surveys, and record-check experiments167 to help address some of the
  • 60. methodological issues associated with implementing a nationwide victimization survey.168 Some of the issues examined included ! the use of a single household respondent, as opposed to interviewing everyone in the household; ! the respondent’s ability to recall events; ! the length of the reference period; ! the minimum age of the respondent; and ! the appropriate question cues and wording.169 As a result of the studies, the NCS chose to interview all members of the household about victimizations they experienced.170 It was decided that the NCS would use a six-month reference period.171 It was also decided that only one person (referred to as a “household respondent”) would answer questions about crimes against household property.172 The first NCS was conducted in July 1972 by the Census Bureau.173 The NCS was originally composed of four interrelated surveys: a national sample of households, referred to as the “Crime Panel”; a sample of households from central cities;174 and a national and central city sample of commercial establishments.175 As
  • 61. CRS-25 174 (...continued) [NJ], Portland [OR], and St. Louis) were surveyed. The central city household survey was also fielded in the five largest cities in 1973 and 1975. An additional 13 cities received the survey once in 1974. C.M. Rennison and M. Rand, “Introduction to the NCVS,” p. 21. 175 The national survey of commercial establishments was conducted once in 1972. The survey of commercial establishments was conducted concurrently with the central city household survey. Both surveys collected data on robbery and burglary victimizations of commercial establishments. Ibid. 176 D. Cantor and J.P. Lynch, “Self-Report Surveys as Measures of Crime and Criminal Victimization,” p. 108. 177 C.M. Rennison and M. Rand, “Introduction to the NCVS,” p. 33. 178 Charles Kindermann, James Lynch, and David Cantor, Effects of the Redesign on Victimization Estimates, NCJ 164381, April 1997, U.S. Department of Justice, Office of Justice Programs, Bureau of Justice Statistics, p. 1, hereafter, “C. Kindermann et al., Effects of the Redesign on Victimization Estimates.” 179 U.S. Department of Justice, Office of Justice Programs, Bureau of Justice Statistics, National Crime Victimization Survey: Questions and Answers about the Redesign, NCJ 151171, October 1994, p. 4, hereafter “BJS, Questions and Answers about the Redesign.”
  • 62. of 1976, data were no longer collected for the sample of households from central cities, nor were data collected for the national and central city sample of commercial establishments. Since 1976, the NCS consisted only of the national sample of households (i.e., the Crime Panel). In the mid-1970s, in response to concerns about the quality and usefulness of NCS data, the LEAA asked the National Academy of Sciences (NAS) to evaluate the NCS.176 In 1976, the NAS published a report that provided recommendations for how to improve the NCS.177 The NAS found that although the NCS was an effective instrument for measuring crime, certain aspects of the survey’s methodology and scope could be improved.178 The NAS recommended that researchers investigate the following: ! Enhanced screening questions that would better stimulate respondents’ recall of victimizations, thus reducing underreporting resulting from forgotten incidents. ! Screening questions that would sharpen the concepts of criminal victimization and diminish the effects of subjective interpretations of the survey questions. ! Additional questions on the nature and consequences of victimizations that would yield useful data for analysis.
  • 63. ! Enhanced questions and inquiries about domestic violence, rape, and sexual attack to get better estimates of these victimizations.179 The Bureau of Justice Statistics (BJS) sponsored a research consortium that investigated the issues raised in the NAS review and provided recommendations that CRS-26 180 Ibid. 181 David Cantor and James P. Lynch, “Exploring the Effects of Changes in Design on the Analytical Uses of the NCVS Data,” Journal of Quantitative Criminology, vol. 21, no. 3 (2005), p. 295. 182 BJS, Questions and Answers about the Redesign, p. 4. 183 Ibid. 184 Census Bureau, NCVS Interviewing Manual, p. A1-6. 185 Ibid. 186 Ibid. 187 Ibid. would improve the accuracy and utility of the NCS.180 In 1986, the consortium proposed new instrumentation and procedures to improve the NCS.181 BJS chose to implement the consortium’s proposals and redesign the NCS. BJS stated that the overall objectives for redesigning the NCS were to increase reporting of crime victimization and provide additional details on
  • 64. individual crime incidents.182 BJS also had more specific objectives for the redesign, including ! developing improved screening questions, thereby stimulating recall of incidents; ! sharpening concepts of victimization for survey respondents by providing a more thorough description of criminal incidents, thus diminishing effects of cognitive and subcultural differences among respondents; ! improving data collection techniques by adopting Computer- Assisted Telephone Interviewing (CATI) for some segments of survey participants; ! improving measures of rape and sexual attack by asking respondents directly about these crimes; and ! providing better measures of domestic violence.183 The recommended changes were phased in as part of a two stage process: near- term and long-term.184 The near-term changes focused on the NCS’s procedures and questionnaires, but they were not substantial enough to affect the comparability of the crime rates for previous years (i.e., they were non-rate affecting changes).185 The near-term changes were implemented by the Census Bureau in
  • 65. July 1986.186 Long- term changes had a substantial impact on the crime rate reported by the NCS.187 The long-term changes to the NCS’s design were phased in gradually. Starting in 1989, BJS and the Census Bureau pre-tested the long-term changes using 5% and 10% CRS-27 188 C.M. Rennison and M. Rand, “Introduction to the NCVS,” p. 37. 189 Ibid. 190 Census Bureau, NCVS Interviewing Manual, pp. A1-6 to A1-7. 191 C. Kindermann et al., Effects of the Redesign on Victimization Estimates, p. 2. 192 Ibid. 193 Ibid. 194 BJS reported that the NCVS accomplished its overall objective of producing higher estimates of crime rates than the NCS. In general, the implementation of the NCVS had the effect of increasing the number of crimes counted by the survey. BJS found that the NCVS produced higher estimates of violent crime rates regardless of the context (i.e., victimized by a stranger vs. a non-stranger, crime was completed vs. attempted, victimization was reported to the police vs. not reported). However, the NCVS had a larger impact on the estimates of non-stranger and attempted crimes and crimes reported to the police than on stranger, completed and non-reported crime. For household
  • 66. crimes, the NCVS produced higher estimates of rates for completed crimes and for crimes either reported or unreported to the police. However, the magnitude of the effect on household crimes is less than the magnitude of the effect on violent crimes. Ibid., pp.2-3. subsamples of the NCS sample.188 After extensive pre-testing, the long-term changes were fully implemented by BJS in 1992.189 Between 1986 and 1992, the following changes were made to the survey: ! Better “short cue” screening questions were added to stimulate respondent recall of victimization incidents. ! More thorough descriptions of crime incidents were added in an effort to help all respondents interpret NCS concepts correctly. ! CATI was introduced to improve data collection. ! Specific questions about rape and sexual assaults were added to improve measurement of these crimes. ! Screening questions were reworded and added to get a better measure of domestic violence.190 After the implementation of the redesigned NCS, BJS changed the name of the NCS to the National Crime Victimization Survey (NCVS). From January 1992 through June 1993, the full NCS-NCVS sample was divided into two parts.191 One half of the sample was administered the NCS, and the other half
  • 67. was administered the NCVS.192 BJS chose to give each half of the sample either the NCS or the NCVS to permit the continuous publication of estimates of the year-to- year change in crime rates with comparable data while the NCVS was being introduced.193 The procedure was also intended to provide data on how the reported rate of victimization might have changed from the NCS to the NCVS.194 Periodically, BJS has expanded the scope of the NCVS to address new issues in crime. In 1998, Congress required BJS to add questions to the NCVS to identify CRS-28 195 See the Crime Victims with Disabilities Awareness Act (P.L. 105-301). C.M. Rennison and M. Rand, “Introduction to the NCVS,” p. 46. 196 Ibid. 197 Ibid. 198 Ibid. 199 BJS, Questions and Answers about the Redesign, p. 2. 200 Ibid. crime victims with developmental disabilities.195 In 1999, BJS added questions to the NCVS to determine the extent to which respondents who were victims of crime perceived the crimes to be hate crimes.196 In 2001, BJS added questions to the NCVS to explore the extent to which people were victimized by
  • 68. computer-related crimes.197 In 2004, the computer crimes questions were replaced by questions about identity theft.198 How NCVS Data Are Collected NCVS Data. The Census Bureau conducts the NCVS for BJS.199 As shown in Appendix I, in 2005, data were collected from 67,000 people in 38,600 households. The survey asks respondents whether they have been the victim of ! rape and sexual assault, ! robbery, ! simple and aggravated assault, ! purse snatching/pickpocketing, ! burglary, ! theft, or ! motor vehicle theft.200 In addition to estimating the number of annual victimizations, the NCVS also gathers data on the details of each victimization incident. To do this, the survey collects data on ! the month, time, and location of the crime; ! the relationship between the victim and the offender; ! characteristics of the offender; ! self-protective actions taken by the victim during the incident
  • 69. and results of those actions; ! consequences of the victimization, including any injury or property loss; ! whether the crime was reported to the police and the reason for reporting or not reporting; and CRS-29 201 Ibid. 202 C.J. Mosher et al., The Mismeasure of Crime, p. 138. 203 Ibid. 204 Ibid.; C.M. Rennison and M. Rand, “Introduction to the NCVS,” p. 24. 205 C.J. Mosher et al., The Mismeasure of Crime, p. 138. 206 Census Bureau, NCVS Interviewing Manual, p. A1-9. 207 C.M. Rennison and M. Rand, “Introduction to the NCVS,” p. 24. 208 Census Bureau, NCVS Interviewing Manual, p. A1-10. 209 C.J. Mosher et al., The Mismeasure of Crime, p. 138. 210 Ibid. 211 Ibid. ! offender use of weapons, drugs, and alcohol.201 NCVS Methodology. The NCVS sample is selected using a stratified, multistage cluster sample.202 The sampling process starts by identifying approximately 2,000 primary sampling units (PSUs) that are
  • 70. composed of standard metropolitan statistical areas, a county, or a small group of contiguous counties.203 PSUs are stratified with respect to important demographic characteristics, such as geographic region, population density, population growth rate, and proportion of nonwhite population.204 A sample of households is chosen from each stratum in a manner that is proportionate to their representation in the larger population.205 When a household is selected for the sample, all eligible people in the household are interviewed. Non-institutionalized persons aged 12 and older living in the United States are eligible to be interviewed for the NCVS.206 When a household is selected for the NCVS sample, eligible members of the household are interviewed once every six months for three years, for a total of seven interviews. After three years, the household is rotated out of the sample and a new one is brought in. The rotational panel design of the NCVS is accomplished by dividing all sampled households into six rotational groups, with each group containing six panels of households.207 Each month, one panel from each group is interviewed, so that in any given month, one- sixth of the sample is being interviewed for the first time, one- sixth is being interviewed for the second time, and so forth.208 The survey instrument used in the NCVS consists of three parts: the “control
  • 71. card,” a basic “screen” questionnaire, and crime incident reports. The control card contains basic administrative information for the sampled household, including the house’s address and basic household data, such as the household’s income, whether the house is owned or rented, and the names, age, race, sex, marital status, and education of all individuals living in the household.209 The control card also contains a record of visits, telephone calls, interviews, and information about non- interviews.210 Information on the control card is provided by a “knowledgeable adult” in the household.211 The “knowledgeable adult” is interviewed about CRS-30 212 Ibid. 213 Ibid. 214 BJS, Questions and Answers about the Redesign, p. 3. 215 Ibid. 216 C.J. Mosher et al., The Mismeasure of Crime, p. 139. 217 Janet L. Lauritsen, “Social and Scientific Influences on the Measurement of Criminal Victimization,” Journal of Quantitative Criminology, vol. 21, no. 3 (2005), p. 247, hereafter “J. Lauritsen, ‘Social and Scientific Influences on the Measurement of Criminal (continued...) victimizations against the household (i.e., burglaries, motor
  • 72. vehicle thefts, and household larcenies).212 The screen questionnaire is designed to elicit information about whether the household or a particular respondent has experienced certain types of victimizations.213 The screen questionnaire provides respondents with a series of detailed questions and cues about victimizations and situations in which crimes may take place.214 Questions on the screen questionnaire describe crimes in plain language, avoiding technical legal terms. To elicit an accurate response, respondents are provided with detailed features that may characterize a criminal incident.215 If a screening question elicits a positive response, more information about the incident is collected on an incident report. For each separate victimization incident mentioned on the screening questionnaire, the respondent is asked to complete an incident report. Incident reports include a series of questions about the particular crime event, the offending parties, and the consequences of the crime. Some of the questions on incident reports include the following: ! Was the crime reported to the police? ! Was the offense completed or just attempted? ! Did the victim know the offender, or was the offender
  • 73. identified? ! If known, what were the demographic characteristics (i.e., race, gender, age) of the offender? ! Was a weapon used in the crime? ! Did the victim resist? ! Was there any monetary loss or physical injury, or both, that resulted from the victimization?216 The first interview is conducted in person, and all subsequent interviews, unless requested by the respondent, are conducted by telephone.217 Data collected during CRS-31 217 (...continued) Victimization.’” 218 Ibid. 219 C.M. Rennison and M. Rand, “Introduction to the NCVS,” p. 29. 220 Ibid. 221 Ibid. 222 Ibid. 223 Ibid. 224 Ibid., p. 43. 225 Ibid., p. 28. 226 Ibid., p. 48. 227 BJS, Questions and Answers about the Redesign, p. 6.
  • 74. first interviews are used for bounding purposes and are excluded when calculating the crime rate.218 In the context of the NCVS, “bounding” refers to a process whereby the prior interview and the data collected during it are used in subsequent interviews to ensure that victimizations before the reference period and victimizations reported in prior interviews are not counted twice.219 Bounding procedures can help reduce the effects of “telescoping,” which refers to the tendency of people to incorrectly identify the timing of past events.220 For example, if a respondent is asked whether he or she has been the victim of a crime in the past six months, the respondent might report a victimization that actually occurred seven months ago. The bounding procedure provides respondents with both a cognitive and mechanical bound.221 The prior interview can serve as an event that respondents can use to help determine whether a victimization occurred within the current reference period.222 Furthermore, if the interviewer finds that a reported victimization is similar to one reported previously, the interviewer can question the respondent further to ensure that the reported victimization did indeed occur in the current reference period.223 Data collected during bounding interviews are not used by BJS to calculate annual victimization rates. A growing number of interviews for the NCVS are being
  • 75. conducted via Computer-Assisted Telephone Interviewing (CATI). Currently, about 30% of all NCVS interviews are conducted by using CATI.224 As discussed above, the first interview is conducted face-to-face, and subsequent interviews are conducted by phone. Face-to-face and non-CATI telephone interviews are conducted using Paper and Pencil Interviewing (PAPI); that is, the respondent’s answers are recorded on printed instruments.225 The survey has evolved from one in which all interviews were done face-to-face to one in which most interviews are conducted over the telephone, with a growing number of phone interviews employing CATI.226 With CATI, interviews are conducted from a centralized telephone facility where they read questions from a computer screen and record answers directly into a computer.227 The computer provides the interviewer with the next appropriate question based on the last answer; it also allows for automated internal consistency checks and reduces CRS-32 228 Ibid. 229 Ibid. 230 Michael R. Rand, The National Crime Victimization Survey: 32 Years of Measuring Crime in the United States, paper prepared for the Siena Group
  • 76. on Social Statistics meeting in Helsinki, Finland, February 2005, p. 9, hereafter “M.R. Rand, The National Crime Victimization Survey: 32 Years of Measuring Crime in the United States.” 231 Ibid. 232 Ibid. 233 Ibid. 234 Ibid. 235 Ibid. 236 J. Lauritsen, “Social and Scientific Influences on the Measurement of Criminal Victimization,” p. 247. 237 BJS, Questions and Answers about the Redesign, p. 3. transcription errors.228 CATI improves data quality because all interviewers are in a centralized facility, allowing them to be monitored for adherence to standardized interviewing techniques.229 In some instances, an interviewer is unable to complete an interview with a household or an individual in the household (i.e., they are “noninterviews”).230 The NCVS classifies various types of noninterviews. Because the sample is a sample of households, and not of the people who live in the household, some sampled households may not be able to be interviewed.231 For example, the household may be vacant, occupied by persons who have usual residences elsewhere, or temporarily or permanently converted to a business.232 In these instances, the households are removed from the sample, either until the next time the
  • 77. household is to be interviewed (if the situation is temporary) or permanently, if the household will not be eligible for interviewing in the future.233 Other noninterviews occur when an interview cannot be completed with the entire eligible household, or when an interview cannot be completed with an eligible member of a household.234 Such noninterviews occur for a variety of reasons, including if no one is home during the three-week interview period, if the household or persons in the household refuse to be interviewed, and if the household is not reachable, for example, because of impassable roads.235 The NCVS does not rely on the respondent or the interviewer to classify reported victimizations. Rather, victimizations are classified based on details of the reported incident provided by the respondent.236 For example, a woman does not have to report that she was the victim of a rape for the victimization to be classified as a rape. If the details provided by the respondent indicate that the respondent was the victim of a rape, the victimization will be classified as a rape in the NCVS. Moreover, if the details of the incident do not meet the criteria necessary to define a victimization as a particular crime, the victimization will not be counted as a crime.237 For example, if a respondent believes that he/she was assaulted but the
  • 78. CRS-33 238 Michael R. Rand and Callie M. Rennison, “True Crime Stories? Accounting for Differences in Our National Crime Indicators,” Chance, vol. 15, no. 1 (2002), p. 49, hereafter “M.R. Rand and C.M Rennison ‘Accounting for Differences in Our National Crime Indicators.’” 239 Ibid. 240 A confidence interval shows the range within which the true value of a calculated statistic is likely to fall a certain percentage of the time. In this case, the NCVS estimated that 95% of the time, the true violent crime victimization rate was in the range of 25.85 to 29.95 victimizations per 100,000 people aged 12 or older. There was a 5% chance that it was either higher or lower than that range. 241 M.R. Rand and C.M Rennison “Accounting for Differences in Our National Crime Indicators,” p. 49. 242 Ibid. 243 Ibid. details do not meet the criteria of a simple assault, the victimization will not be counted as a simple assault in the NCVS. Limitations of NCVS Data Sampling and Non-sampling Error. As described above, the NCVS estimates national crime rates by interviewing a sample of
  • 79. households across the country. Because the NCVS is a sample survey, it is subject to both sampling and non-sampling error, meaning that the estimated victimization rate might not accurately reflect the true victimization rate. Whenever samples are used to represent entire populations, there could be a discrepancy between the sample estimate and the true value of what the sample is trying to estimate. The NCVS accounts for sampling error by calculating confidence intervals for estimated rates of victimization.238 For example, in 2000, the estimated violent crime victimization rate was 27.9 victimizations per 100,000 people aged 12 and older.239 The calculated 95% confidence interval240 for the estimated violent crime victimization rate was 25.85 to 29.95 victimizations per 100,000 people aged 12 and older.241 The NCVS is also subject to non-sampling error. The methodology employed by the NCVS attempts to reduce the effects of non-sampling error as much as possible, but an unquantified amount remains.242 Non- sampling error can result from respondents not being able to recall victimizations that occurred to them during the reference period. Non-sampling error can also occur when respondents do not report crimes to the interviewer. Respondents may not report crimes because they know the perpetrator or because they are victims of certain crimes frequently enough that they forget that they were victimized or they do not consider the
  • 80. victimizations important enough to report.243 Sampling Bias. The NCVS relies on interviews with household members to collect its data, but it is likely that some people sampled will not complete the survey. As shown in Appendix G, between 1996 and 2005, anywhere from 9% to 16% of people included in the sample did not complete the survey. If non-responders differ from responders in the number of victimizations they experienced, the estimated CRS-34 244 C.J. Mosher et al., The Mismeasure of Crime, p. 159. 245 C.M. Rennison and M. Rand, “Introduction to the NCVS,” pp. 42-43. 246 U.S. Department of Justice, Office of Justice Programs, Bureau of Justice Statistics, Criminal Victimization in the United States, 2005 Statistical Tables, National Crime Victimization Survey, NCJ 215244, December 2006, p. 134. 247 See, for example, Callie Marie Rennison, Intimate Partner Violence and Age of Victim, 1993-99, U.S Department of Justice, Office of Justice Programs, Bureau of Justice Statistics, NCJ 187635, October 2001. national victimization rate might be lower or higher than the true victimization rate. Researchers have reported that homeless people, young males, and members of
  • 81. minority groups are less likely to be included in the NCVS sample and have higher rates of victimization than their older, female, non-minority counterparts.244 Series Victimizations. When a respondent experiences six or more similar but separate victimizations, and when the respondent is unable to recall the details of each incident well enough to describe them to the interviewer, the interviewer completes one incident report to cover the series of incidents.245 The incident report is completed using information from the most recent incident. BJS does not include series victimizations when it calculates annual victimization rates.246 However, BJS does use series victimization data in special reports where series victimizations are an important aspect of the subject being analyzed (e.g., domestic violence).247 In these instances, one series is counted as one incident. It is likely that not including series victimization estimates in the annual victimization estimates would result in an underestimation of the true national victimization rate. But the question remains, how large would this effect be? Each year, BJS includes data on the number and percentage of total victimizations reported as series victimizations. As shown in Figure 1, the percentage of personal crimes reported as series victimizations ranged from 3.5% in 2001 to 4.7% in 2003 and 2004. The percentage of property crimes reported as series
  • 82. victimizations was consistent from 2001 to 2004 (0.8%) and decreased to 0.5% in 2005. CRS-35 248 C.M. Rennison and M. Rand, “Introduction to the NCVS,” pp. 30-31. 249 As cited in Ibid. Source: U.S. Department of Justice, Office of Justice Programs, Bureau of Justice Statistics, Criminal Victimization in the United States, 2005 Statistical Tables, National Crime Victimization Survey, NCJ 215244, December 2006. Changes in Household Residents. As described above, a sample of households is selected to be interviewed for the NCVS, and it is the household, not the people in the household, that remains in the sample. Hence, the interviewer interviews anyone in the household over the age of 12 at each enumeration, even if the residents of the household have changed from the previous interview. This can result in some cases where unbounded interviews can be included in the national victimization estimates. For example, if a new family moves into the household while the household is in the sample, the interviews with the family will be unbounded because the bounding interview for the household was conducted during