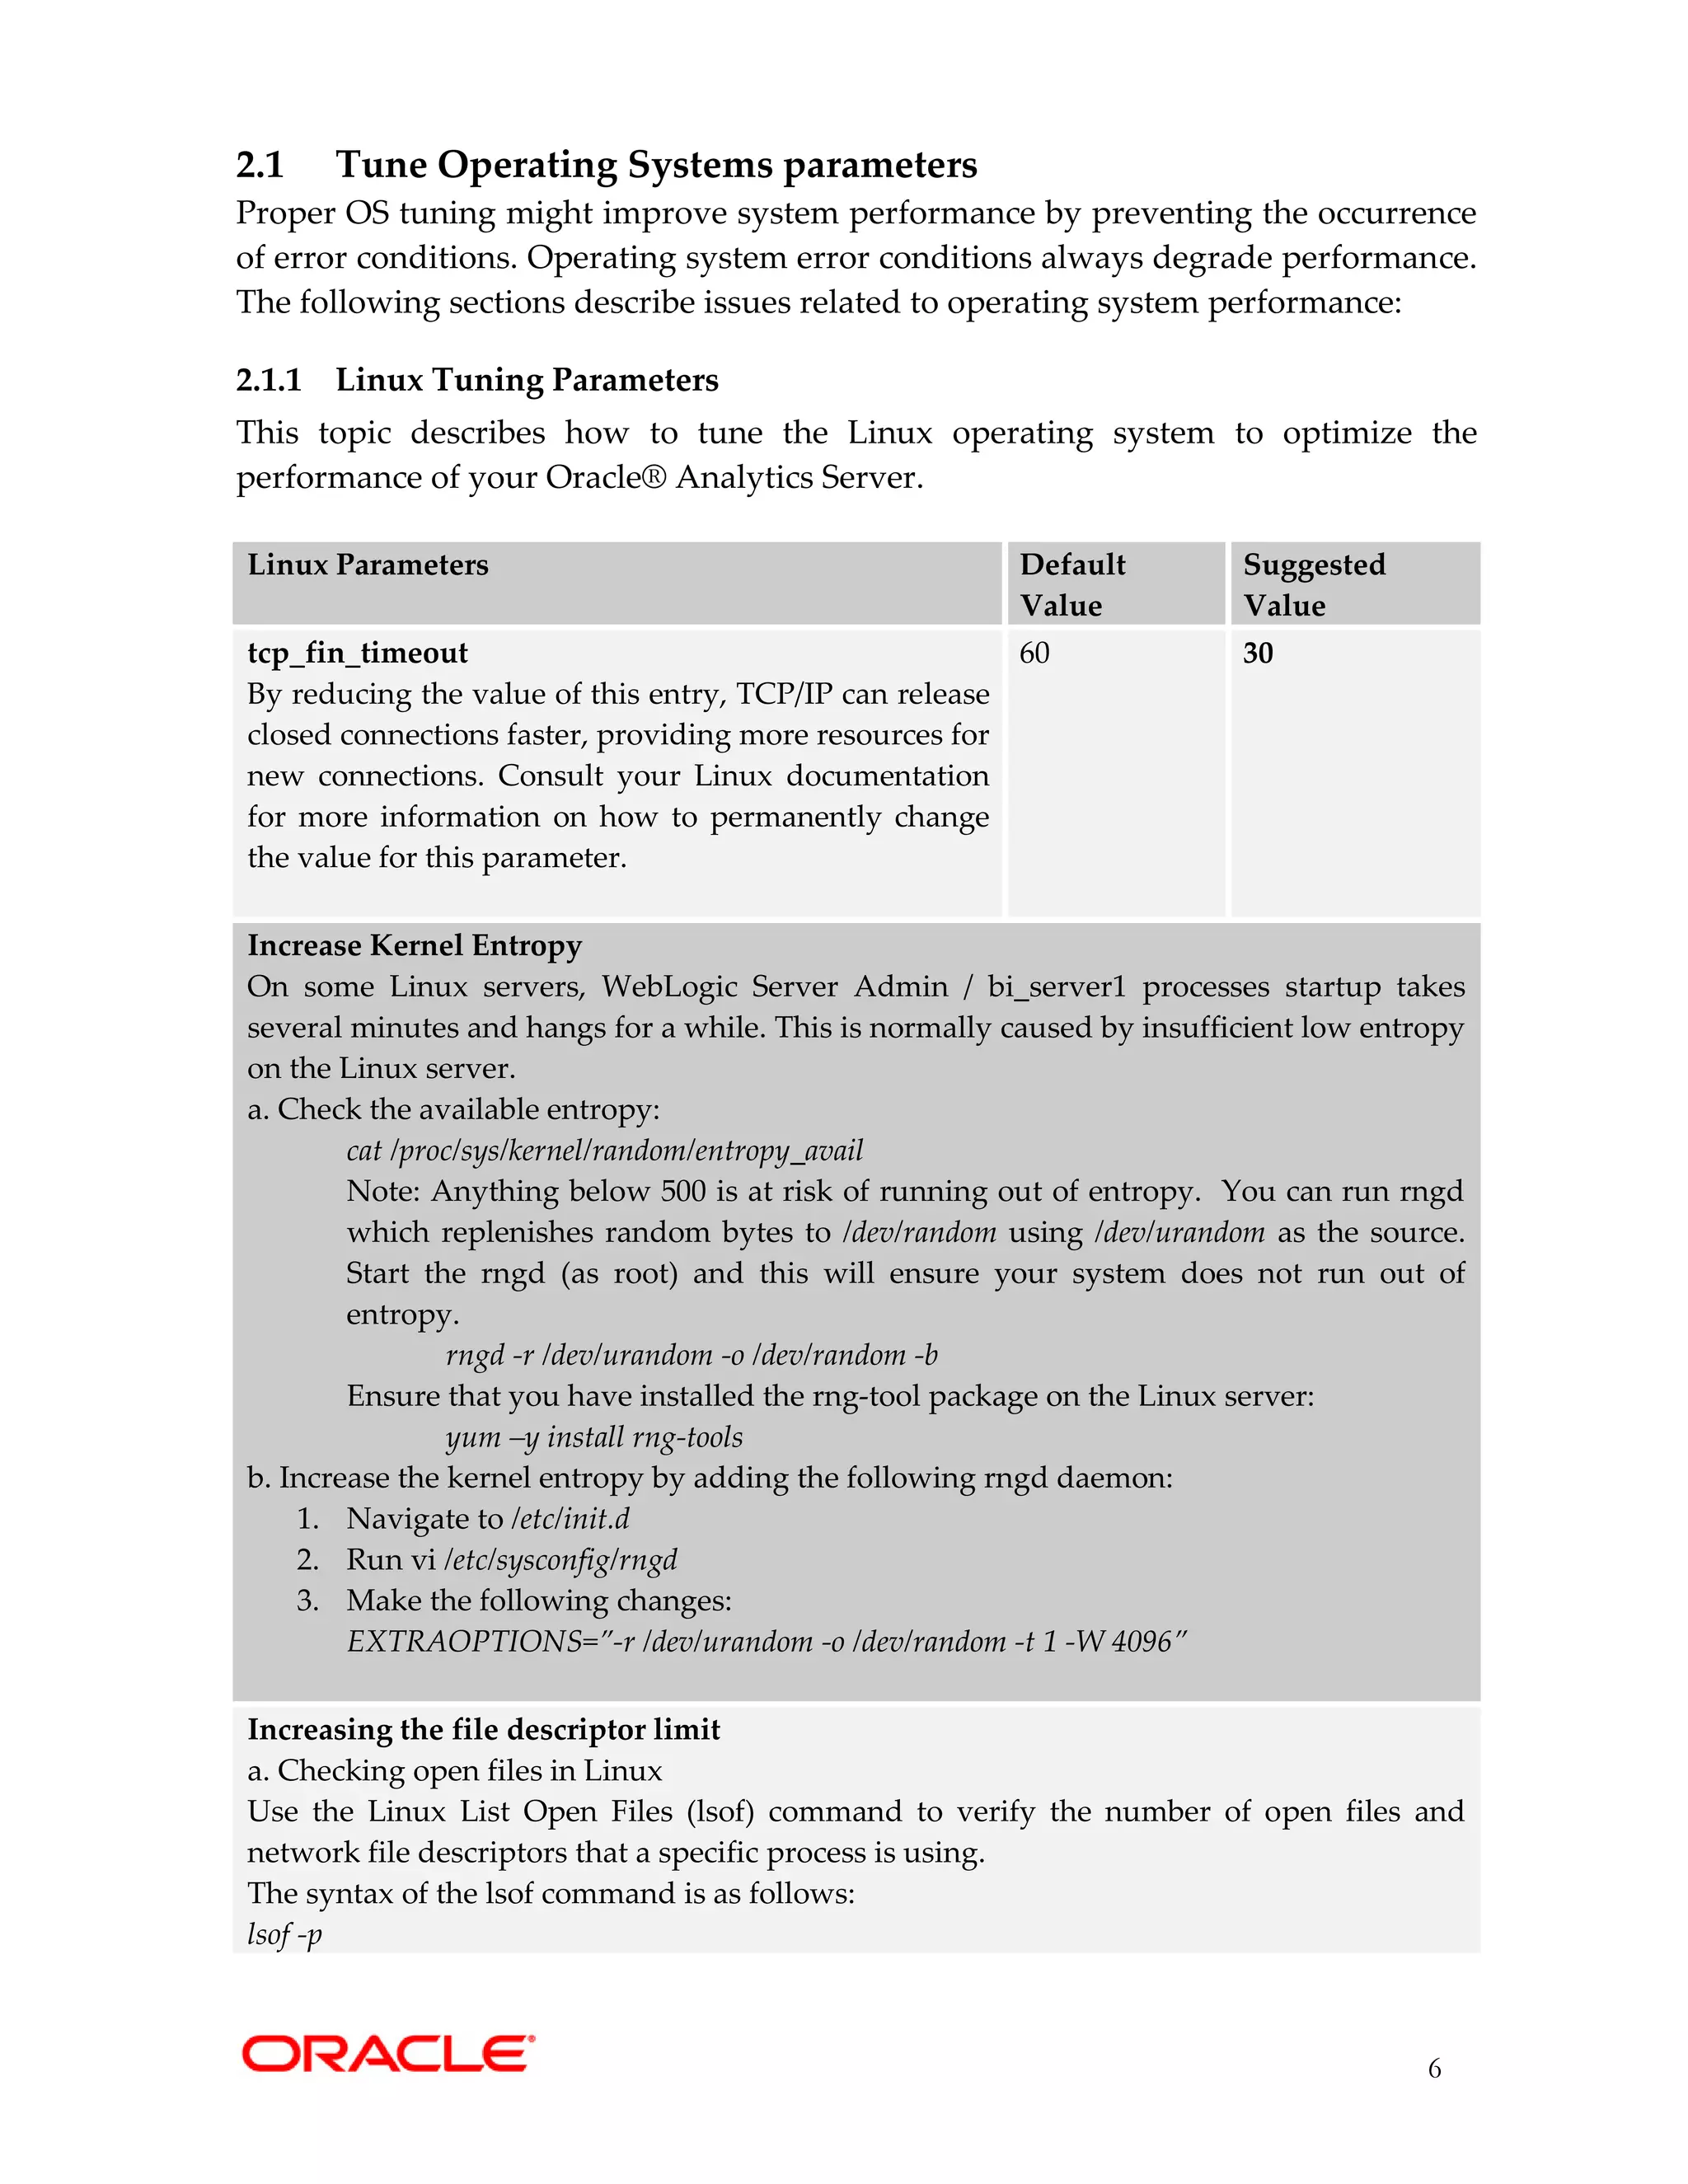
This document provides tuning recommendations to optimize the performance of Oracle Analytics Server. It discusses tuning the operating system, WebLogic Server, Java Virtual Machines, HTTP servers, browser settings, and database. Some key recommendations include increasing connection pools and file descriptors, reducing TCP timeout values, enabling HTTP server compression, and monitoring built-in BI metrics. Tuning is an iterative process that requires testing changes and analyzing performance impacts.

![7
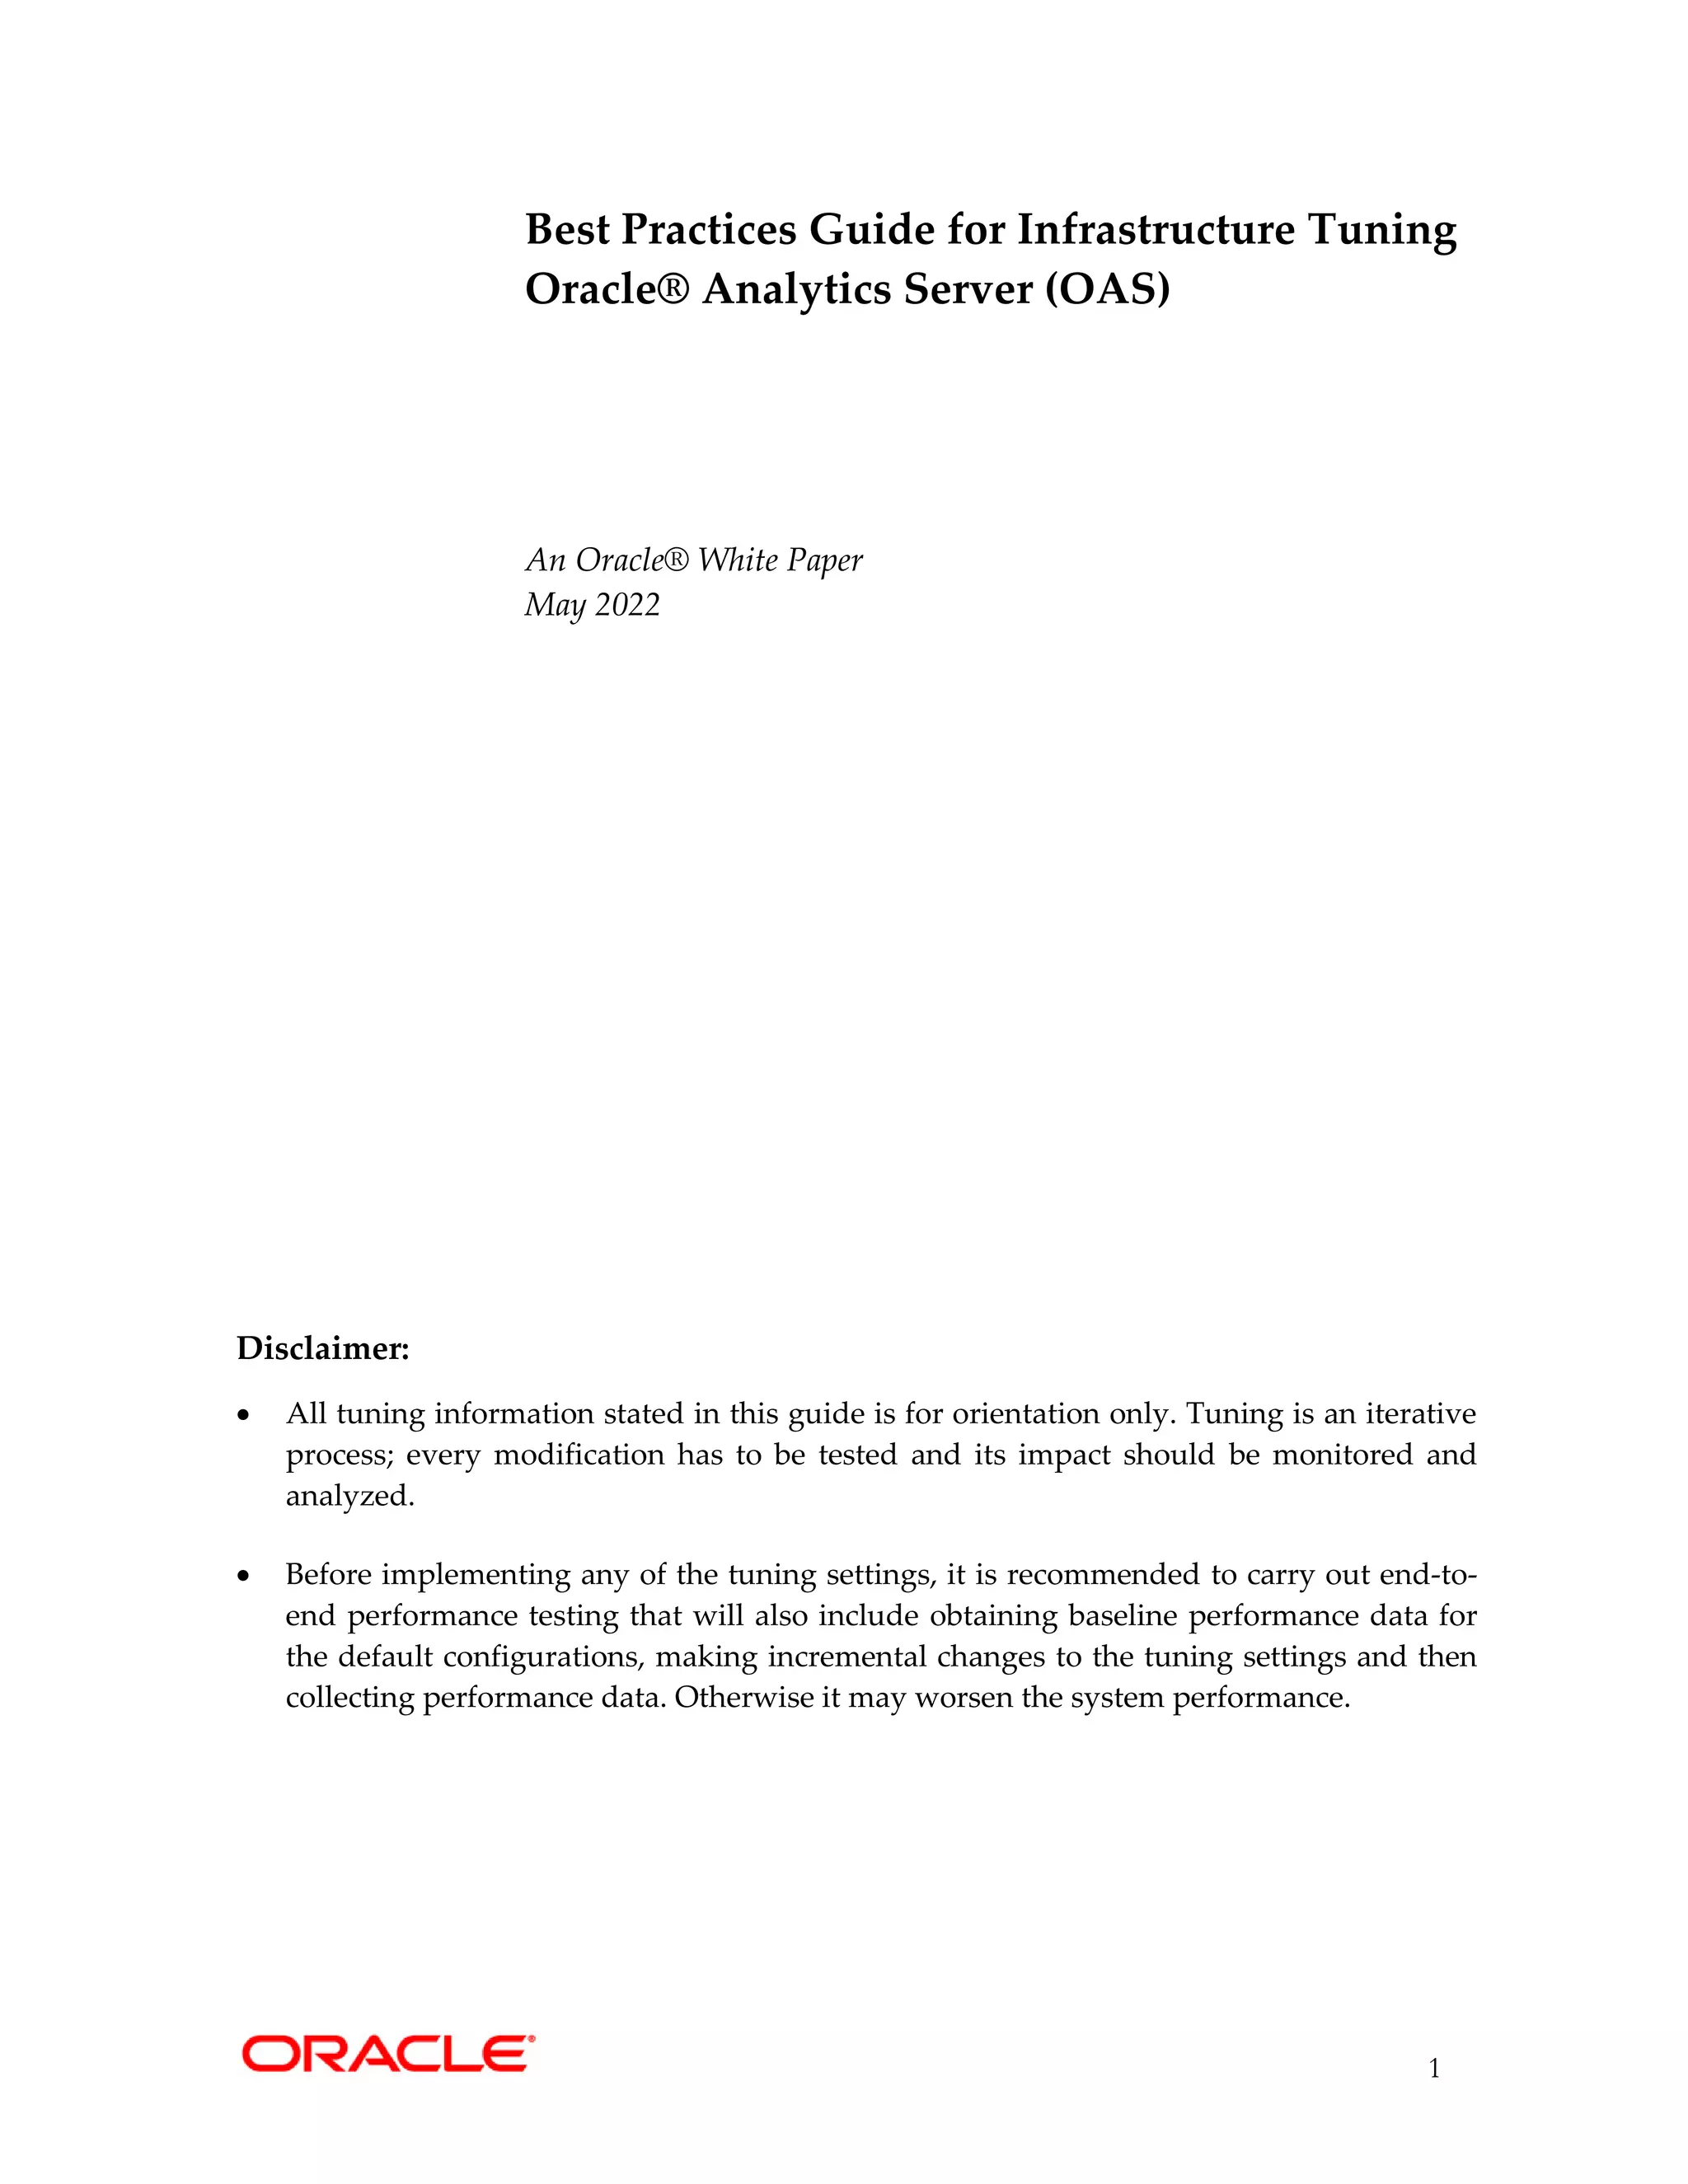
For example, checking open files for nqsserver:
If you run the lsof command immediately after starting the OAS on Linux, it shows that
170 file descriptors were allocated by the nqsserver process (e.g. pid 9219) running on the
server. This number (170) is far below the default limit of 1024 file descriptors.
For example:
$ lsof -p 9219 | wc -l
170
b. Increase the open file limit (nofile) and the maximum number of process limit (nproc) in
the Linux configuration file limits.d from 1024 to 131972. For example:
[root@bi-1]# cd /etc/security/limits.d/
[root@bi-1 limits.d]# vi 99-oracle.conf
add following and save 99-oracle.conf file:
* soft nofile 131072
* hard nofile 131072
* soft nproc 131072
* hard nproc 131072
Note: It is recommended to implement above ulimits settings to avoid following potential
OAS system issues:
- If file descriptors (open files - nofile) is set to low value, the OAS processes
(sawserver, nqsserver) will stop responding and throw Too Many Open Files error
message in logs. You can check current open files value using the "ulimit -n"
command
- If a max user processes (nproc) value is low (default is 1024) the exception
java.lang.OutOfMemoryError: unable to create new native thread will occur for
bi_serverN/JavaHost processes. Linux has a maximum allowed process per user
limit, that you can check current processes value by using the "ulimit -u"
command.
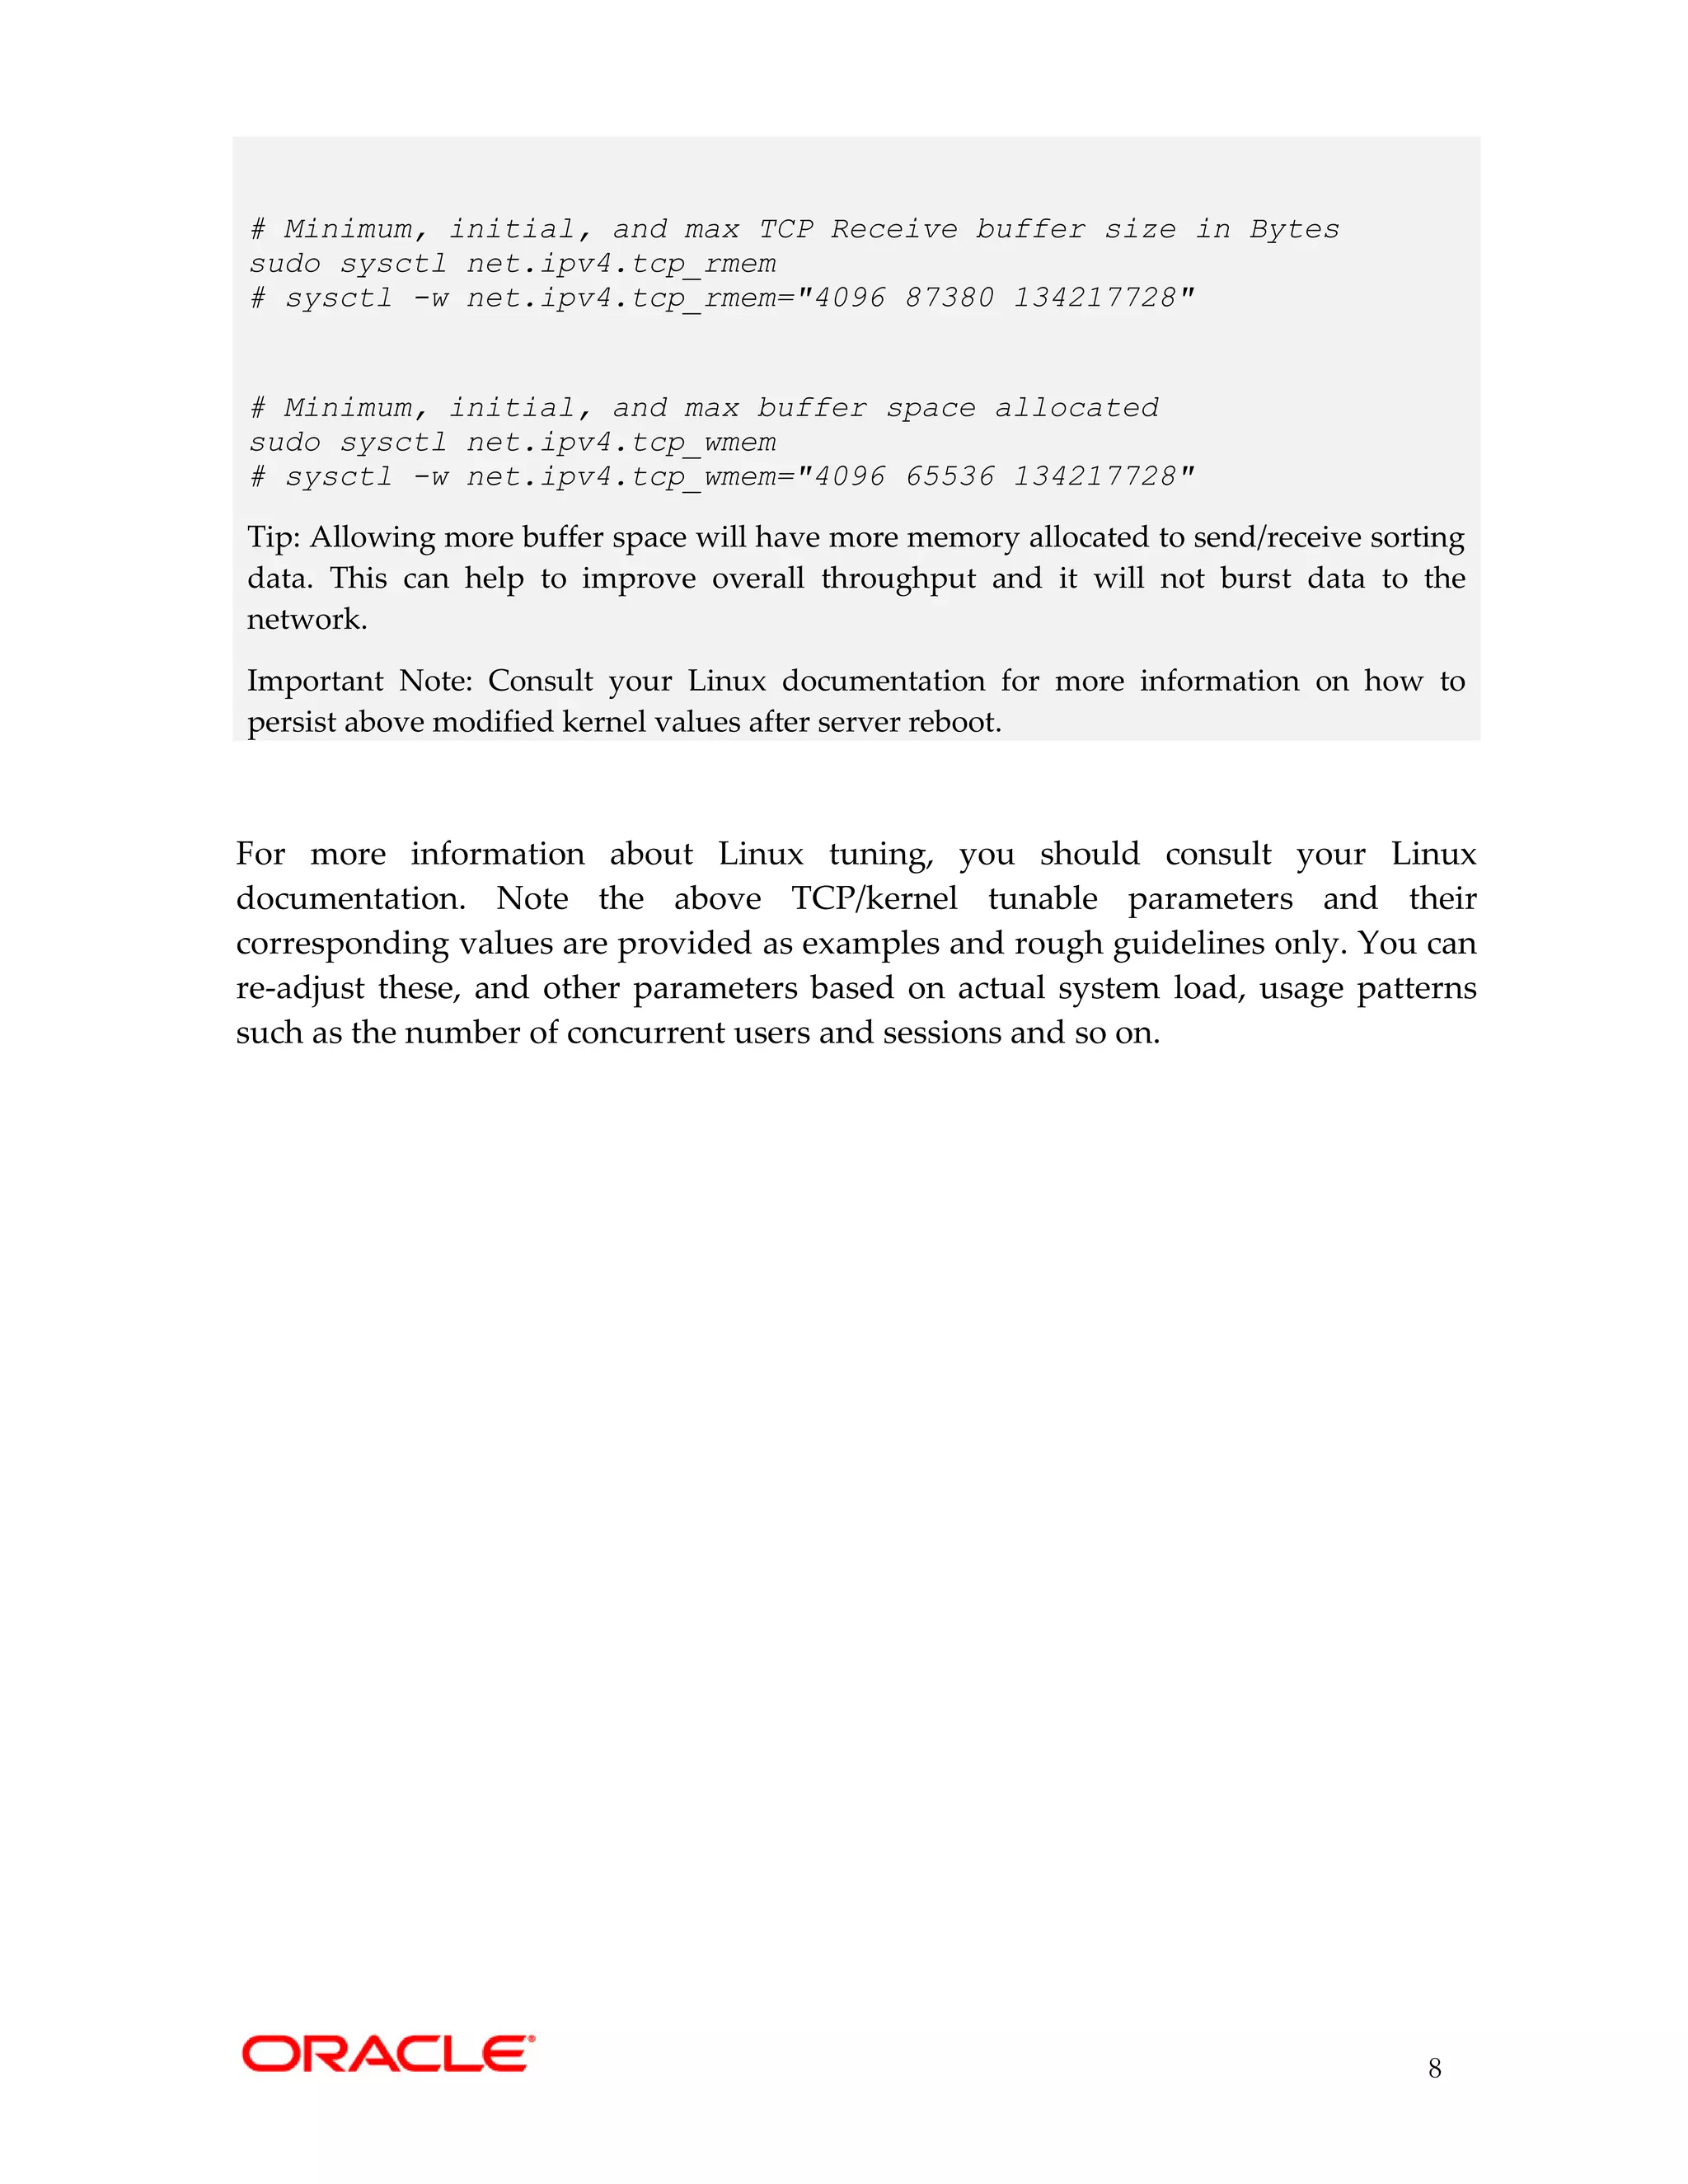
Optimize TCP Parameter Settings
Default TCP parameters in most Linux distributions are conservative and are tuned to
handle 100Mb/s or 1Gb/s port speed, and result in buffer size that are too small for 10Gb
networks. Modifying to below values can lead to significant performance gains in a 10Gb
networks link:
# Maximum receive socket buffer size
sudo sysctl net.core.rmem_max
# sysctl -w net.core.rmem_max=134217728
# Maximum send socket buffer size (size of BDP)
sudo sysctl net.core.wmem_max
# sysctl -w net.core.wmem_max=134217728](https://image.slidesharecdn.com/oracleanalyticsserverinfrastructuretuningguidev2-221108055655-98945680/75/Oracle-Analytics-Server-Infrastructure-Tuning-guide-v2-pdf-7-2048.jpg)

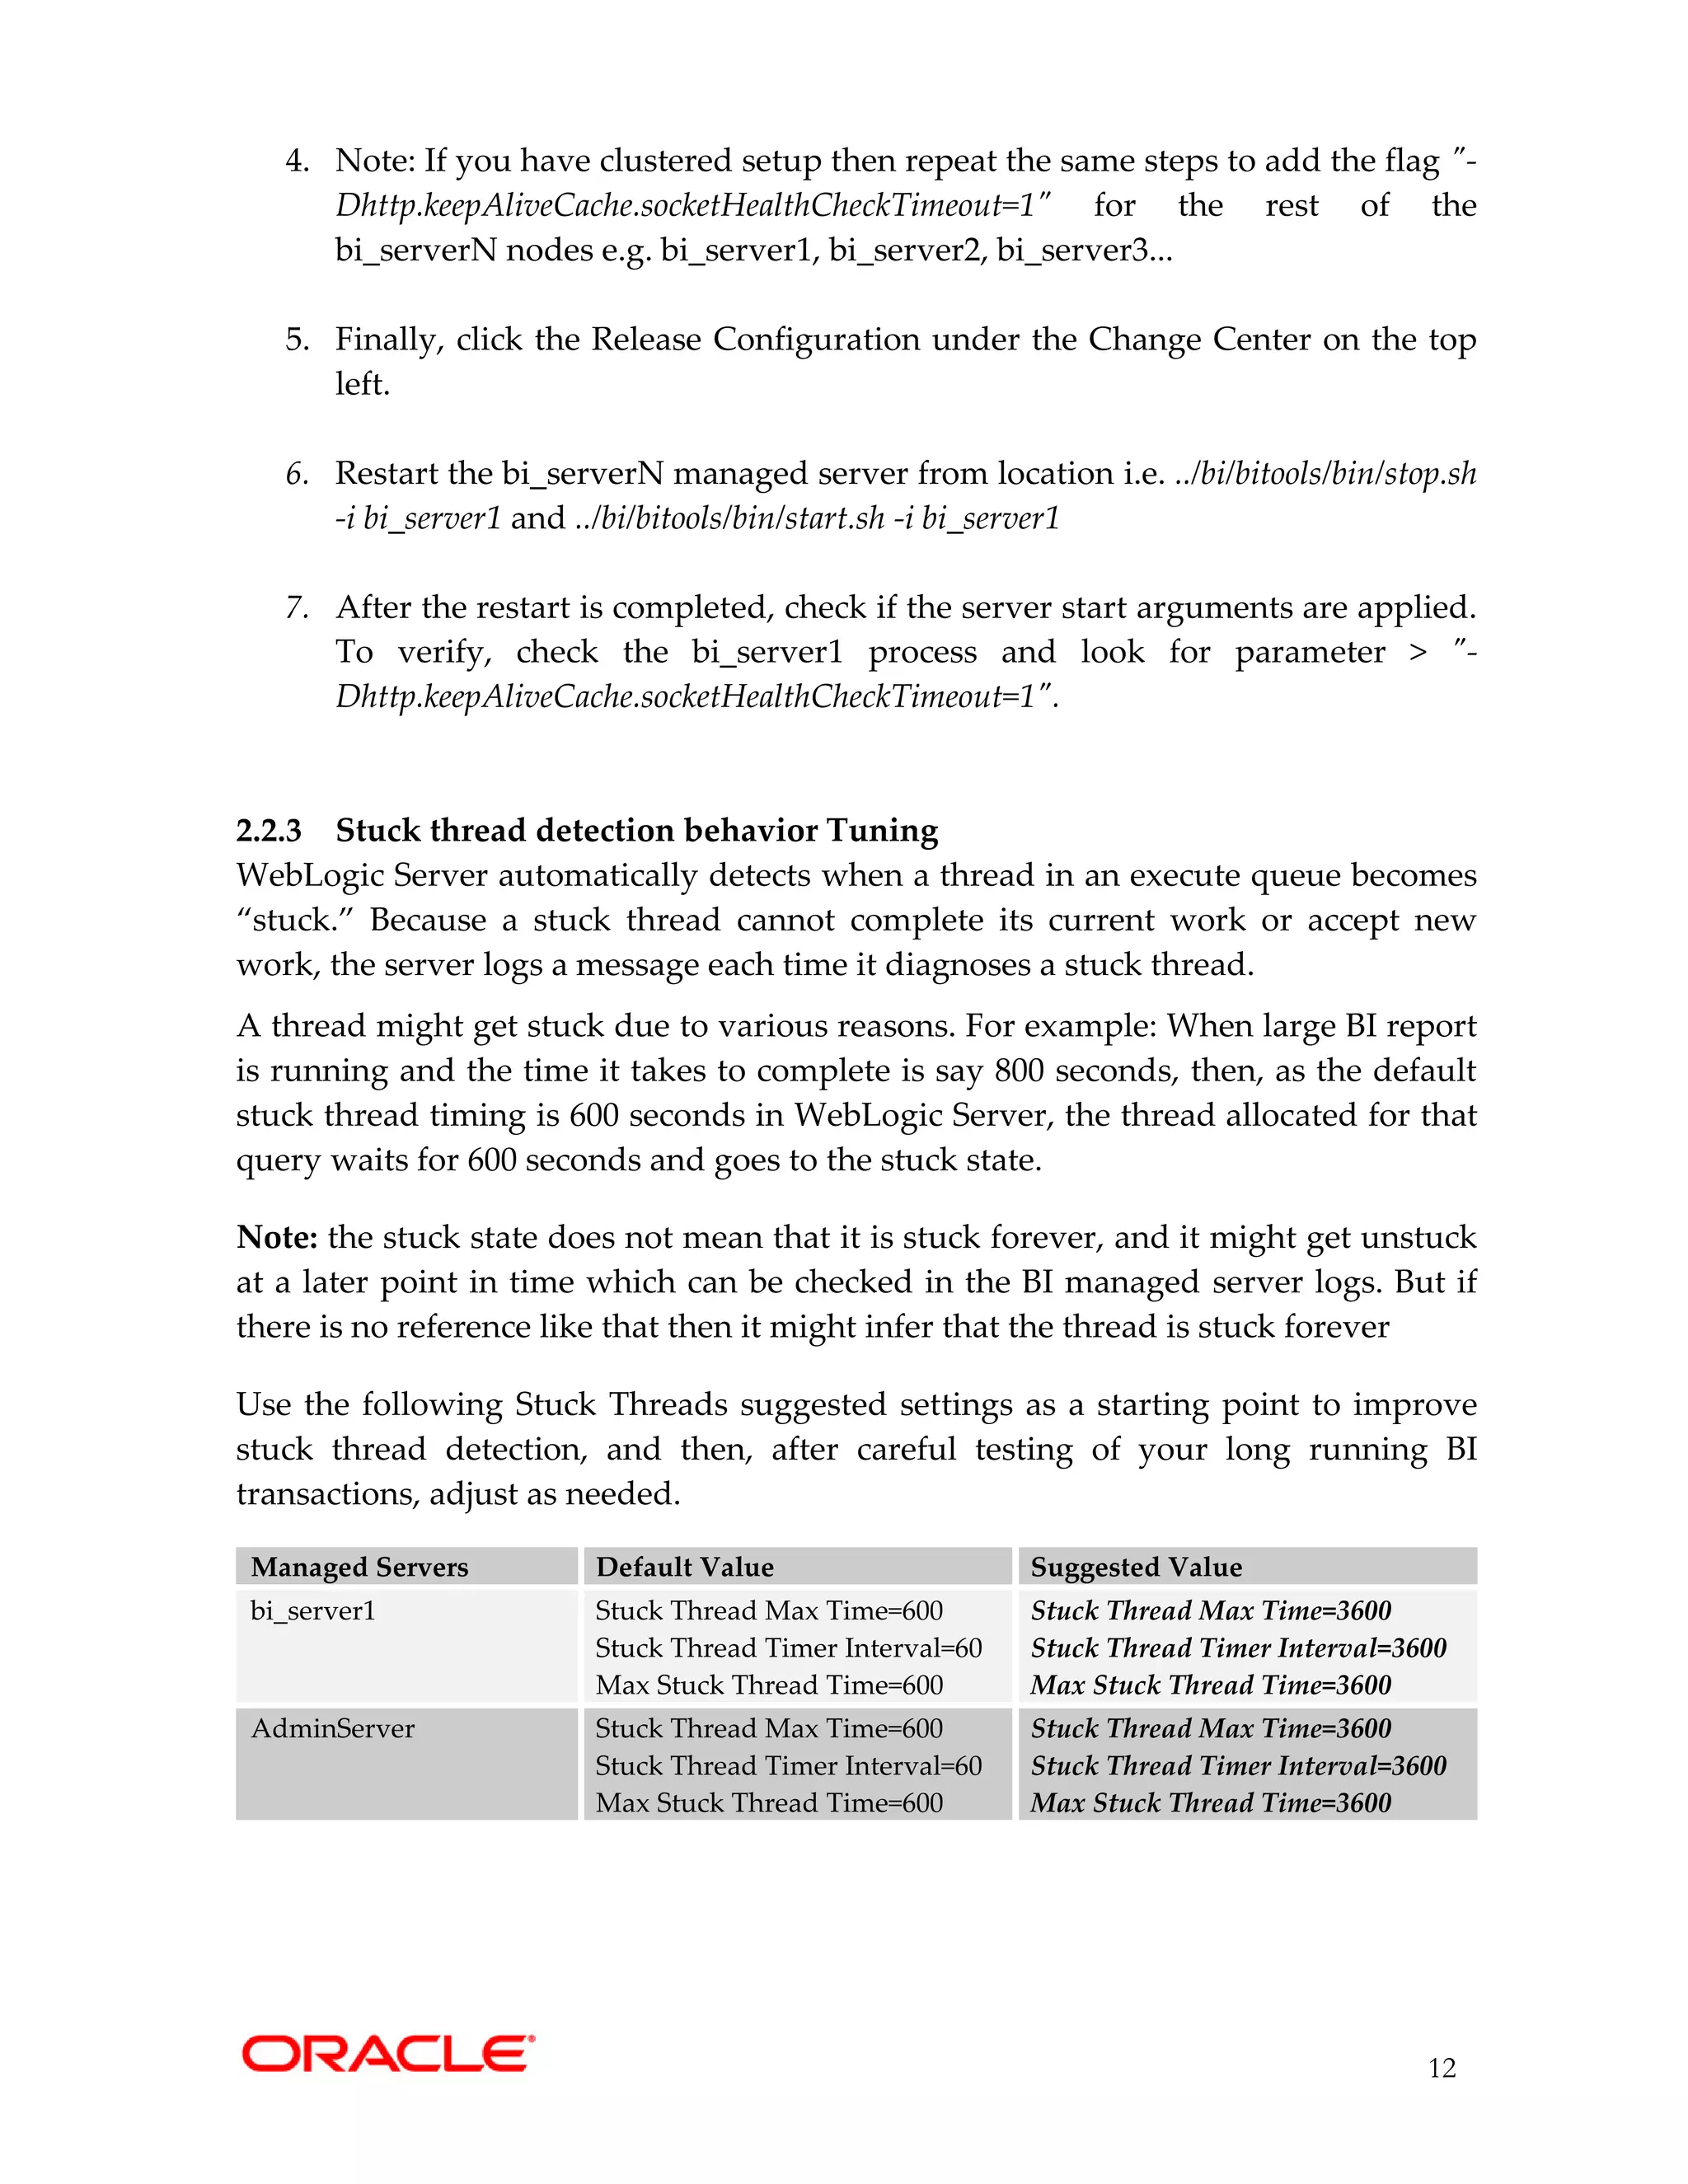

![15
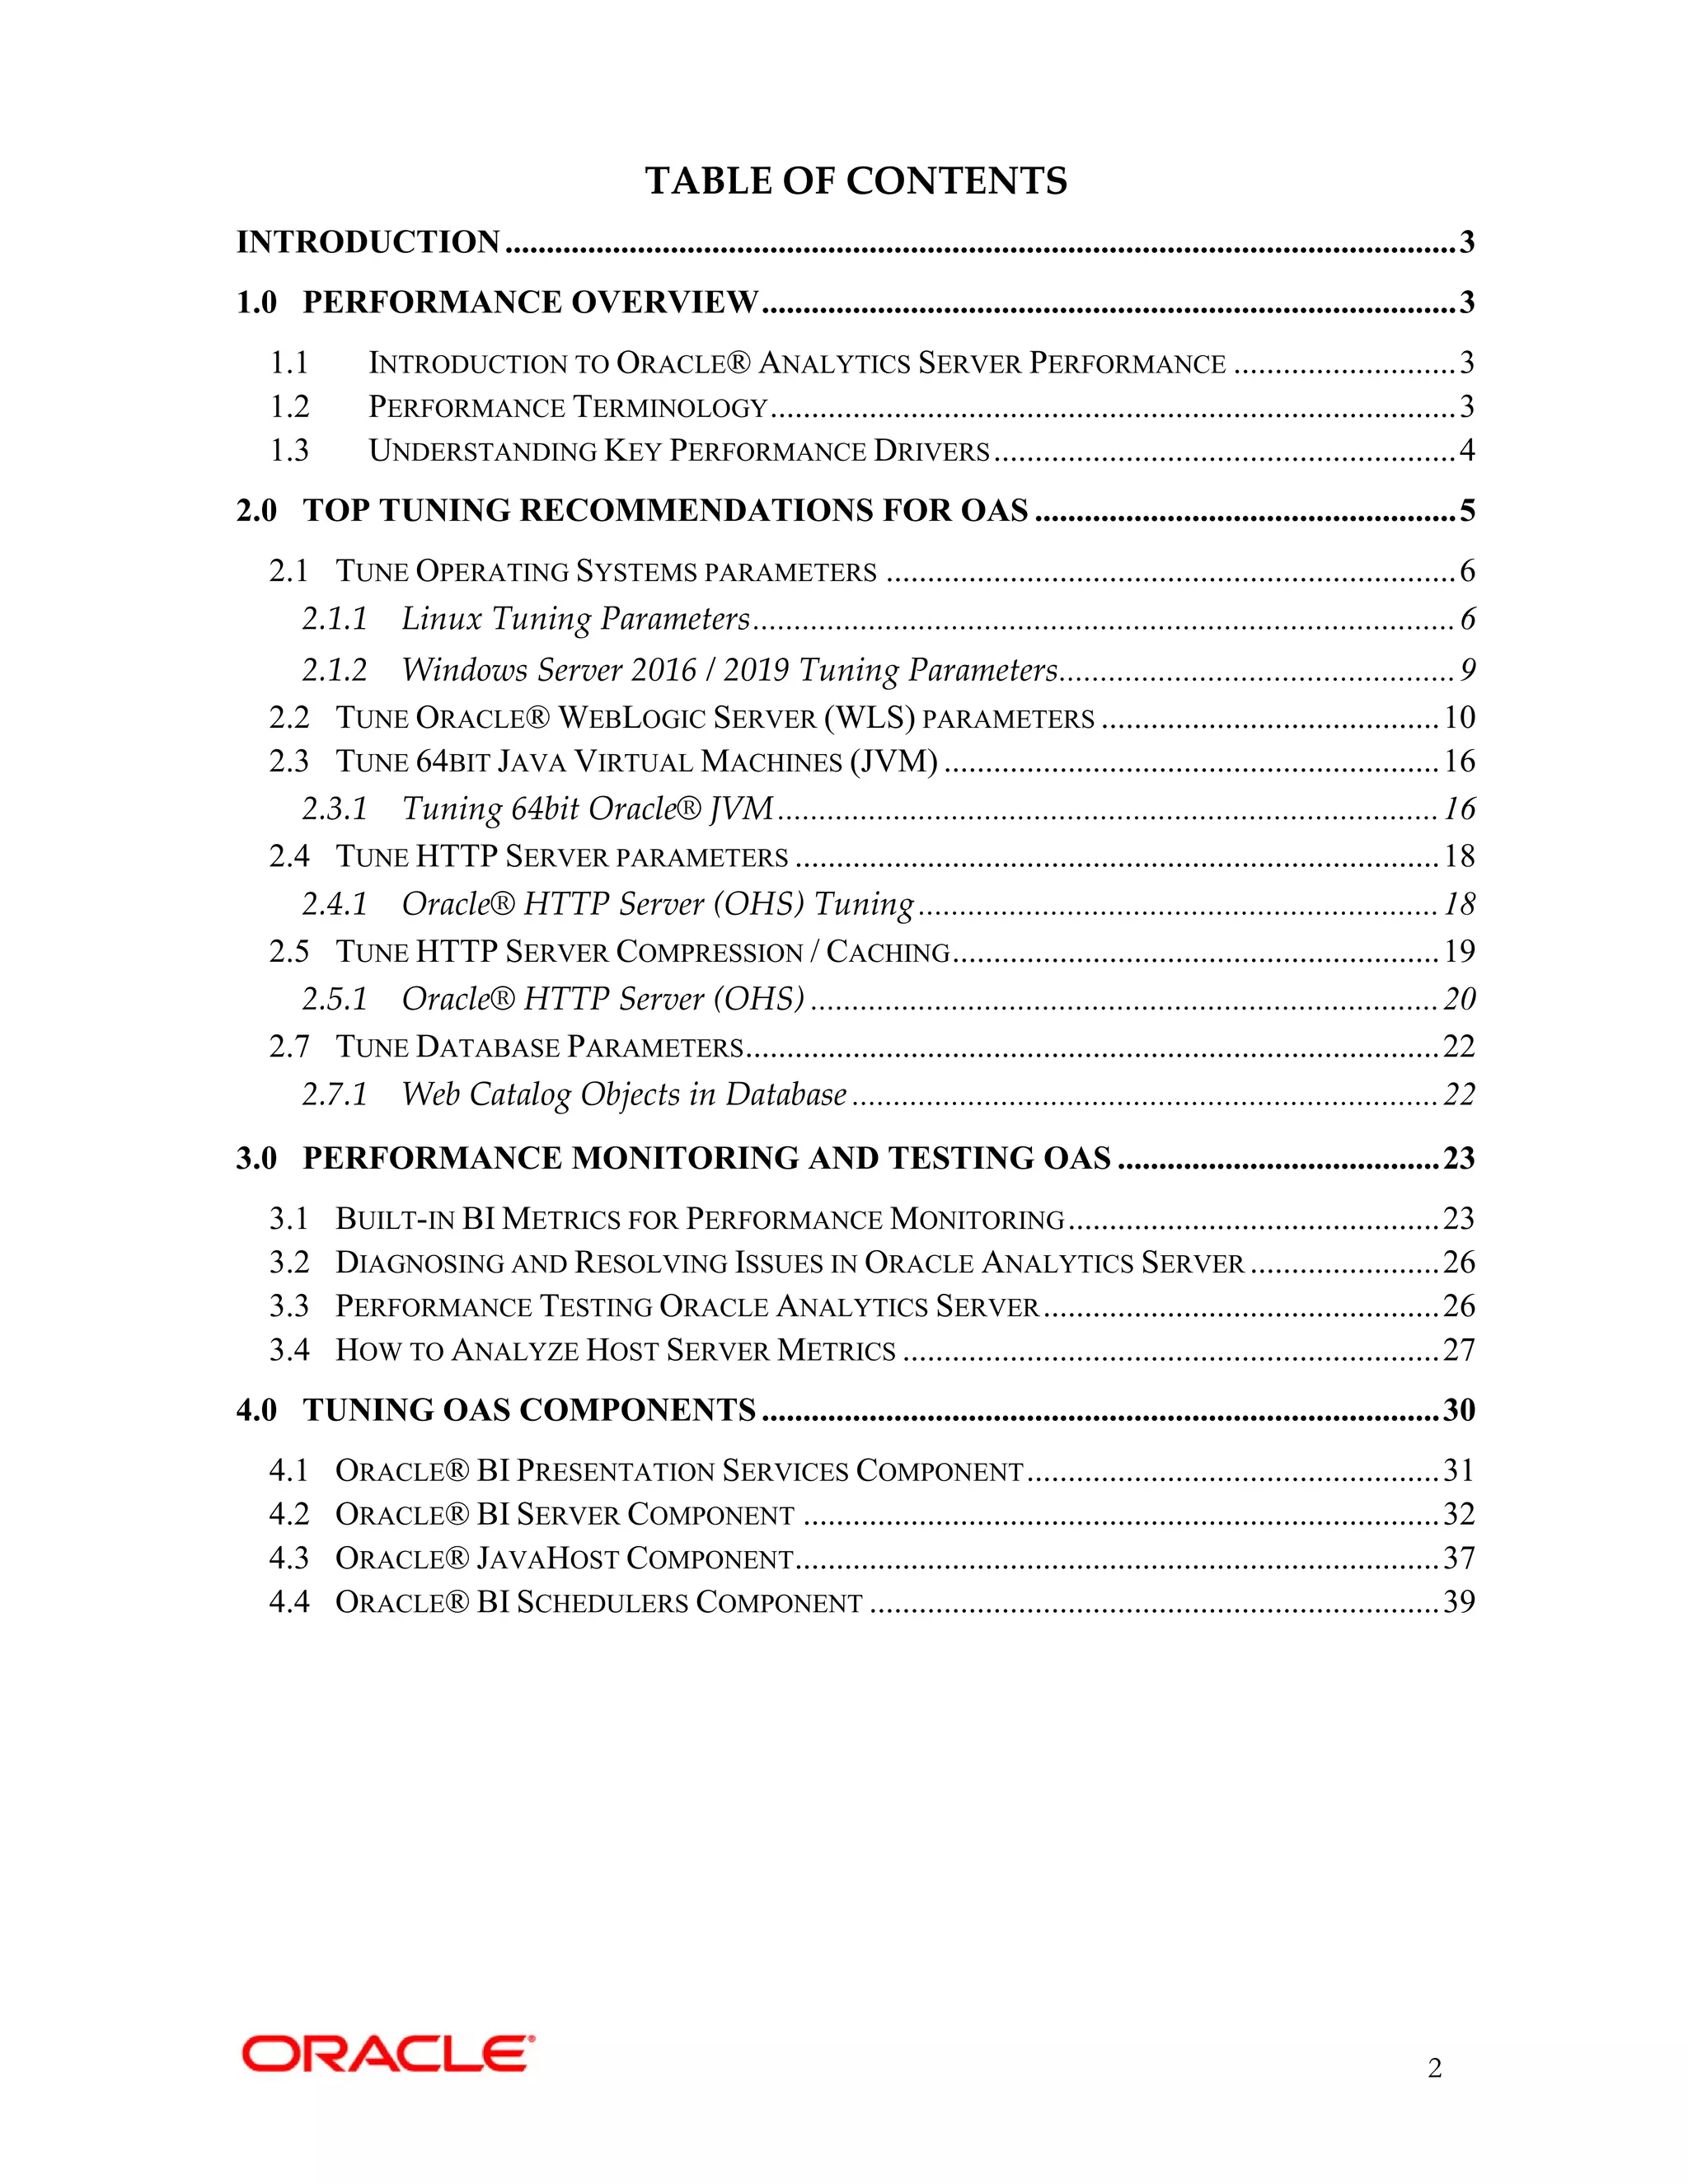
2.2.6 Tune WebLogic Server Node Manager Java Heap Size
In Oracle Analytics Server, WebLogic Server Node Manager is monitoring not only
WebLogic Managed Servers but also BI System components. When starting all the BI
processes using start.sh, Node Manager may take longer time to start, so it is
recommended to increase the java heap size for Node Manager.
File "commBaseEnv.sh" containing the Node Manager Java Heap is located at
<ORACLE_HOME>/oracle_common/common/bin
Update the following MEM_ARGS parameter from default of "-Xms32m -Xmx200m"
to higher values according to available physical memory on the system:
...
else
case $JAVA_VENDOR in
Oracle)
if [ "${VM_TYPE}" = "JRockit" ]; then
JAVA_VM=-jrockit
MEM_ARGS="-Xms128m -Xmx256m"
UTILS_MEM_ARGS="-Xms32m -Xmx1024m"
else
JAVA_VM=-server
MEM_ARGS="-Xms32m -Xmx200m"
UTILS_MEM_ARGS="-Xms32m -Xmx1024m"
fi
VERIFY_NONE="-Xverify:none"
...
to
...
else
case $JAVA_VENDOR in
Oracle)
if [ "${VM_TYPE}" = "JRockit" ]; then
JAVA_VM=-jrockit
MEM_ARGS="-Xms128m -Xmx256m"
UTILS_MEM_ARGS="-Xms32m -Xmx1024m"
else
JAVA_VM=-server
MEM_ARGS="-Xms2048m –Xmx4096m"
UTILS_MEM_ARGS="-Xms32m -Xmx1024m"
fi
VERIFY_NONE="-Xverify:none"
...
Note: Verify in "commBaseEnv.sh" file that for all the JAVA_VM=-jrockit is changed
from MEM_ARGS="-Xms32m -Xmx200m" to MEM_ARGS="-Xms2048m –Xmx4096m". Save the
file and restart the services (using stop.sh & start.sh located at
<ORACLE_HOME>/user_projects/domains/bi/bitools/bin)](https://image.slidesharecdn.com/oracleanalyticsserverinfrastructuretuningguidev2-221108055655-98945680/75/Oracle-Analytics-Server-Infrastructure-Tuning-guide-v2-pdf-15-2048.jpg)


![32
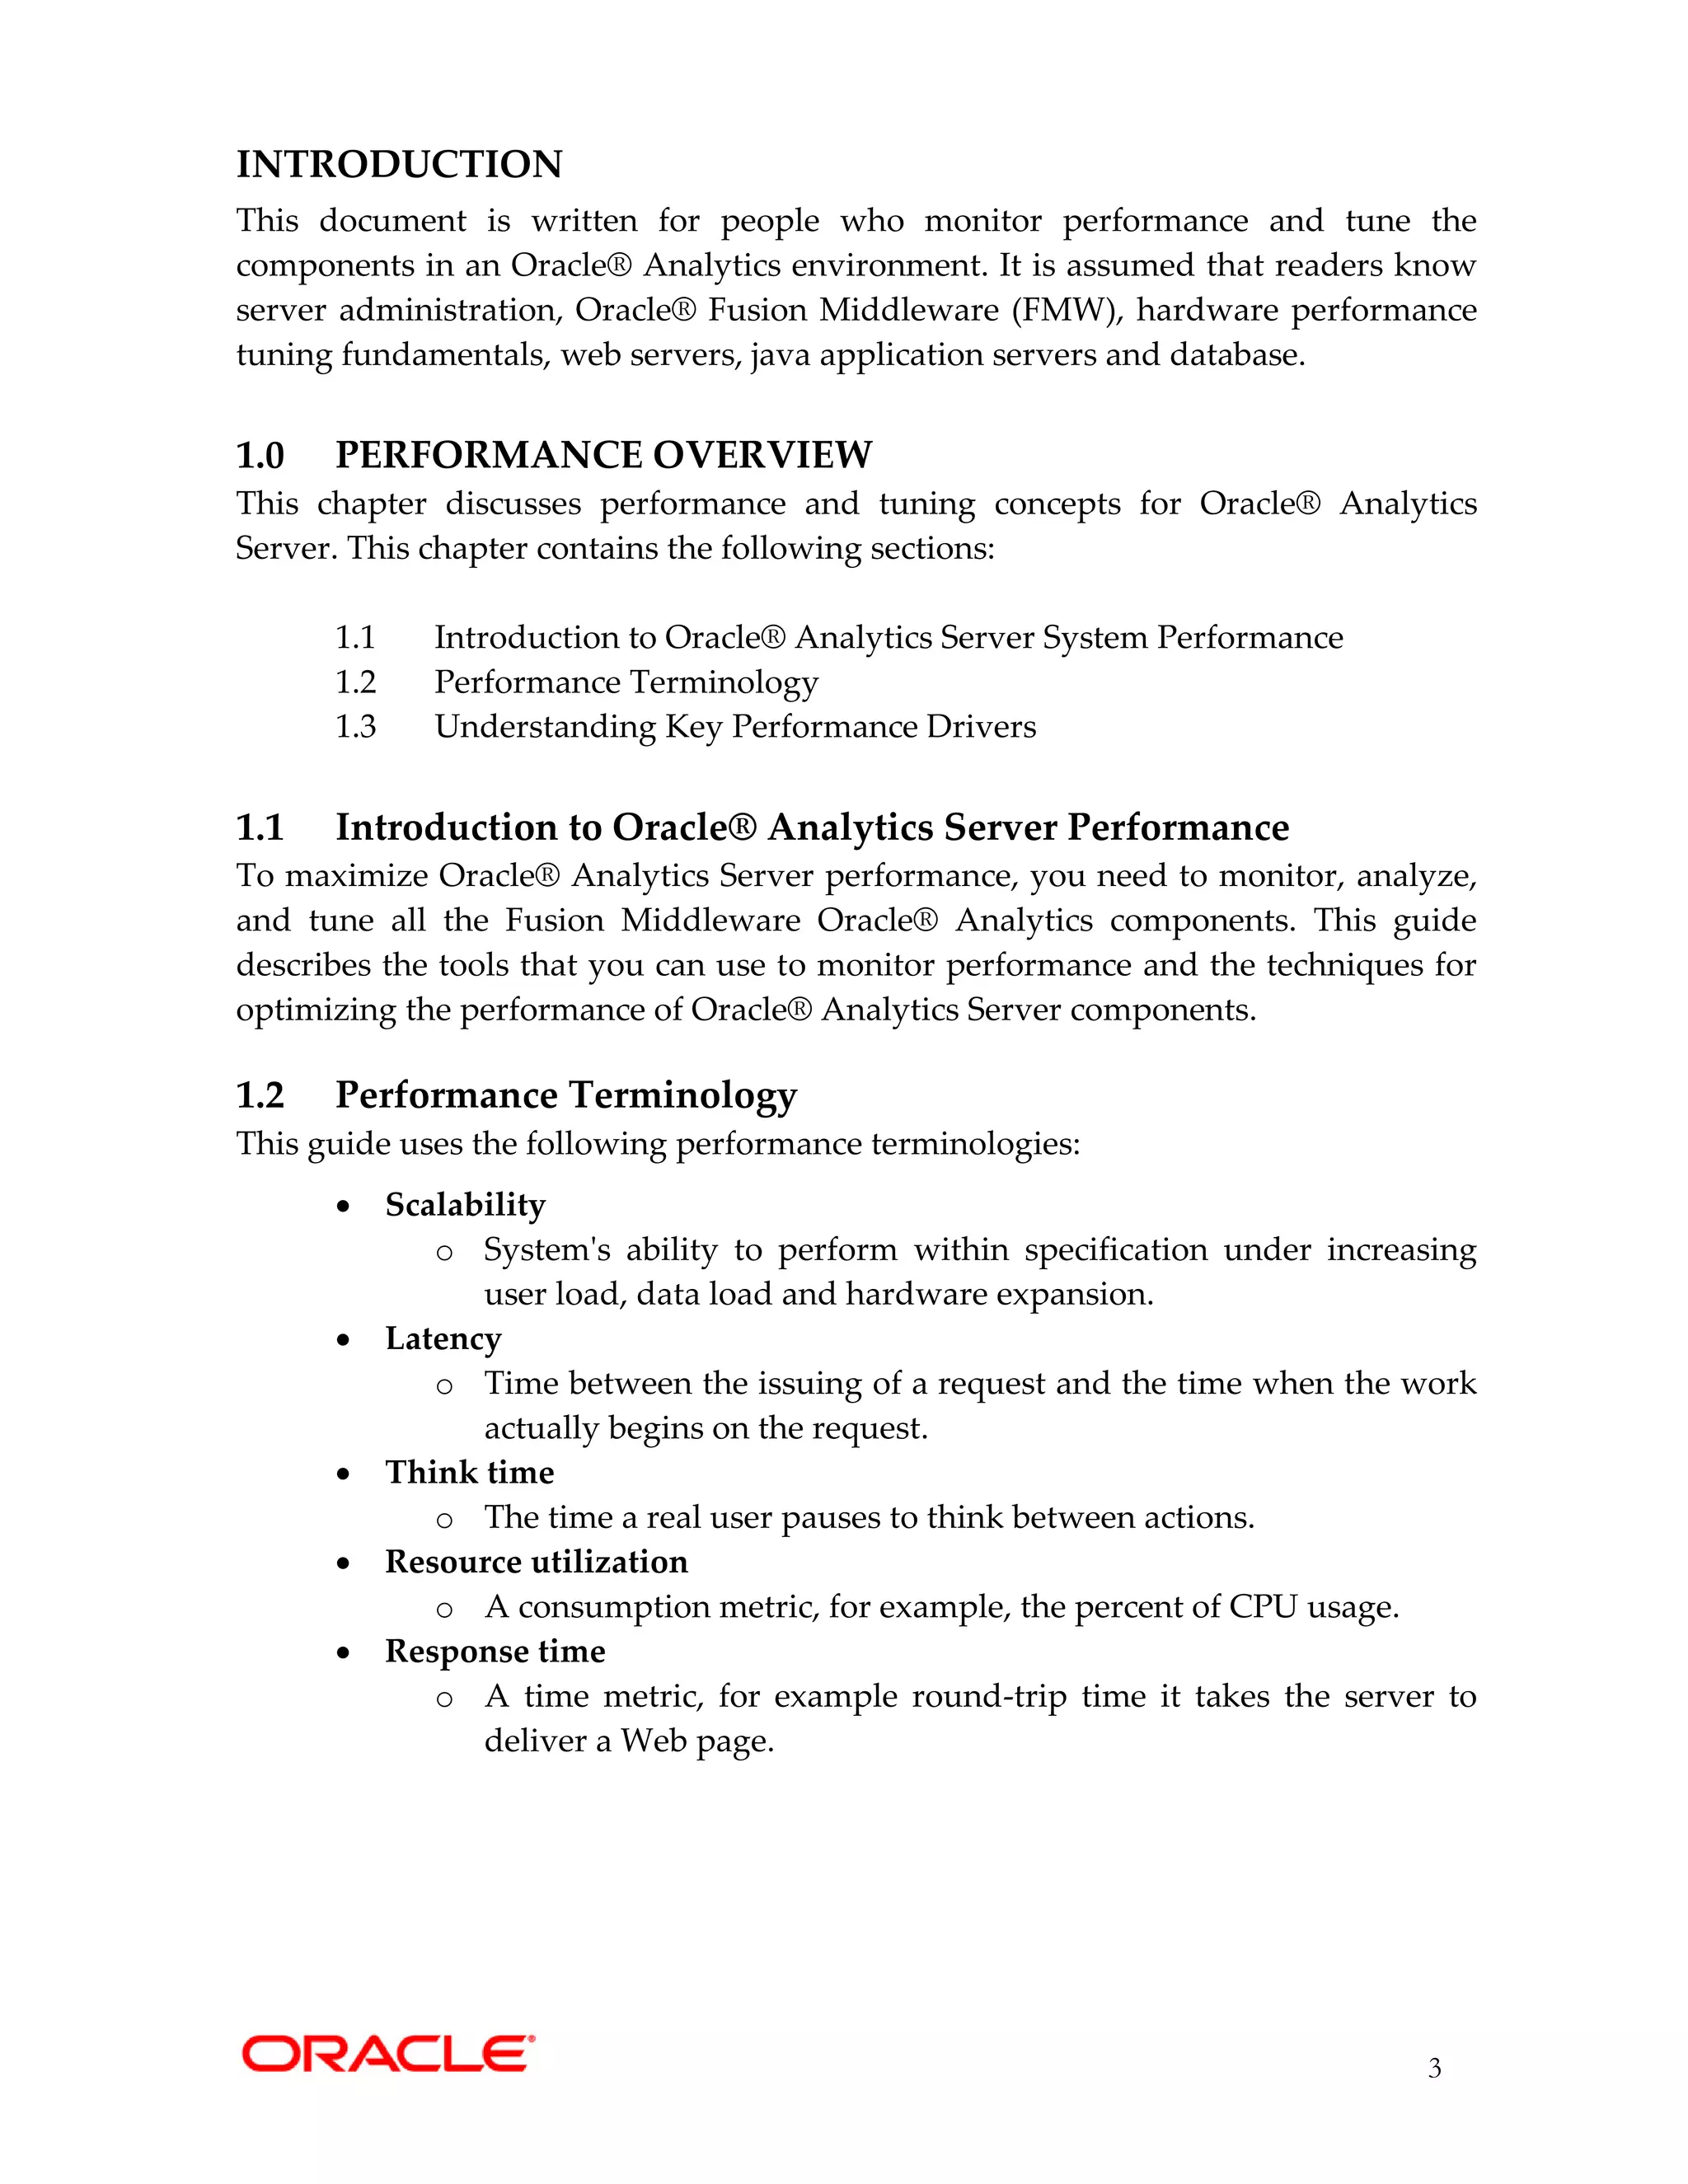
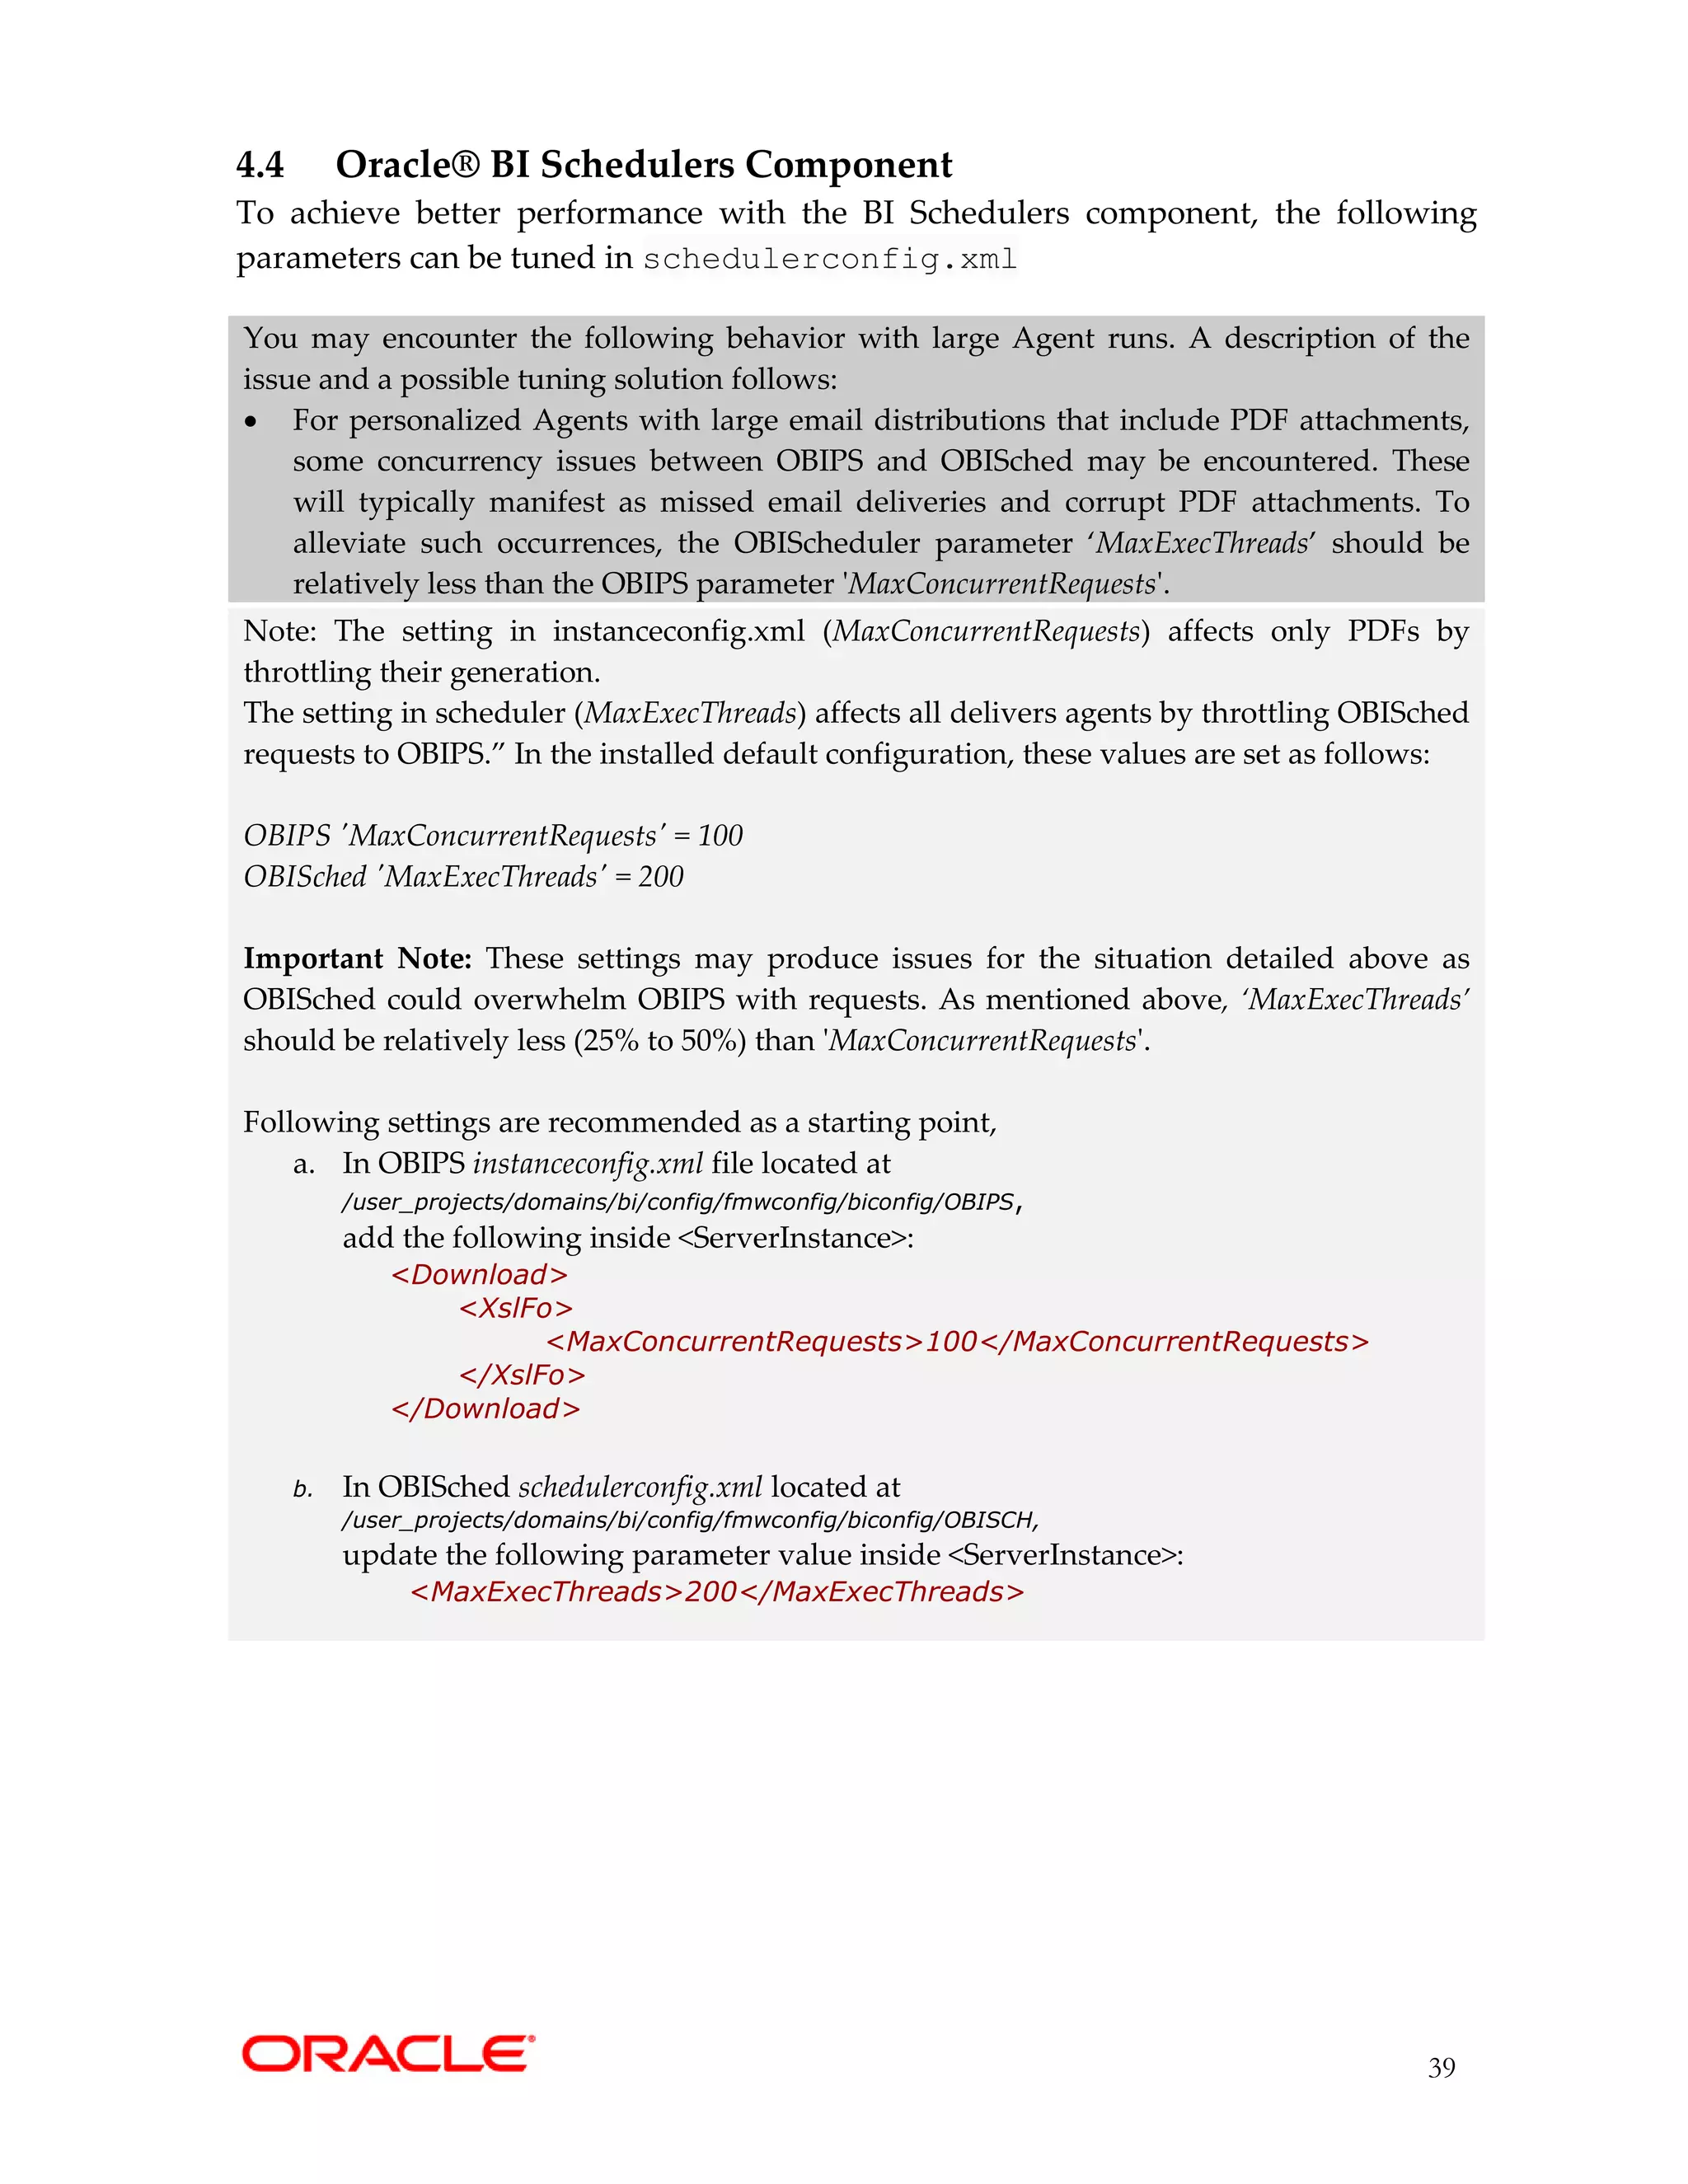
4.2 Oracle® BI Server Component
The following are the important parameters to tune in the NQSConfig.INI file and
will increase the performance of the BI system under high users’ load:
Initialization blocks
• Repository Init-blocks: Called once during server startup and refreshed as needed
after the refresh interval.
• Session Init-blocks: called for each new session; slow SQL can slow down login.
Use Allow deferred execution option. If you select this option, execution of the
initialization block is deferred until an associated session variable is accessed for
the first time during the session. This option prevents execution of all session
variable initialization blocks during the session logon stage, giving a shorter
logon time. Session variables that are not needed during the session do not have
their initialization blocks executed. This saves the resources which would have
been used to execute these unnecessary initialization blocks. See “When Execution
of Session Variable Initialization Blocks Cannot Be Deferred” in Managing
Metadata Repositories for Oracle Analytics Server guide.
Number of Init Blocks
For a given session, Init Block queries are executed serially and represent the per session
memory costs. Be judicious in creating Init Blocks and disable unwanted init-blocks as
slow SQL will slow down login. Verify that the same Init Block query is not already being
used in some other Init Block. Verify that cache is enabled for the Init Block and is being
utilized.
Parallel Init-blocks execution should be enabled (default serial):
Add below parameter under SECURITY section in NQSConfig.INI:
[SECURITY]
NUM_INIT_BLOCK_THREADS_PER_USER = 4;
Init block connection pool and location of data source
As a practice, allocate a separate DB connection pool for Init Blocks [ensure enough
connections are available] in the OBIS repository. Init Block query response time will be
high if the connection pool points to a remote database.
Init Blocks Cache
• The number of Init Block result sets that are cached with respect to row-wise
initialization, can be tuned.
• NQSConfig.INI parameter:
[SERVER]
INIT_BLOCK_CACHE_ENTRIES = 5000](https://image.slidesharecdn.com/oracleanalyticsserverinfrastructuretuningguidev2-221108055655-98945680/75/Oracle-Analytics-Server-Infrastructure-Tuning-guide-v2-pdf-32-2048.jpg)
![33
BI Database Connection Pool Settings - If you anticipate a higher load on a system, you
can change the number of maximum connections for various data sources to make
resource use more efficient. The maximum connection size needs to be set in the
repository (RPD) for each DB connection pool. The size of the connection pool determines
the number of available BI Server connections and the number of available threads for
processing physical queries. A logical query may generate multiple physical queries, each
of which could go to different connections.
Use OBIS performance counters in EM to determine if more or fewer DB connections are
required. For a simple sizing calculation, let’s assume there are peak N users concurrently
downloading dashboard pages. On average, each dashboard page executes L logical queries. On
average, each logical query executes P physical queries. Then the number of DB connections
required for this load would be N * L * P.
Important Note: If fewer connections are specified, then physical query response times will
increase.
Tuning of OBI Server session and threads
• NQSConfig.INI parameters to be tuned:
[SERVER]
MAX_SESSION_LIMIT = 2000;
#The above parameters specifies the number of sessions that can be connected to BI
#Server even if inactive. The sessions and the corresponding queries are queued to the
#threads for processing as they become available. Typically, the number of sessions
#specified by MAX_SESSION_LIMIT is higher than the number of available threads
#specified by SERVER_THREAD_RANGE. Set the MAX_SESSION_LIMIT to a value
#that reflects the maximum number of users per node + 10% for sessions yet to be
#timed-out.
SERVER_THREAD_RANGE = 80-1000;
#The above parameter specifies the number of threads that process the logical
#queries—the number of queries that can be active in the BI Server at any time. When
#the number of required threads goes beyond 80, threads will be created and
#destroyed as on a demand basis. For a typical OAS implementation, a setting of 80-
#1000 is sufficient. This value may be increased if load and stress tests prove more
#threads are beneficial for the throughput and response time of the BI Server.
DB_GATEWAY_THREAD_RANGE = 80-1000;
#The parameter DB_GATEWAY_THREAD_RANGE in the Server section of
#NQSConfig.INI establishes when Oracle BI Server terminates idle threads. The
#lower number in the range is the number of threads that are kept open before Oracle
#BI Server takes action. If the number of open threads exceeds the low point in the
#range, Oracle BI Server terminates idle threads. For example, if
#DB_GATEWAY_THREAD_RANGE is set to 80-100and 175 threads are open, Oracle
#BI Server terminates any idle threads back down to the 80 minimum thread limit.](https://image.slidesharecdn.com/oracleanalyticsserverinfrastructuretuningguidev2-221108055655-98945680/75/Oracle-Analytics-Server-Infrastructure-Tuning-guide-v2-pdf-33-2048.jpg)
![34
See "A NQSConfig.INI File Configuration Settings" in Administering Oracle Analytics
Server guide.
Aggregate tables: It is extremely important to use aggregate tables to improve query
performance. Aggregate tables contain pre-calculated summarizations of data. It is much
faster to retrieve an answer from an aggregate table than to re-compute the answer from
thousands of rows of detail.
The Oracle BI Server uses aggregate tables automatically, if they've been properly
specified in the repository. See Managing Metadata Repositories Guide for Oracle Analytics
Server for examples of setting up aggregate navigation.
Query Plan Caching - The query plan cache is an internal performance feature that
increases the speed of the query compilation process by caching plans for the most
recently used queries.
• When the Query Plan cache is hit :
o It eliminates query parsing time.
o It increases scalability due to less lock contention.
• Never set the query plan cache size to 0. Doing so may cause Result Cache misses.
• NQSConfig.INI parameters to be tuned:
[SERVER]
MAX_QUERY_PLAN_CACHE_ENTRIES = 1024; # default is 1024
MAX_QUERY_PLAN_CACHE_ENTRY_SIZE = 0; # 0 for default
Note: Based on testing you need to put in the right value for your system, see
"NQSConfig.INI File Configuration Settings" in Administering Oracle Analytics Server
guide for more information about query caching concepts and setup.
Query Results Caching
• One of the main advantages of query caching is the improvement of query
performance. It might be valuable to seed the cache during off hours by running
queries and hence causing the server to cache their results.
• The number of cache entries and disk size limit for the cache can be configured.
• Note parameters can be managed by either Fusion Middleware Control or by editing
NQSConfig.INI. NQSConfig.INI parameters to be tuned:
[CACHE]
ENABLE = YES;
MAX_ROWS_PER_CACHE_ENTRY = 100000; #Too many rows in cache can slow down performance
#This Configuration setting is managed by Oracle Analytics Server Enterprise Manager
MAX_CACHE_ENTRY_SIZE = 40 MB;
#This Configuration setting is managed by Oracle Analytics Server Enterprise Manager
MAX_CACHE_ENTRIES = 5000;
POPULATE_AGGREGATE_ROLLUP_HITS = YES;
#Above parameter specifies whether to aggregate data from earlier cached query
#results set and create a new entry in the query cache for rollup cache hits. The](https://image.slidesharecdn.com/oracleanalyticsserverinfrastructuretuningguidev2-221108055655-98945680/75/Oracle-Analytics-Server-Infrastructure-Tuning-guide-v2-pdf-34-2048.jpg)
![35
#default value is NO. When this parameter is set to YES, then when a query gets an
#aggregate rollup hit, the result is put into the cache. Setting this parameter to YES might
#result in better performance but results in more entries being added to the cache.
You can configure the Oracle BI Server to maintain a local, disk-based cache of query
result sets (query cache). The query cache allows the Oracle BI Server to satisfy many
subsequent query requests without having to access back-end data sources (such as
Oracle Database). This reduction in communication costs can dramatically decrease query
response time. See "About the Oracle BI Server Query Cache" in the Administering Oracle
Analytics Server guide.
Read-Only Mode - Permits or forbids changing Oracle BI repository files when the
Administration Tool is in either online or offline mode. The default is NO, meaning that
repositories can be edited.
• Makes the repository read-only so that online updates cannot be made.
• Increased scalability due to less lock contention
• NQSConfig.INI parameters to be tuned via EM Console:
[SERVER]
# This Configuration setting is managed by Oracle Analytics Server Enterprise Manager
READ_ONLY_MODE = YES;
See "A NQSConfig.INI File Configuration Settings" in Administering Oracle Analytics
Server guide.
Improve sort efficiency by increasing sort buffer
• It helps to have the sort directory on a fast disk (e.g. a RAMDisk)
• NQSConfig.INI parameters to be tuned:
[GENERAL]
WORK_DIRECTORY_PATHS = "C:Temp"; /* /dev/shm on Linux */
#If a Memory Resident File System is not available, for optimum performance,
#temporary directories should reside on local high performance storage devices (i.e.
#SSD, SAN).
SORT_MEMORY_SIZE = 64 MB;
SORT_BUFFER_INCREMENT_SIZE = 256 KB;
Cluster aware Cache seeding (using nqcmd or Agent)
• Seeding one node propagates across cluster
• Data from shared location is pulled into local cache location during every poll
• NQSConfig.INI parameters to be tuned:
[CACHE]
# This Configuration setting is managed by Oracle Analytics Server Enterprise Manager
GLOBAL_CACHE_STORAGE_PATH = "<shared directory name>" SIZE;
# This Configuration setting is managed by Oracle Analytics Server Enterprise Manager
MAX_GLOBAL_CACHE_ENTRIES = 5000;](https://image.slidesharecdn.com/oracleanalyticsserverinfrastructuretuningguidev2-221108055655-98945680/75/Oracle-Analytics-Server-Infrastructure-Tuning-guide-v2-pdf-35-2048.jpg)


![OOW16 - Advanced Architectures for Oracle E-Business Suite [CON6705]](https://cdn.slidesharecdn.com/ss_thumbnails/con6705-elkephelps-advanced-architectures-for-oracle-e-business-suite-160930182612-thumbnail.jpg?width=640&height=640&fit=bounds)