Explain what isa TREE DIAGRAM, its uses with examples and
a case study
OPERATIONS MANAGEMENT
JEYASREE SB , AUG - 2024
2.
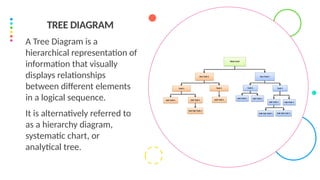
A Tree Diagramis a
hierarchical representation of
information that visually
displays relationships
between different elements
in a logical sequence.
It is alternatively referred to
as a hierarchy diagram,
systematic chart, or
analytical tree.
TREE DIAGRAM
3.
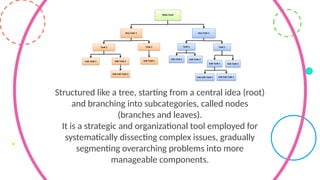
Structured like atree, starting from a central idea (root)
and branching into subcategories, called nodes
(branches and leaves).
It is a strategic and organizational tool employed for
systematically dissecting complex issues, gradually
segmenting overarching problems into more
manageable components.
4.
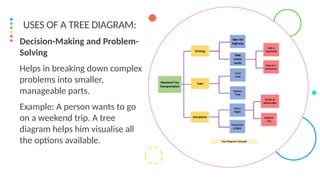
Decision-Making and Problem-
Solving
Helpsin breaking down complex
problems into smaller,
manageable parts.
Example: A person wants to go
on a weekend trip. A tree
diagram helps him visualise all
the options available.
USES OF A TREE DIAGRAM:
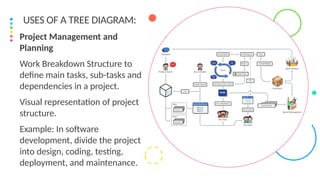
5.
Project Management and
Planning
WorkBreakdown Structure to
define main tasks, sub-tasks and
dependencies in a project.
Visual representation of project
structure.
Example: In software
development, divide the project
into design, coding, testing,
deployment, and maintenance.
USES OF A TREE DIAGRAM:
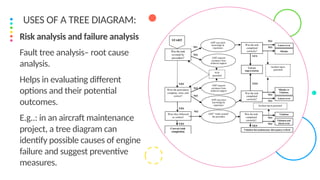
6.
Risk analysis andfailure analysis
Fault tree analysis– root cause
analysis.
Helps in evaluating different
options and their potential
outcomes.
E.g..: in an aircraft maintenance
project, a tree diagram can
identify possible causes of engine
failure and suggest preventive
measures.
USES OF A TREE DIAGRAM:
7.
Quality Control andProcess
Improvement
TQM and Six Sigma to identify
causes of defects in
manufacturing.
Identifying bottlenecks and
pinpoint areas of improvement.
E.g..: A company facing frequent
product defects can use a tree
diagram to analyse root causes.
USES OF A TREE DIAGRAM:
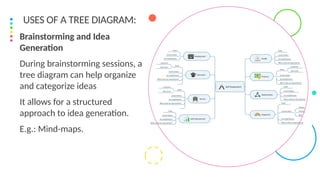
8.
Brainstorming and Idea
Generation
Duringbrainstorming sessions, a
tree diagram can help organize
and categorize ideas
It allows for a structured
approach to idea generation.
E.g.: Mind-maps.
USES OF A TREE DIAGRAM:
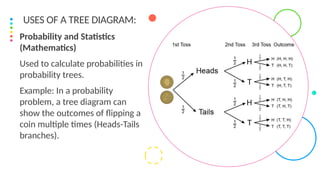
9.
Probability and Statistics
(Mathematics)
Usedto calculate probabilities in
probability trees.
Example: In a probability
problem, a tree diagram can
show the outcomes of flipping a
coin multiple times (Heads-Tails
branches).
USES OF A TREE DIAGRAM:
10.
Background: A multinationalFMCG company faced
supply chain disruptions due to delayed deliveries and
high transportation costs.
Problem Statement: The company needed to identify
the root causes of these inefficiencies and optimize its
supply chain.
Case Study: Tree Diagram in Supply Chain
Management
11.
Supply Chain Issues
TransportationWarehousing Demand Forecasting
High
Cost
Delays Space
Dama
ge
Over-
stock
Stock-
out
Inefficient route
planning
GPS route
optimisation
Poor inventory
management
Just-in-time stocking
Incorrect sales
predictions
AI based tools
12.
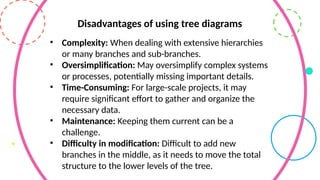
• Complexity: Whendealing with extensive hierarchies
or many branches and sub-branches.
• Oversimplification: May oversimplify complex systems
or processes, potentially missing important details.
• Time-Consuming: For large-scale projects, it may
require significant effort to gather and organize the
necessary data.
• Maintenance: Keeping them current can be a
challenge.
• Difficulty in modification: Difficult to add new
branches in the middle, as it needs to move the total
structure to the lower levels of the tree.
Disadvantages of using tree diagrams