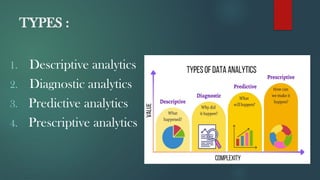
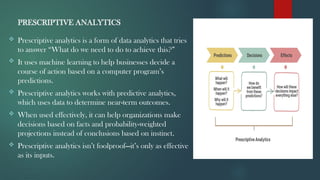
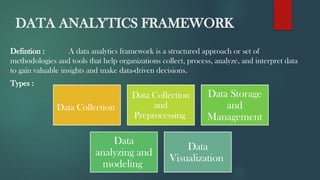
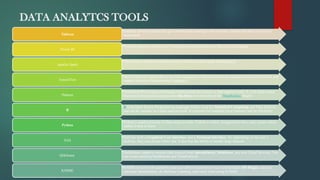
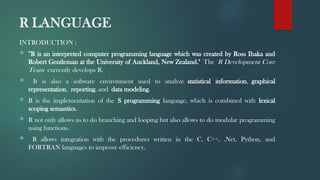
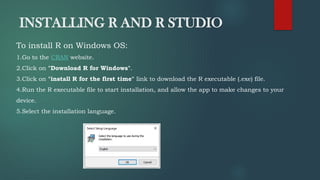
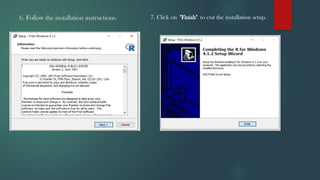
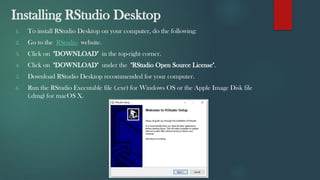
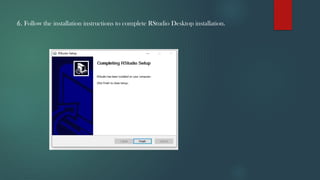
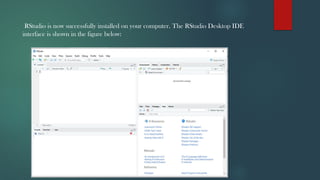
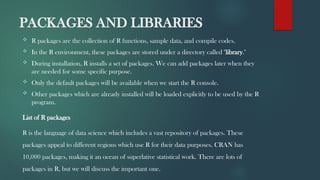
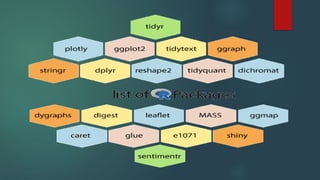
DATA ANALYTICS
PRESENTATION BY :
MRS. P. GAYATHRI M.E (CSE)
DEPARTMENT OF AI & DS  IT,
VET IAS,
Syllabus
Introduction Data Analytics – Data Analysis Vs Data Analytics –
Data Analytics : Types - Data Analytics : Framework – Data
Analytics : Tool - R language - Understanding R -features -
Installing R and R Studio – Packages and Library.
INTRODUCTION
Data Analytics is the :
 Science of analyzing raw data to make conclusions about that
information.
 Data analytics help a business optimize its performance, perform more
efficiently, maximize profit, or make more strategically-guided decisions.
 The techniques and processes of data analytics have been automated
into mechanical processes and algorithms that work over raw data for
human consumption.
 Data analytics relies on a variety of software tools including spreadsheets,
data visualization, reporting tools, data mining programs, and open-
source languages.
DATA ANALYTICS Vs DATA ANALYSIS
TYPES :
1. Descriptive analytics
2. Diagnostic analytics
3. Predictive analytics
4. Prescriptive analytics
DESCRIPTIVE ANALYTICS
 Descriptive analytics is the process of parsing
historical data to better understand the changes that
occur in a business.
 Using a range of historic data and benchmarking,
decision-makers obtain a holistic view of
performance and trends on which to base business
strategy.
 Descriptive analytics can help to identify the areas of
strength and weakness in an organization.
 Examples of metrics used in descriptive analytics
include year-over-year pricing changes, month-over-
month sales growth, the number of users, or the
total revenue per subscriber.
 Descriptive analytics is used in conjunction with
newer analytics, such as predictive and prescriptive
analytics.
DIAGNOSTIC ANALYTICS
 Finding the root cause: Identify the main drivers influencing
events, problems, or successes.
 Identifying and resolving issues: By pinpointing the factors
that contributed to an issue, you can fix the problems and
prevent them from reoccurring.
 Improving processes: Insights can highlight inefficiencies or
bottlenecks so you can optimize workflows and operations.
 Evaluating performance: Assess the effectiveness of
strategies, campaigns, or initiatives by analyzing what worked
well and what didn’t.
 Validating hypotheses: Test your hypotheses against actual
data to validate or refine your understanding.
PREDICTIVE ANALYTICS  Industries from insurance to marketing use predictive
techniques to make important decisions.
 Predictive models help make weather forecasts,
develop video games, translate voice-to-text messages,
make customer service decisions, and develop
investment portfolios.
 Predictive analytics determines a likely outcome based
on an examination of current and historical data.
 Decision trees, regression, and neural networks all are
types of predictive models.
 People often confuse predictive analytics with machine
learning even though the two are different disciplines.
PRESCRIPTIVE ANALYTICS
 Prescriptive analytics is a form of data analytics that tries
to answer “What do we need to do to achieve this?”
 It uses machine learning to help businesses decide a
course of action based on a computer program’s
predictions.
 Prescriptive analytics works with predictive analytics,
which uses data to determine near-term outcomes.
 When used effectively, it can help organizations make
decisions based on facts and probability-weighted
projections instead of conclusions based on instinct.
 Prescriptive analytics isn’t foolproof—it’s only as effective
as its inputs.
DATA ANALYTICS FRAMEWORK
Defintion : A data analytics framework is a structured approach or set of
methodologies and tools that help organizations collect, process, analyze, and interpret data
to gain valuable insights and make data-driven decisions.
Types :
Data Collection
Data Collection
and
Preprocessing
Data Storage
and
Management
Data
analyzing and
modeling
Data
Visualization
DATA ANALYTCS TOOLS
•Instantly develop visuals that give context and meaning to the raw data, making the data very easy to
understand
Tableau
•Provides enhanced Interactive Visualisation and capabilities of Business Intelligence.
Power BI
•The ability to handle enormous amounts of Data makes Spark distinguished.
Apache Spark
•the first choice of many due to its wide recognition, which results in an adequate amount of tutorials, and
support for many Programming Languages.
TensorFlow
•Distributed Processing and Storage Solution and also used as a data analysis tools. It is an open-source
framework that stores and processes Big Data with the help of the MapReduce Model
Hadoop
•R is an Open Source Programming language widely used for Statistical Computing and Data Analysis
and can be consider as a data analysis tools. It is known for handling large Datasets and its flexibility.
R
•Python is used extremely in Data analysis tools. Python is widely recognized to have easy syntax which
makes it easy to learn
Python
•SAS has both a Graphical User Interface and a Terminal Interface. So, depending on the user’s
skillsets, they can choose either one. It also has the ability to handle large datasets
SAS
•QuilkSense supports various Data sources from Spreadsheets, Databases, and also Cloud Services. You
can create amazing Dashboards and Visualisations.
QlikSense
•KNIME is built with scalability and also offers extensibility via a well-defined API Plugin. can also
automate Spreadsheets, do Machine Learning, and much more using KNIME.
KNIME
R LANGUAGE
INTRODUCTION :
 "R is an interpreted computer programming language which was created by Ross Ihaka and
Robert Gentleman at the University of Auckland, New Zealand." The R Development Core
Team currently develops R.
 It is also a software environment used to analyze statistical information, graphical
representation, reporting, and data modeling.
 R is the implementation of the S programming language, which is combined with lexical
scoping semantics.
 R not only allows us to do branching and looping but also allows to do modular programming
using functions.
 R allows integration with the procedures written in the C, C++, .Net, Python, and
FORTRAN languages to improve efficiency.
FEATURES OF R
Open
-
Sourc
e
Strong Ability to Design
Graphics
Extensive Range of Packages
Efficient in Software Development
Computing in a Distributed Environment
R Vs PYTHON PROGRAMMING
R PROGRAMMING
• R is a language and environment for
statistical programming which includes
statistical computing and graphics.
• It has many features which are useful for
statistical analysis and representation.
• It has many easy-to-use packages for
performing tasks
• Various popular R IDEs are Rstudio,
RKward, R commander, etc.
• here are many packages and libraries
like ggplot2, caret, etc.
PYTHON
• Python is a general-purpose
programming language for data analysis
and scientific computing
• It can be used to develop GUI
applications and web applications as
well as with embedded systems
• It can easily perform matrix
computation as well as optimization.
• Various popular Python IDEs are
Spyder, Eclipse+Pydev, Atom, etc
• ome essential packages and libraries
are Pandas, Numpy, Scipy, etc.
APPLICATION OF R PROGRAMMING
INSTALLING R AND R STUDIO
To install R on Windows OS:
1.Go to the CRAN website.
2.Click on "Download R for Windows".
3.Click on "install R for the first time" link to download the R executable (.exe) file.
4.Run the R executable file to start installation, and allow the app to make changes to your
device.
5.Select the installation language.
6. Follow the installation instructions. 7. Click on "Finish" to exit the installation setup.
Installing RStudio Desktop
1. To install RStudio Desktop on your computer, do the following:
2. Go to the RStudio website.
3. Click on "DOWNLOAD" in the top-right corner.
4. Click on "DOWNLOAD" under the "RStudio Open Source License".
5. Download RStudio Desktop recommended for your computer.
6. Run the RStudio Executable file (.exe) for Windows OS or the Apple Image Disk file
(.dmg) for macOS X.
6. Follow the installation instructions to complete RStudio Desktop installation.
RStudio is now successfully installed on your computer. The RStudio Desktop IDE
interface is shown in the figure below:
PACKAGES AND LIBRARIES
 R packages are the collection of R functions, sample data, and compile codes.
 In the R environment, these packages are stored under a directory called "library."
 During installation, R installs a set of packages. We can add packages later when they
are needed for some specific purpose.
 Only the default packages will be available when we start the R console.
 Other packages which are already installed will be loaded explicitly to be used by the R
program.
List of R packages
R is the language of data science which includes a vast repository of packages. These
packages appeal to different regions which use R for their data purposes. CRAN has
10,000 packages, making it an ocean of superlative statistical work. There are lots of
packages in R, but we will discuss the important one.
Data Analytic s (Unit -1).pRESENTATION .PPT

Data Analytic s (Unit -1).pRESENTATION .PPT

  • 1.
    DATA ANALYTICS PRESENTATION BY: MRS. P. GAYATHRI M.E (CSE) DEPARTMENT OF AI & DS IT, VET IAS,
  • 2.
    Syllabus Introduction Data Analytics– Data Analysis Vs Data Analytics – Data Analytics : Types - Data Analytics : Framework – Data Analytics : Tool - R language - Understanding R -features - Installing R and R Studio – Packages and Library.
  • 3.
    INTRODUCTION Data Analytics isthe :  Science of analyzing raw data to make conclusions about that information.  Data analytics help a business optimize its performance, perform more efficiently, maximize profit, or make more strategically-guided decisions.  The techniques and processes of data analytics have been automated into mechanical processes and algorithms that work over raw data for human consumption.  Data analytics relies on a variety of software tools including spreadsheets, data visualization, reporting tools, data mining programs, and open- source languages.
  • 4.
    DATA ANALYTICS VsDATA ANALYSIS
  • 5.
    TYPES : 1. Descriptiveanalytics 2. Diagnostic analytics 3. Predictive analytics 4. Prescriptive analytics
  • 6.
    DESCRIPTIVE ANALYTICS  Descriptiveanalytics is the process of parsing historical data to better understand the changes that occur in a business.  Using a range of historic data and benchmarking, decision-makers obtain a holistic view of performance and trends on which to base business strategy.  Descriptive analytics can help to identify the areas of strength and weakness in an organization.  Examples of metrics used in descriptive analytics include year-over-year pricing changes, month-over- month sales growth, the number of users, or the total revenue per subscriber.  Descriptive analytics is used in conjunction with newer analytics, such as predictive and prescriptive analytics.
  • 7.
    DIAGNOSTIC ANALYTICS  Findingthe root cause: Identify the main drivers influencing events, problems, or successes.  Identifying and resolving issues: By pinpointing the factors that contributed to an issue, you can fix the problems and prevent them from reoccurring.  Improving processes: Insights can highlight inefficiencies or bottlenecks so you can optimize workflows and operations.  Evaluating performance: Assess the effectiveness of strategies, campaigns, or initiatives by analyzing what worked well and what didn’t.  Validating hypotheses: Test your hypotheses against actual data to validate or refine your understanding.
  • 8.
    PREDICTIVE ANALYTICS Industries from insurance to marketing use predictive techniques to make important decisions.  Predictive models help make weather forecasts, develop video games, translate voice-to-text messages, make customer service decisions, and develop investment portfolios.  Predictive analytics determines a likely outcome based on an examination of current and historical data.  Decision trees, regression, and neural networks all are types of predictive models.  People often confuse predictive analytics with machine learning even though the two are different disciplines.
  • 9.
    PRESCRIPTIVE ANALYTICS  Prescriptiveanalytics is a form of data analytics that tries to answer “What do we need to do to achieve this?”  It uses machine learning to help businesses decide a course of action based on a computer program’s predictions.  Prescriptive analytics works with predictive analytics, which uses data to determine near-term outcomes.  When used effectively, it can help organizations make decisions based on facts and probability-weighted projections instead of conclusions based on instinct.  Prescriptive analytics isn’t foolproof—it’s only as effective as its inputs.
  • 10.
    DATA ANALYTICS FRAMEWORK Defintion: A data analytics framework is a structured approach or set of methodologies and tools that help organizations collect, process, analyze, and interpret data to gain valuable insights and make data-driven decisions. Types : Data Collection Data Collection and Preprocessing Data Storage and Management Data analyzing and modeling Data Visualization
  • 11.
    DATA ANALYTCS TOOLS •Instantlydevelop visuals that give context and meaning to the raw data, making the data very easy to understand Tableau •Provides enhanced Interactive Visualisation and capabilities of Business Intelligence. Power BI •The ability to handle enormous amounts of Data makes Spark distinguished. Apache Spark •the first choice of many due to its wide recognition, which results in an adequate amount of tutorials, and support for many Programming Languages. TensorFlow •Distributed Processing and Storage Solution and also used as a data analysis tools. It is an open-source framework that stores and processes Big Data with the help of the MapReduce Model Hadoop •R is an Open Source Programming language widely used for Statistical Computing and Data Analysis and can be consider as a data analysis tools. It is known for handling large Datasets and its flexibility. R •Python is used extremely in Data analysis tools. Python is widely recognized to have easy syntax which makes it easy to learn Python •SAS has both a Graphical User Interface and a Terminal Interface. So, depending on the user’s skillsets, they can choose either one. It also has the ability to handle large datasets SAS •QuilkSense supports various Data sources from Spreadsheets, Databases, and also Cloud Services. You can create amazing Dashboards and Visualisations. QlikSense •KNIME is built with scalability and also offers extensibility via a well-defined API Plugin. can also automate Spreadsheets, do Machine Learning, and much more using KNIME. KNIME
  • 12.
    R LANGUAGE INTRODUCTION : "R is an interpreted computer programming language which was created by Ross Ihaka and Robert Gentleman at the University of Auckland, New Zealand." The R Development Core Team currently develops R.  It is also a software environment used to analyze statistical information, graphical representation, reporting, and data modeling.  R is the implementation of the S programming language, which is combined with lexical scoping semantics.  R not only allows us to do branching and looping but also allows to do modular programming using functions.  R allows integration with the procedures written in the C, C++, .Net, Python, and FORTRAN languages to improve efficiency.
  • 13.
    FEATURES OF R Open - Sourc e StrongAbility to Design Graphics Extensive Range of Packages Efficient in Software Development Computing in a Distributed Environment
  • 14.
    R Vs PYTHONPROGRAMMING R PROGRAMMING • R is a language and environment for statistical programming which includes statistical computing and graphics. • It has many features which are useful for statistical analysis and representation. • It has many easy-to-use packages for performing tasks • Various popular R IDEs are Rstudio, RKward, R commander, etc. • here are many packages and libraries like ggplot2, caret, etc. PYTHON • Python is a general-purpose programming language for data analysis and scientific computing • It can be used to develop GUI applications and web applications as well as with embedded systems • It can easily perform matrix computation as well as optimization. • Various popular Python IDEs are Spyder, Eclipse+Pydev, Atom, etc • ome essential packages and libraries are Pandas, Numpy, Scipy, etc.
  • 15.
    APPLICATION OF RPROGRAMMING
  • 16.
    INSTALLING R ANDR STUDIO To install R on Windows OS: 1.Go to the CRAN website. 2.Click on "Download R for Windows". 3.Click on "install R for the first time" link to download the R executable (.exe) file. 4.Run the R executable file to start installation, and allow the app to make changes to your device. 5.Select the installation language.
  • 17.
    6. Follow theinstallation instructions. 7. Click on "Finish" to exit the installation setup.
  • 18.
    Installing RStudio Desktop 1.To install RStudio Desktop on your computer, do the following: 2. Go to the RStudio website. 3. Click on "DOWNLOAD" in the top-right corner. 4. Click on "DOWNLOAD" under the "RStudio Open Source License". 5. Download RStudio Desktop recommended for your computer. 6. Run the RStudio Executable file (.exe) for Windows OS or the Apple Image Disk file (.dmg) for macOS X.
  • 19.
    6. Follow theinstallation instructions to complete RStudio Desktop installation.
  • 20.
    RStudio is nowsuccessfully installed on your computer. The RStudio Desktop IDE interface is shown in the figure below:
  • 21.
    PACKAGES AND LIBRARIES R packages are the collection of R functions, sample data, and compile codes.  In the R environment, these packages are stored under a directory called "library."  During installation, R installs a set of packages. We can add packages later when they are needed for some specific purpose.  Only the default packages will be available when we start the R console.  Other packages which are already installed will be loaded explicitly to be used by the R program. List of R packages R is the language of data science which includes a vast repository of packages. These packages appeal to different regions which use R for their data purposes. CRAN has 10,000 packages, making it an ocean of superlative statistical work. There are lots of packages in R, but we will discuss the important one.