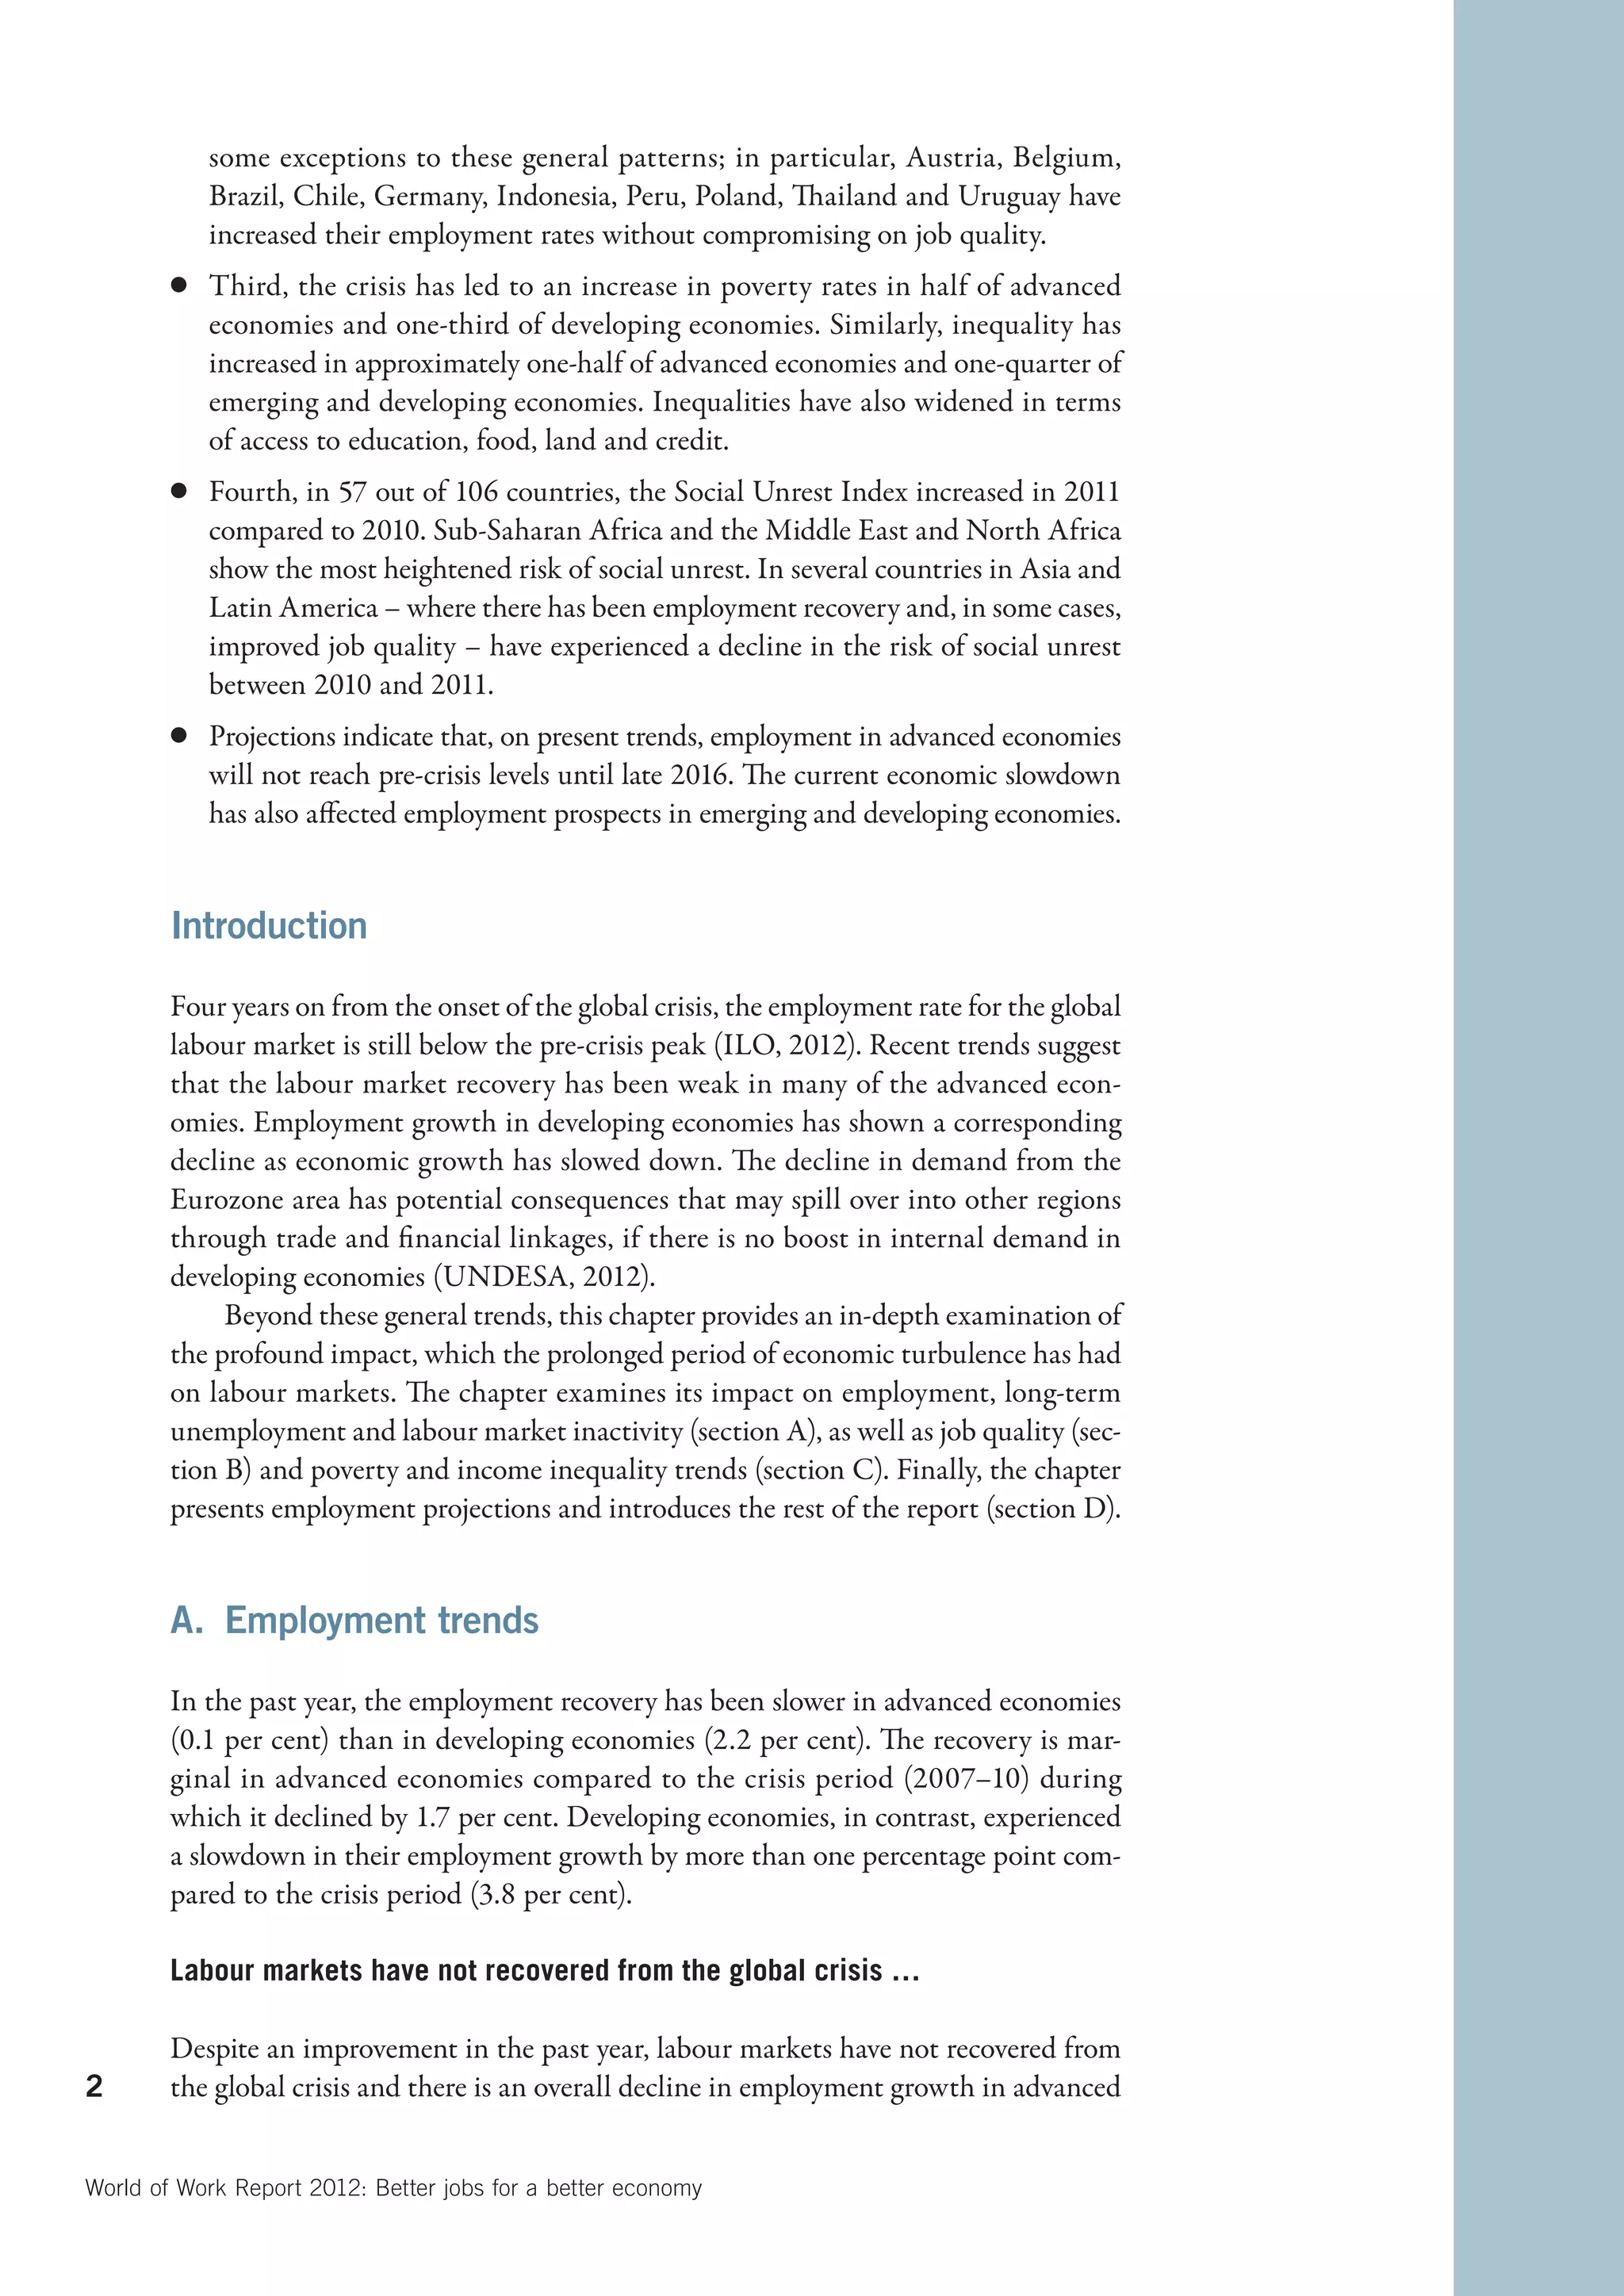
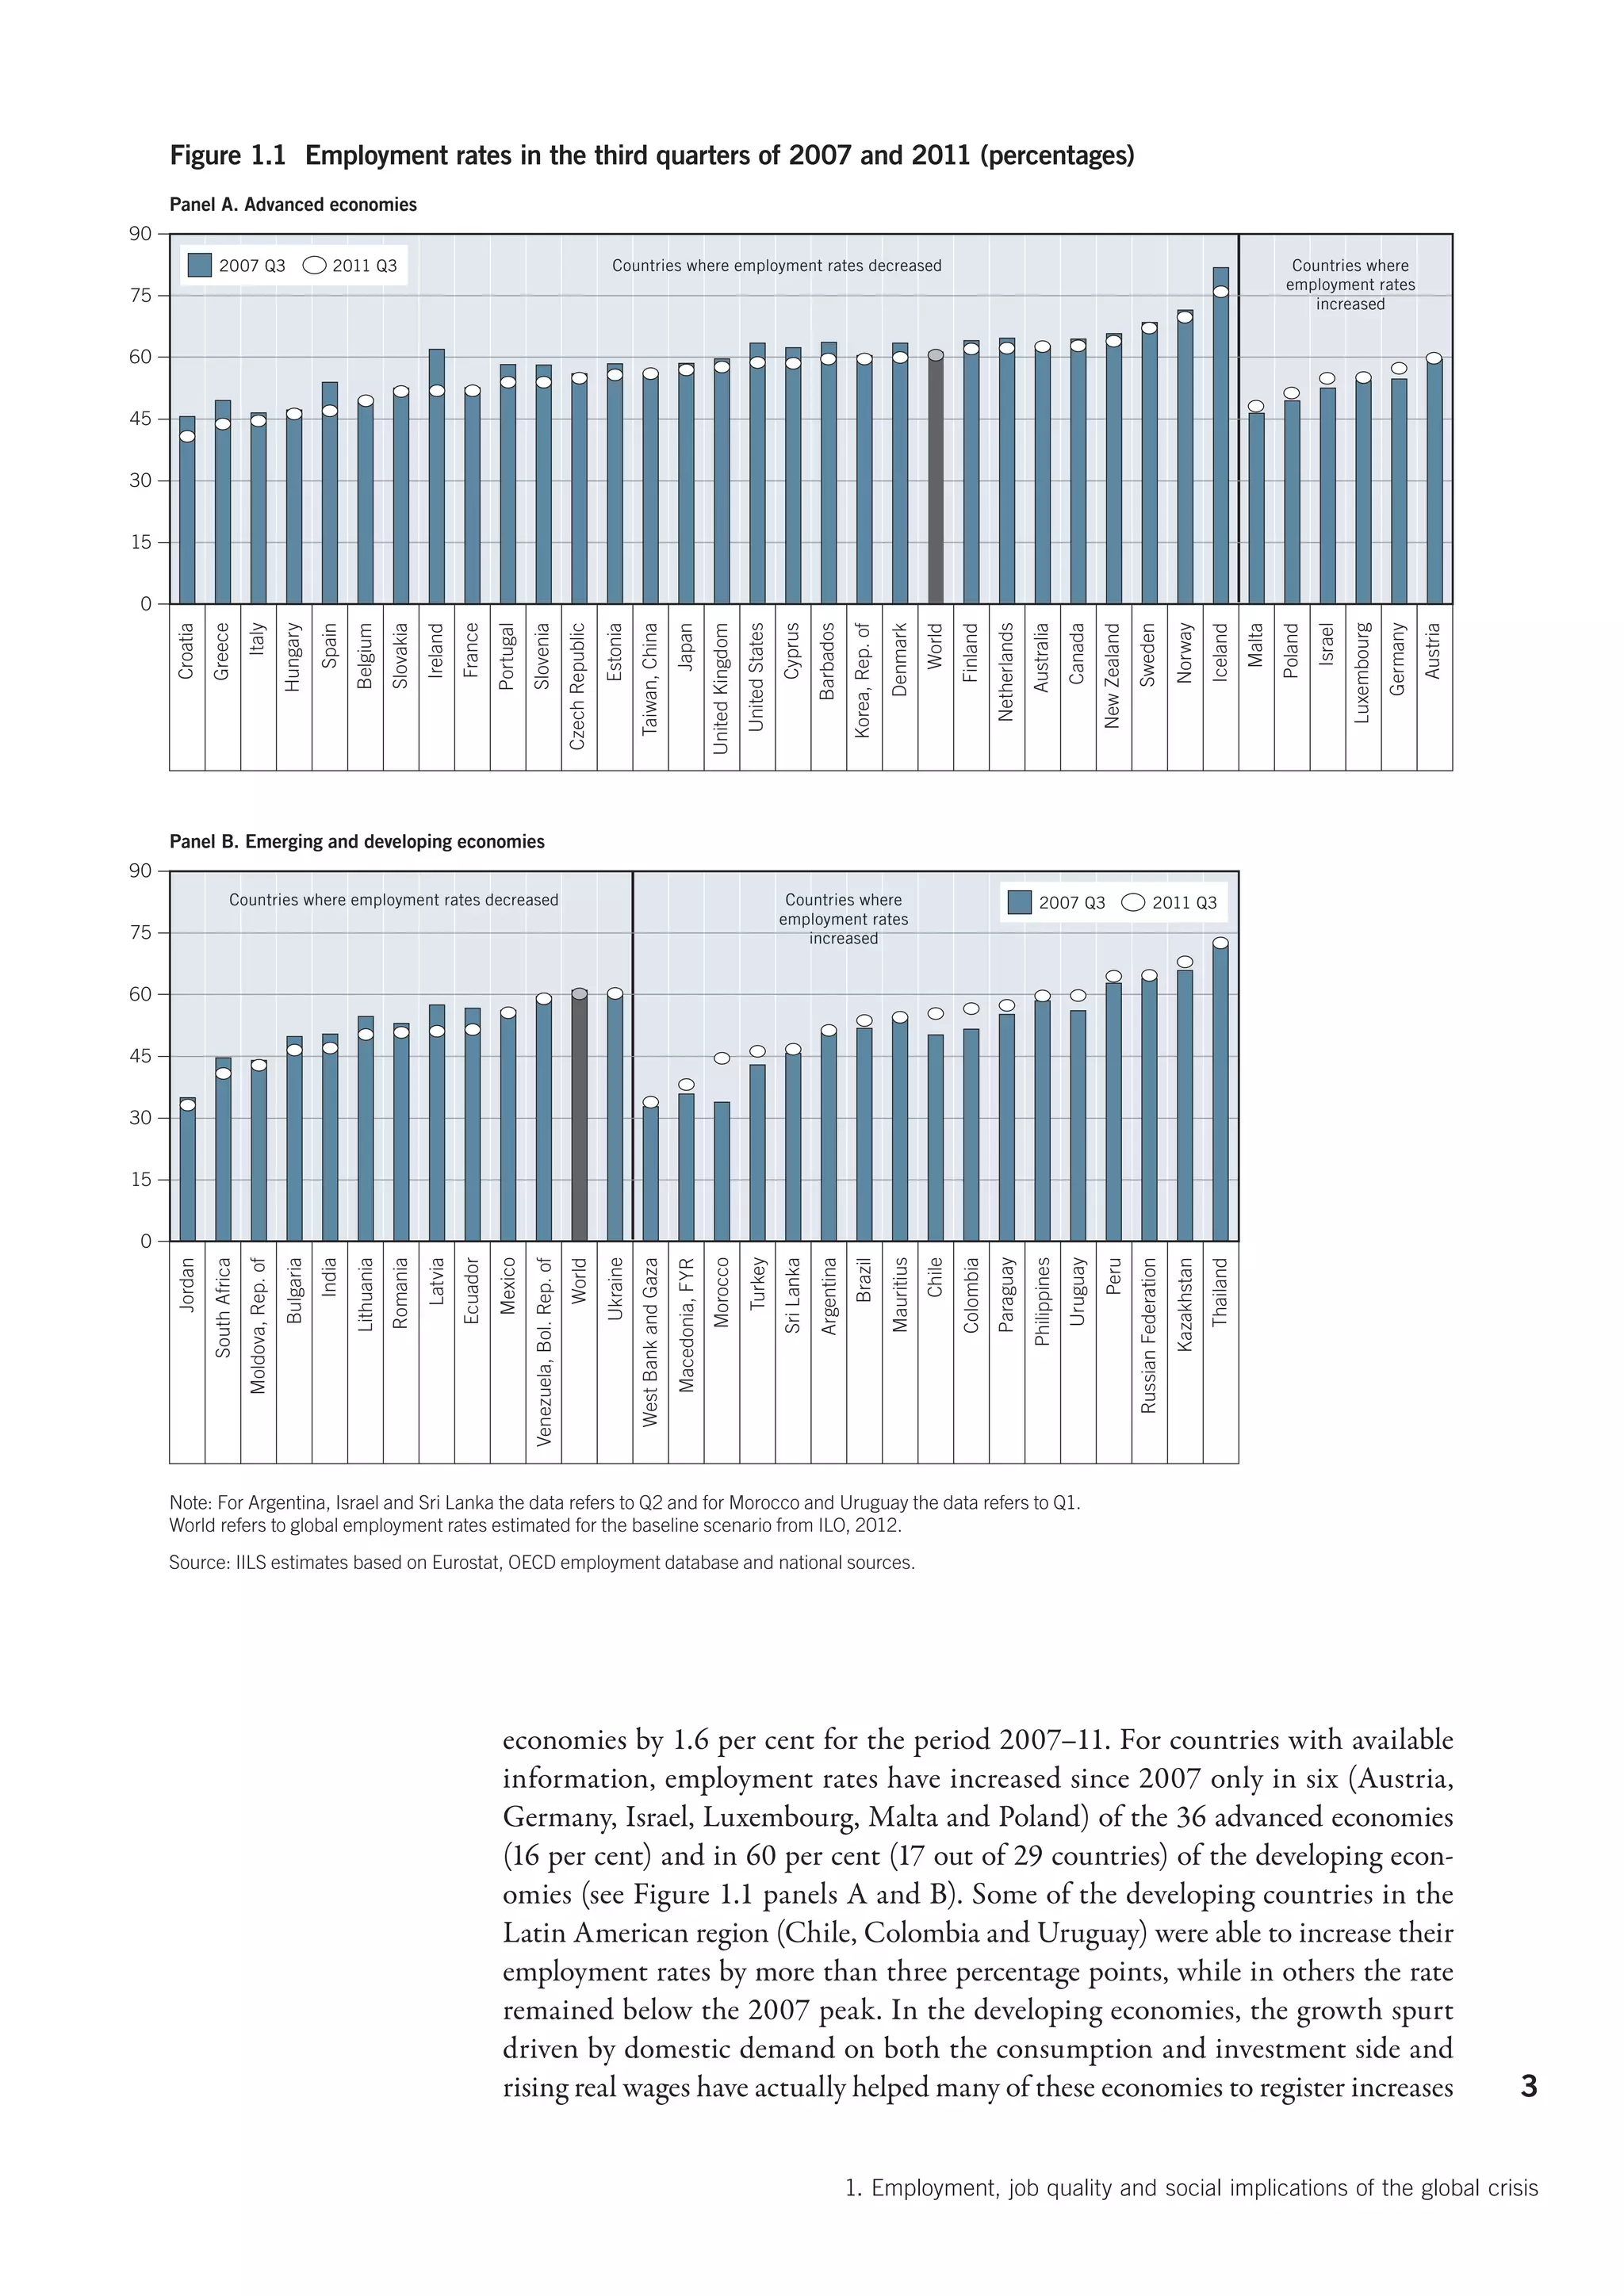
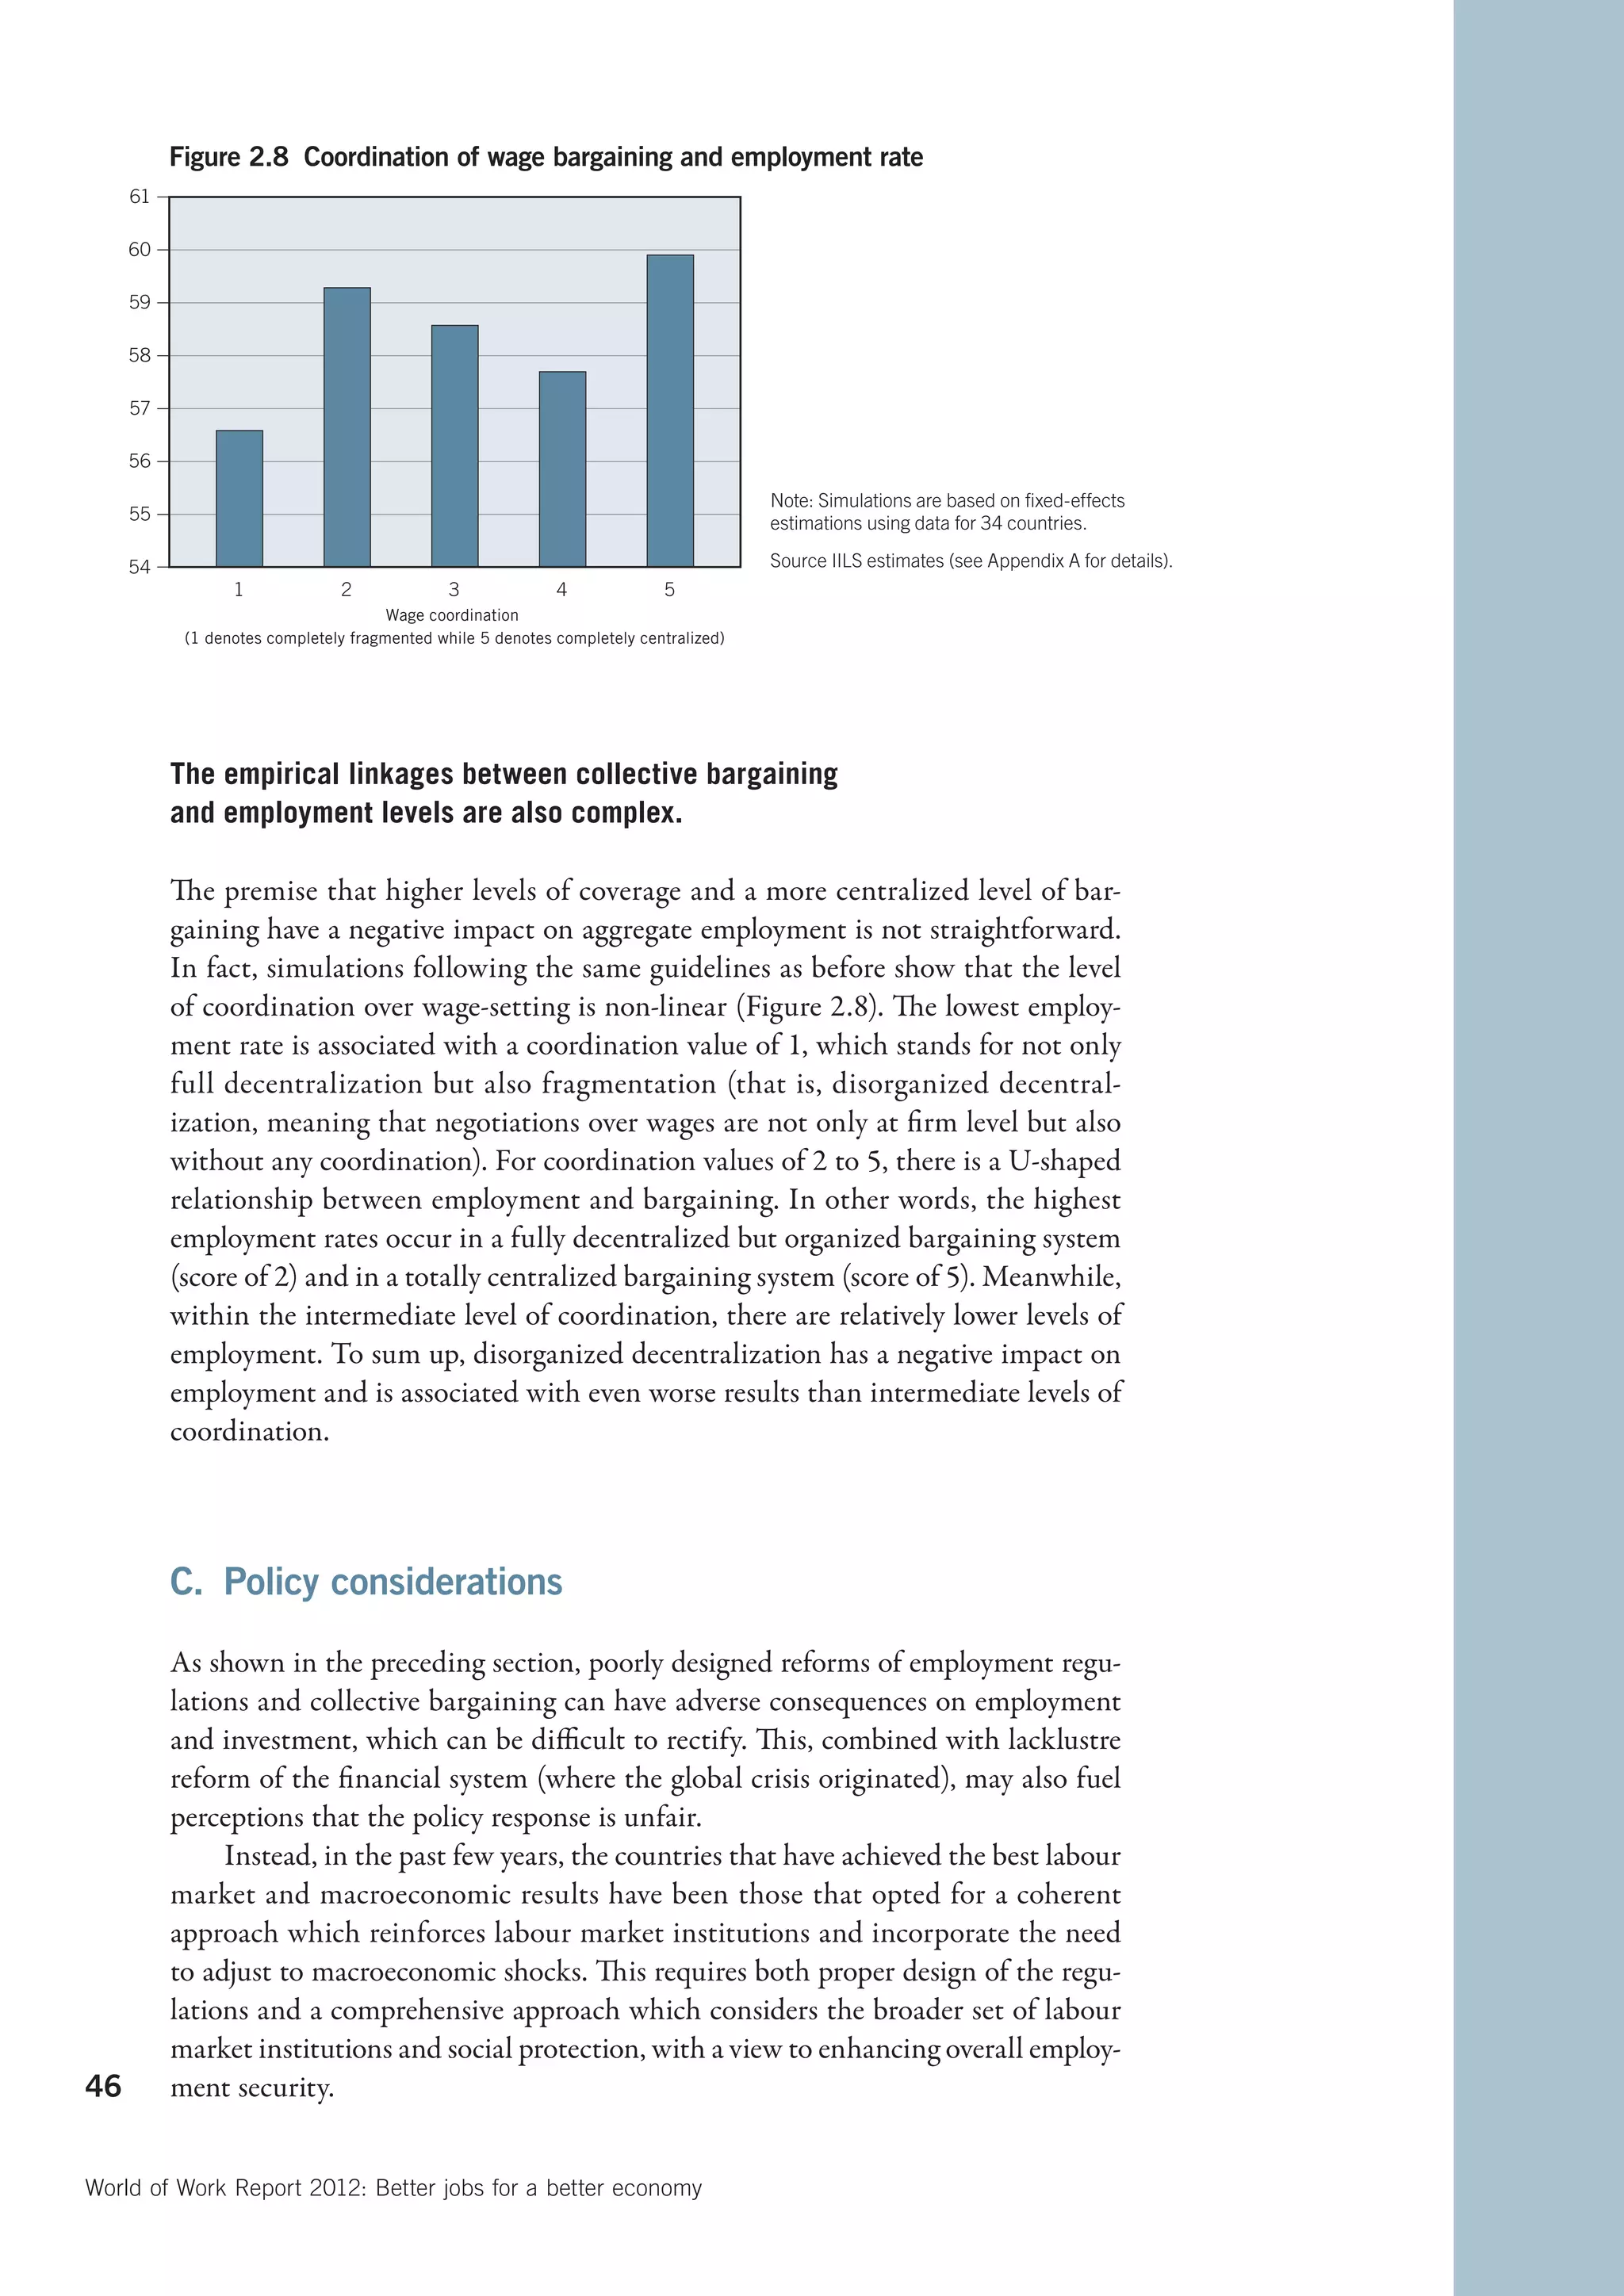
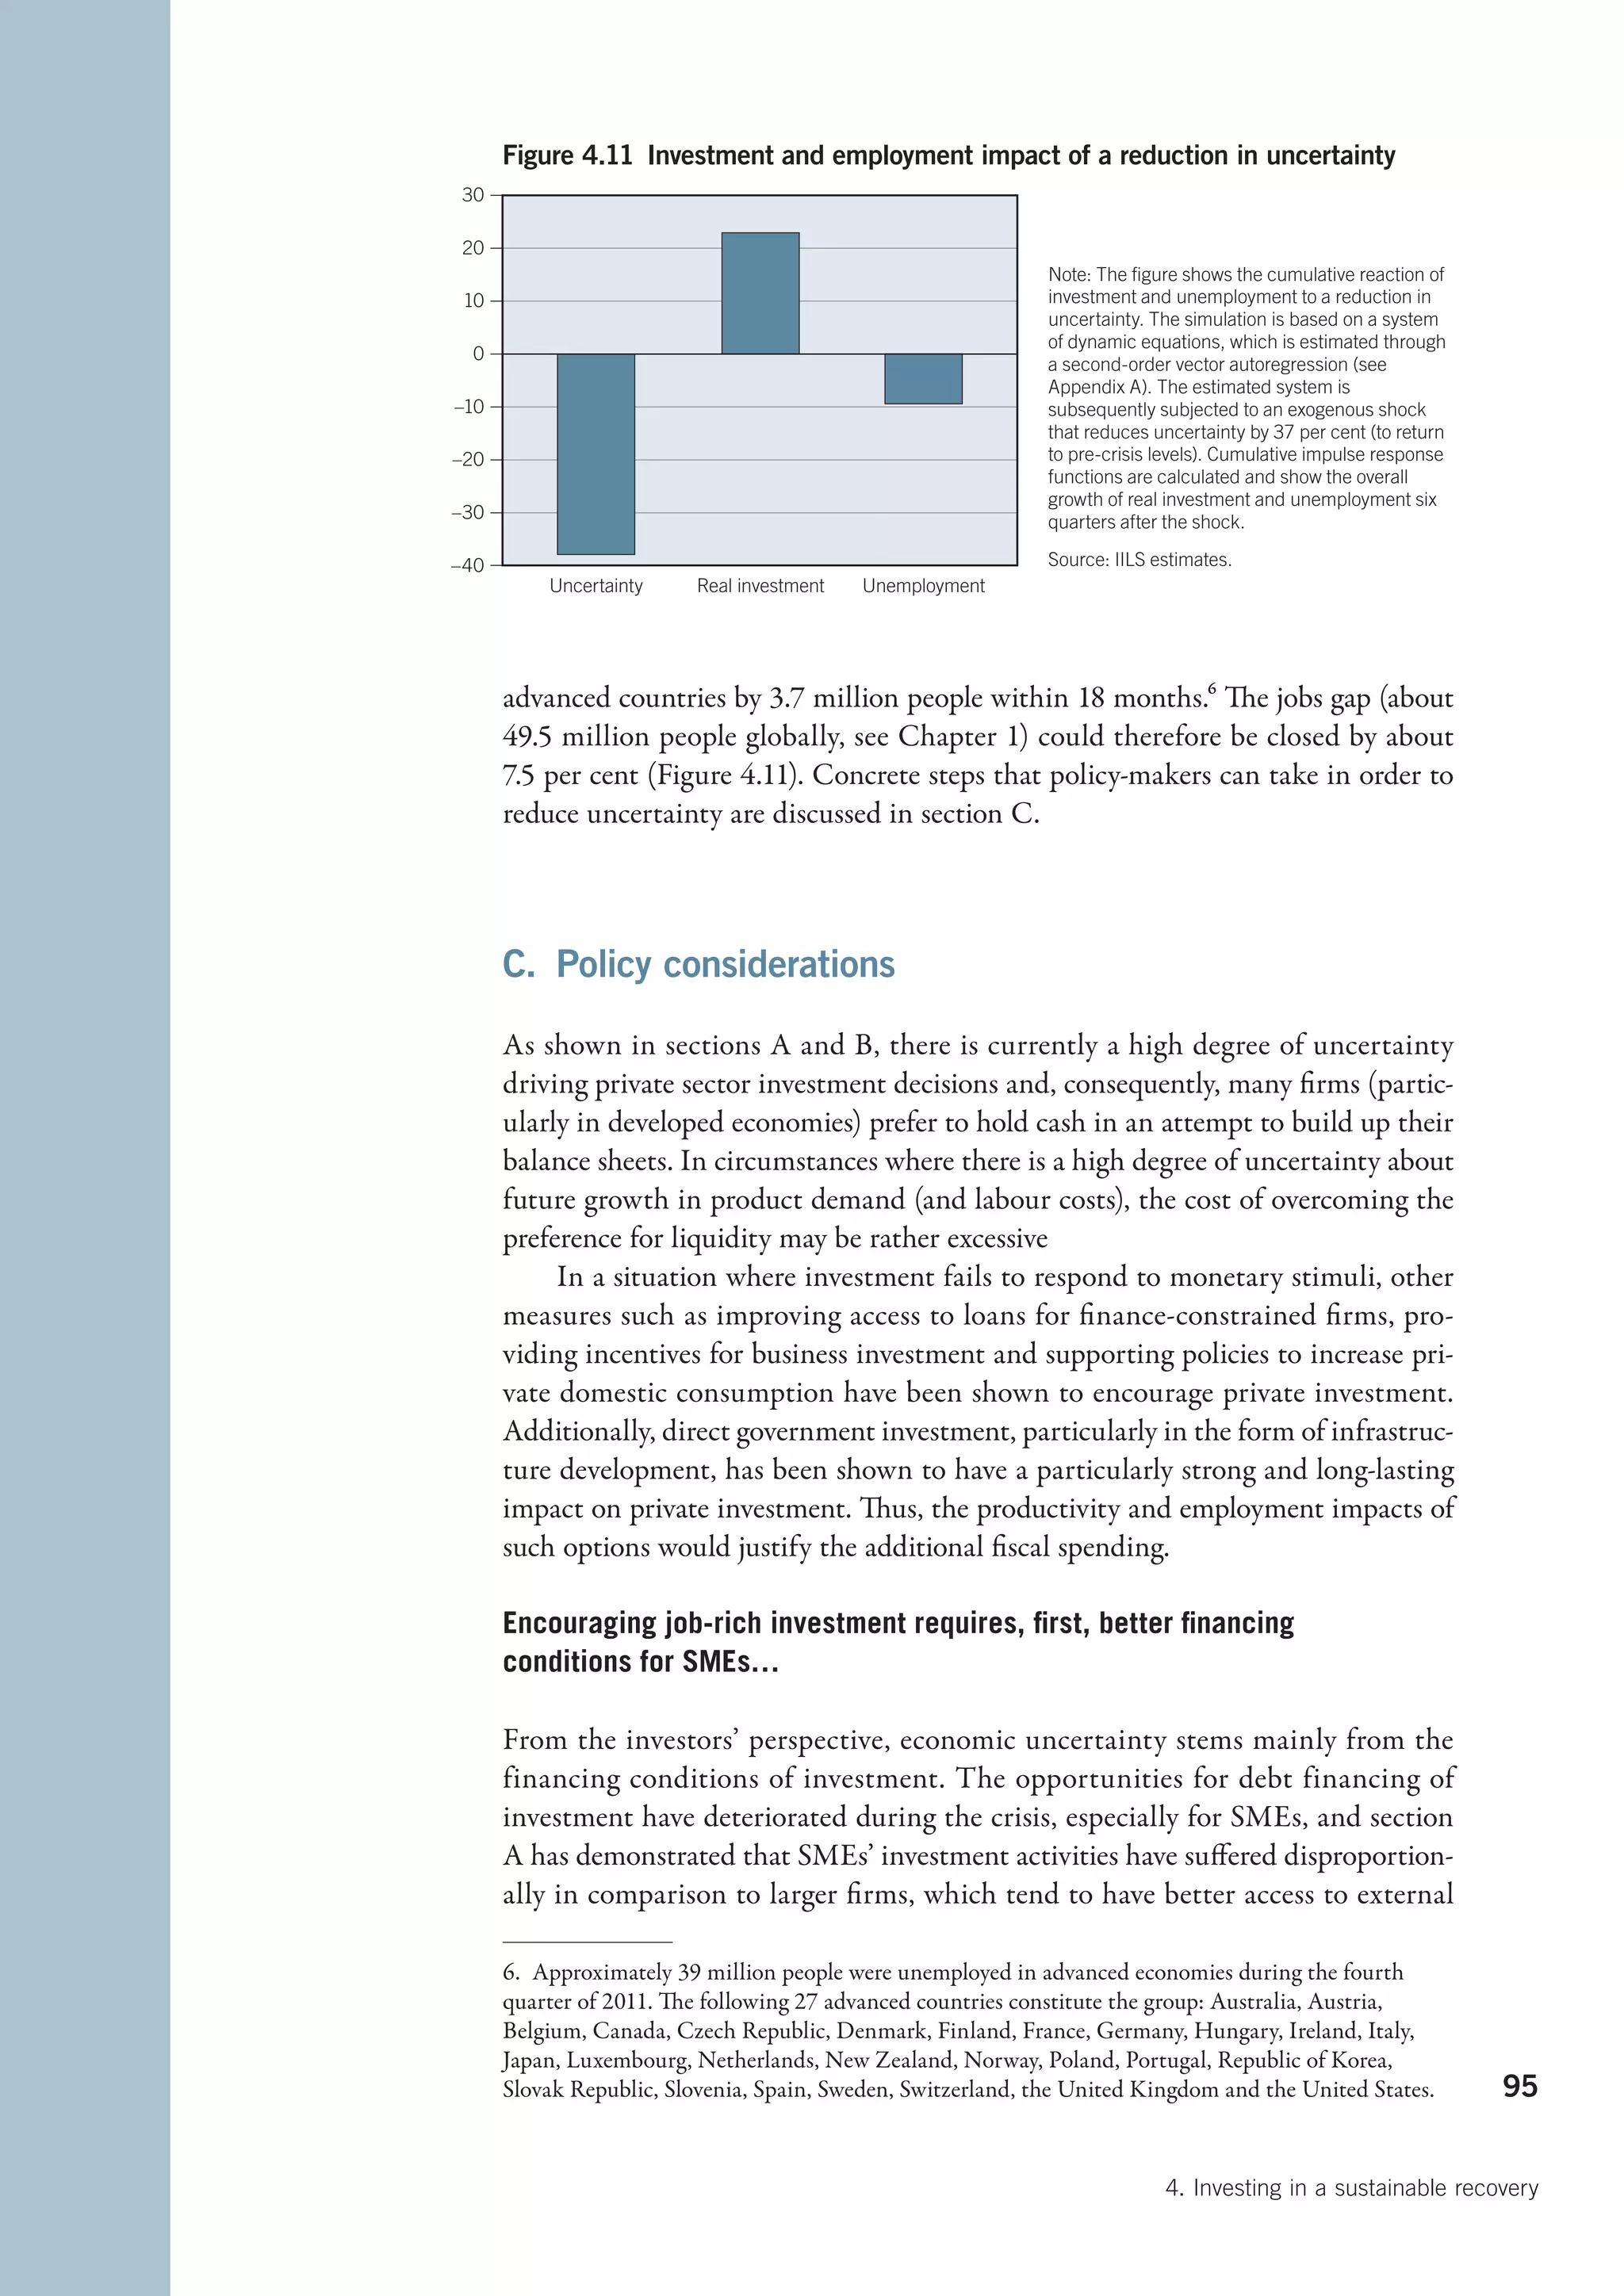
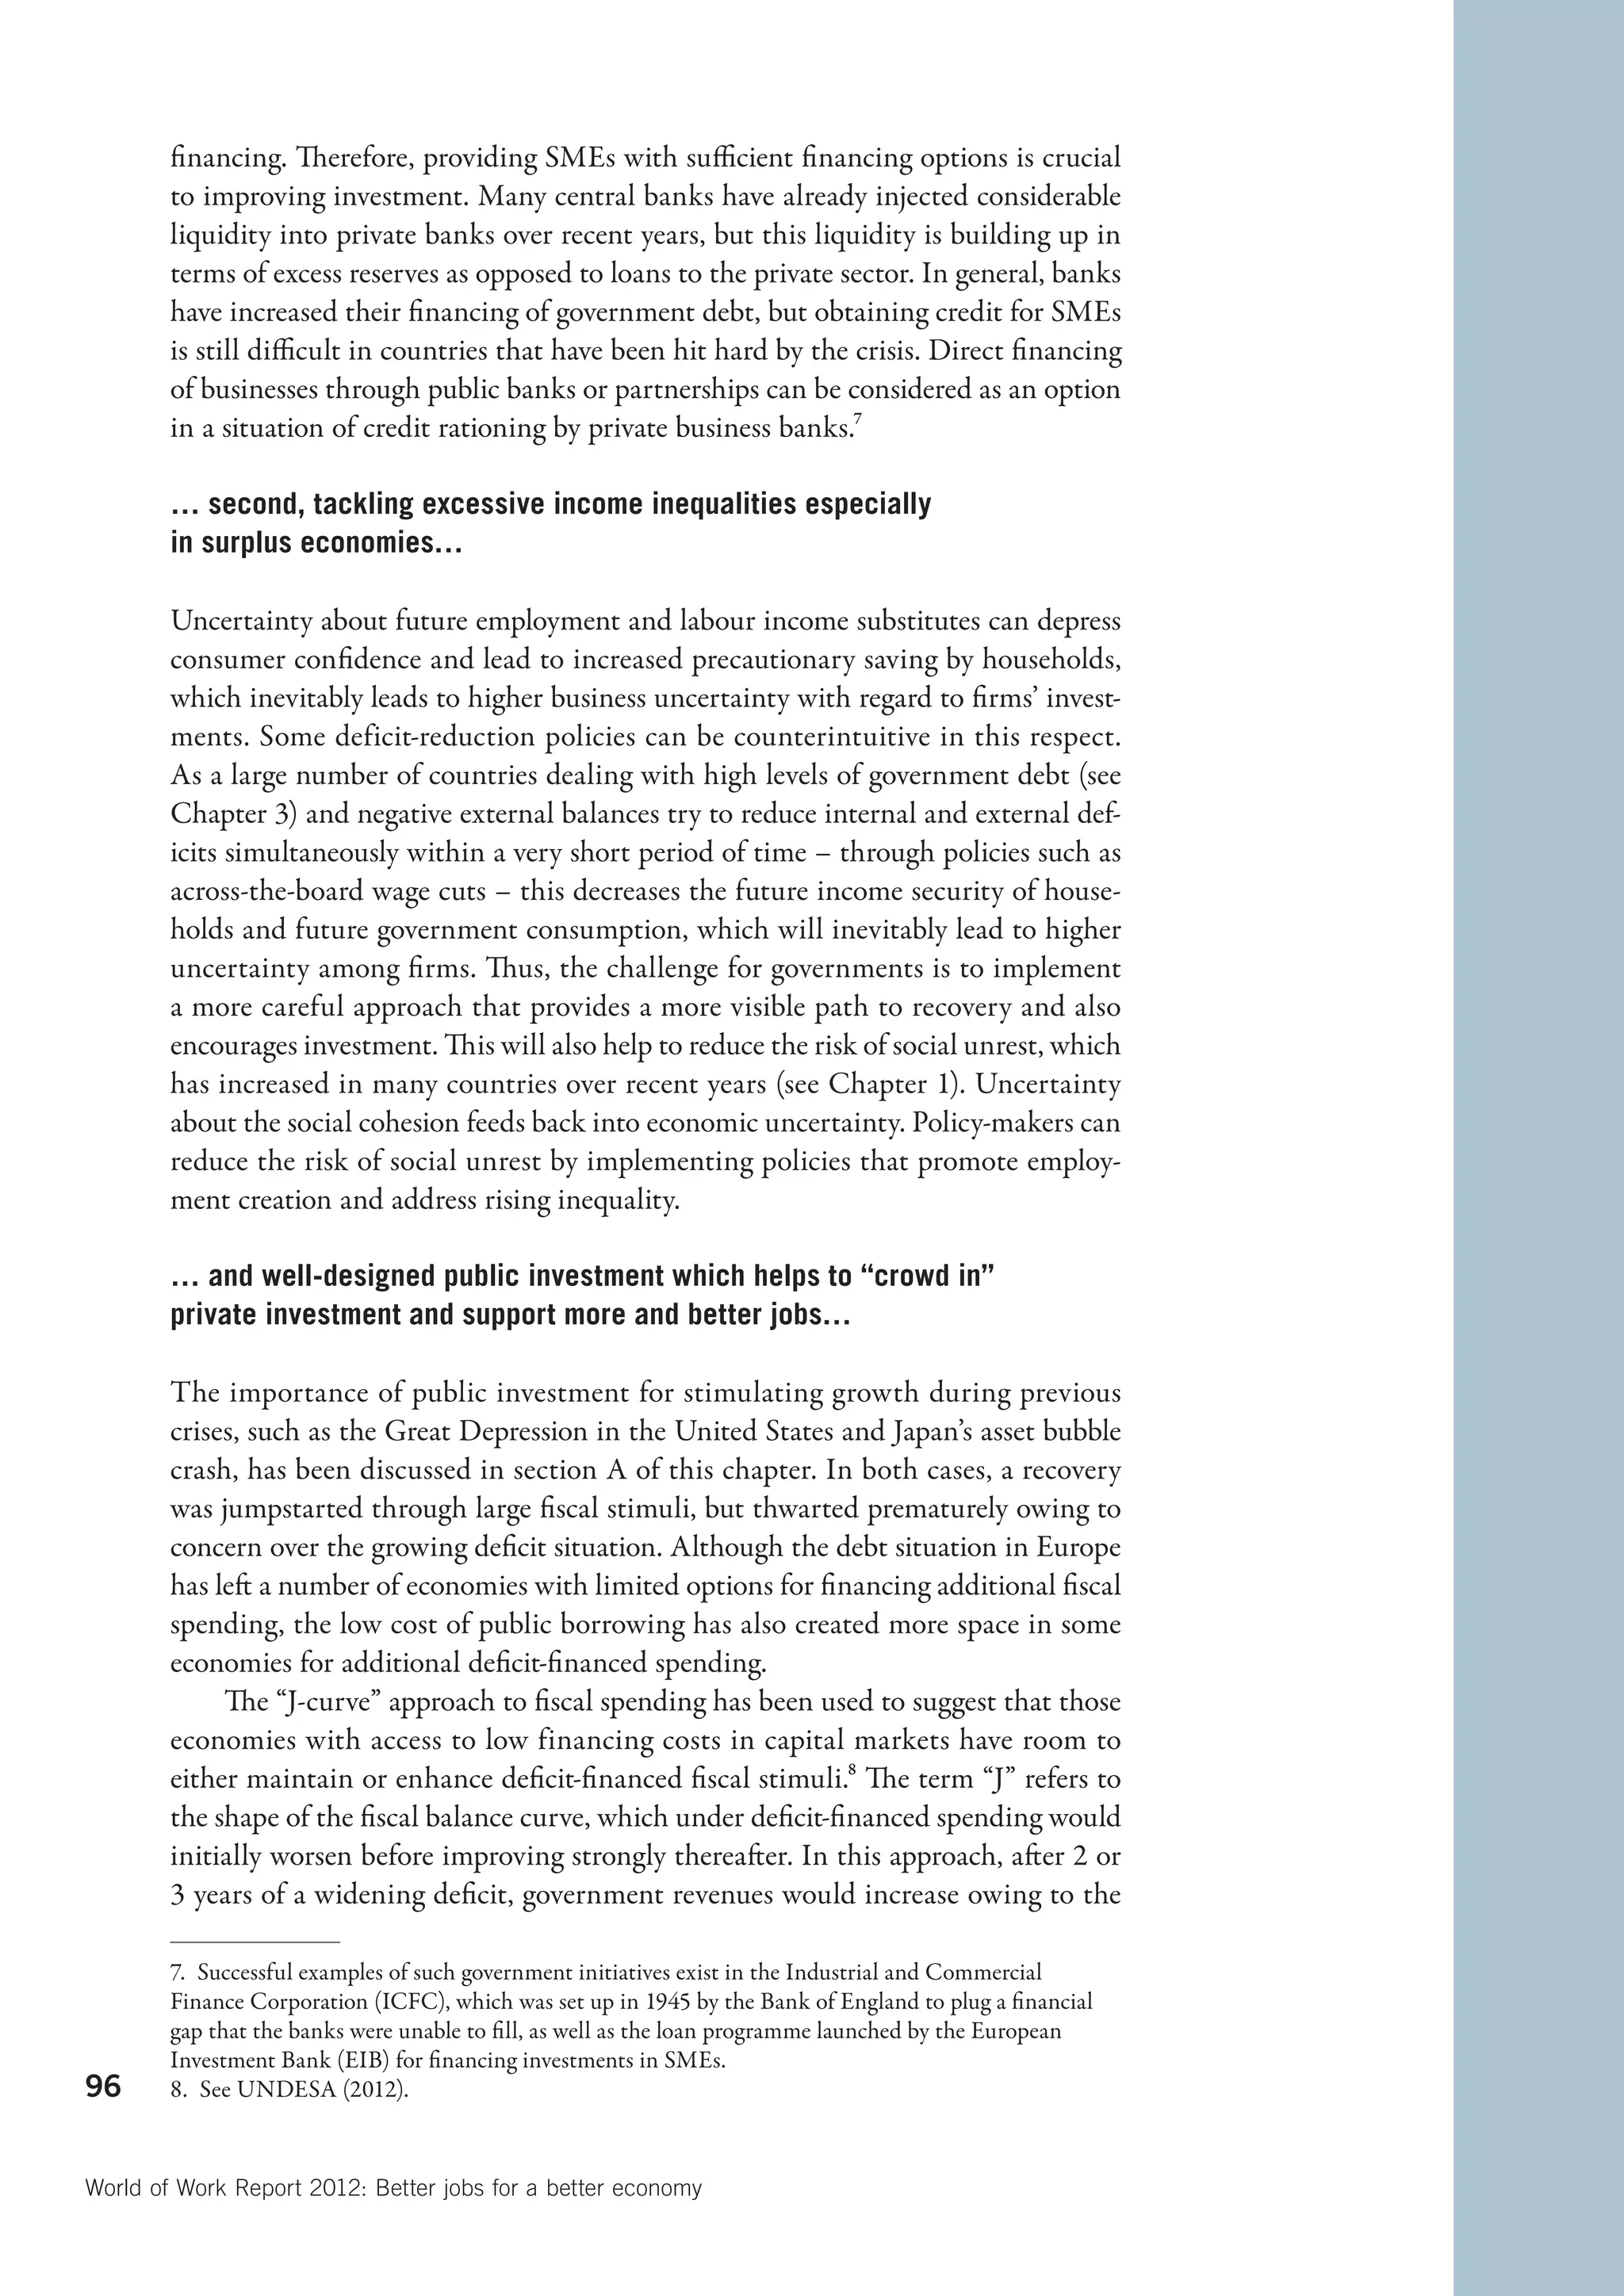
Downloaded 12 times


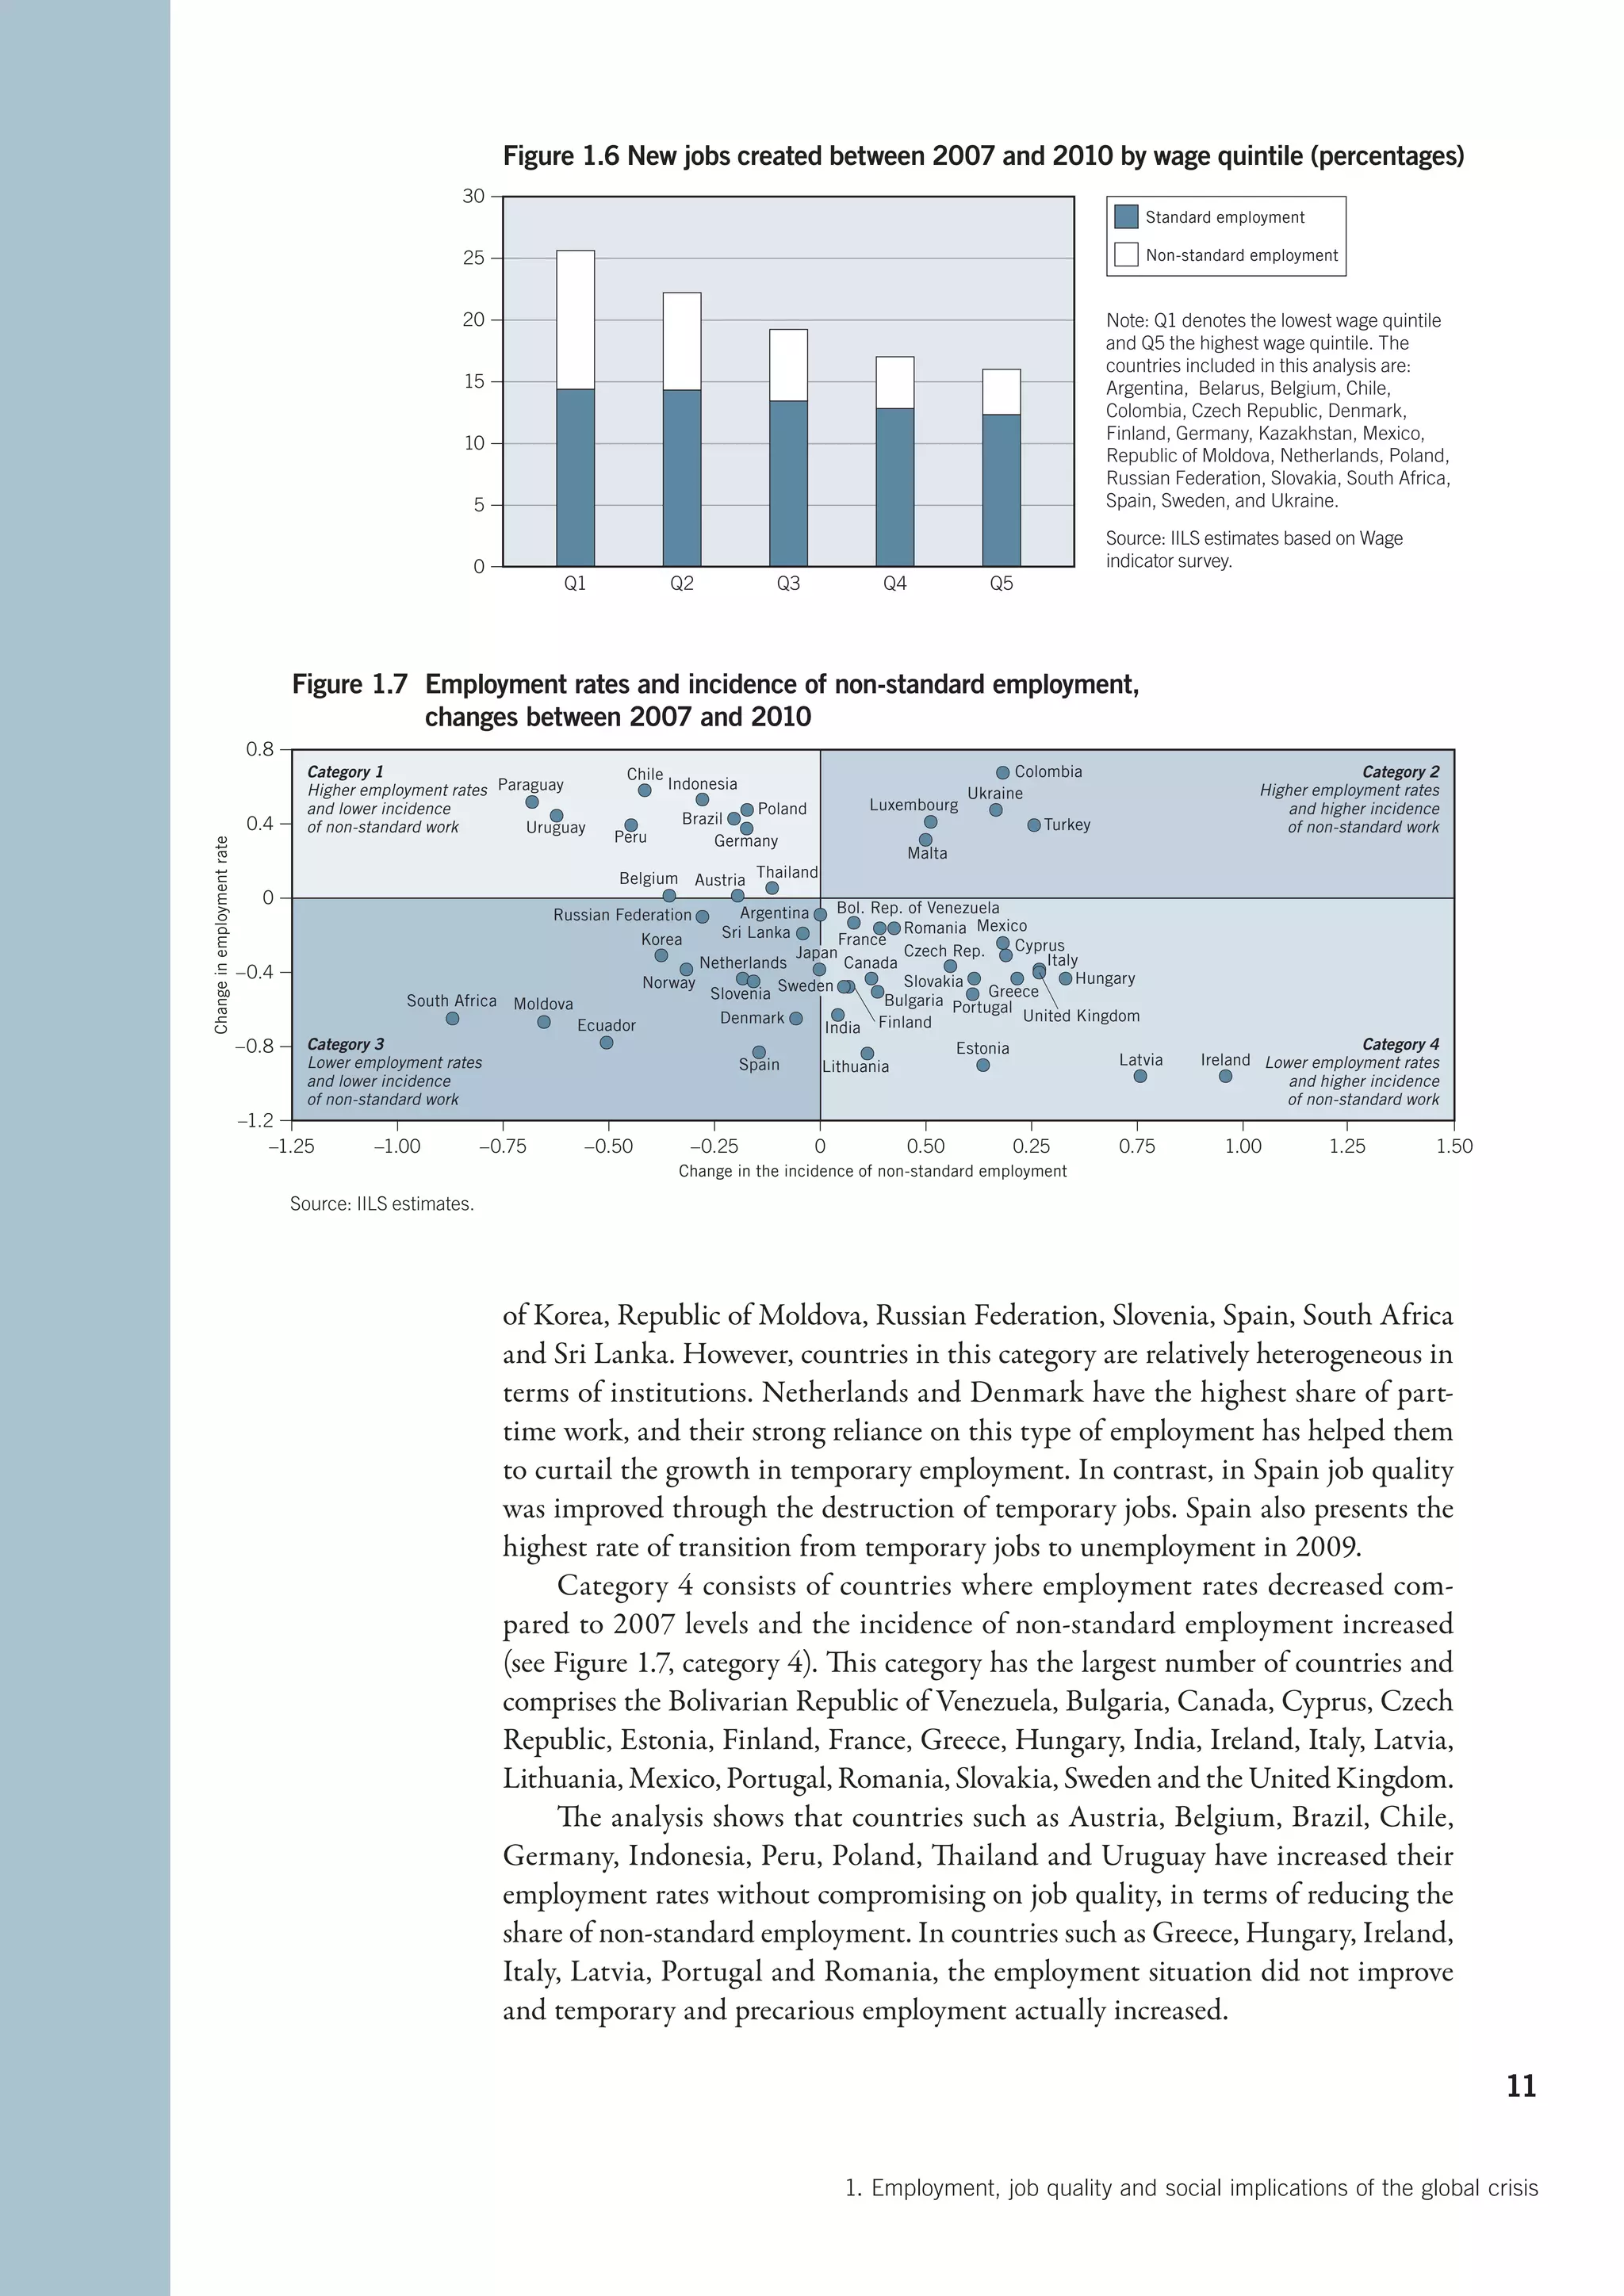
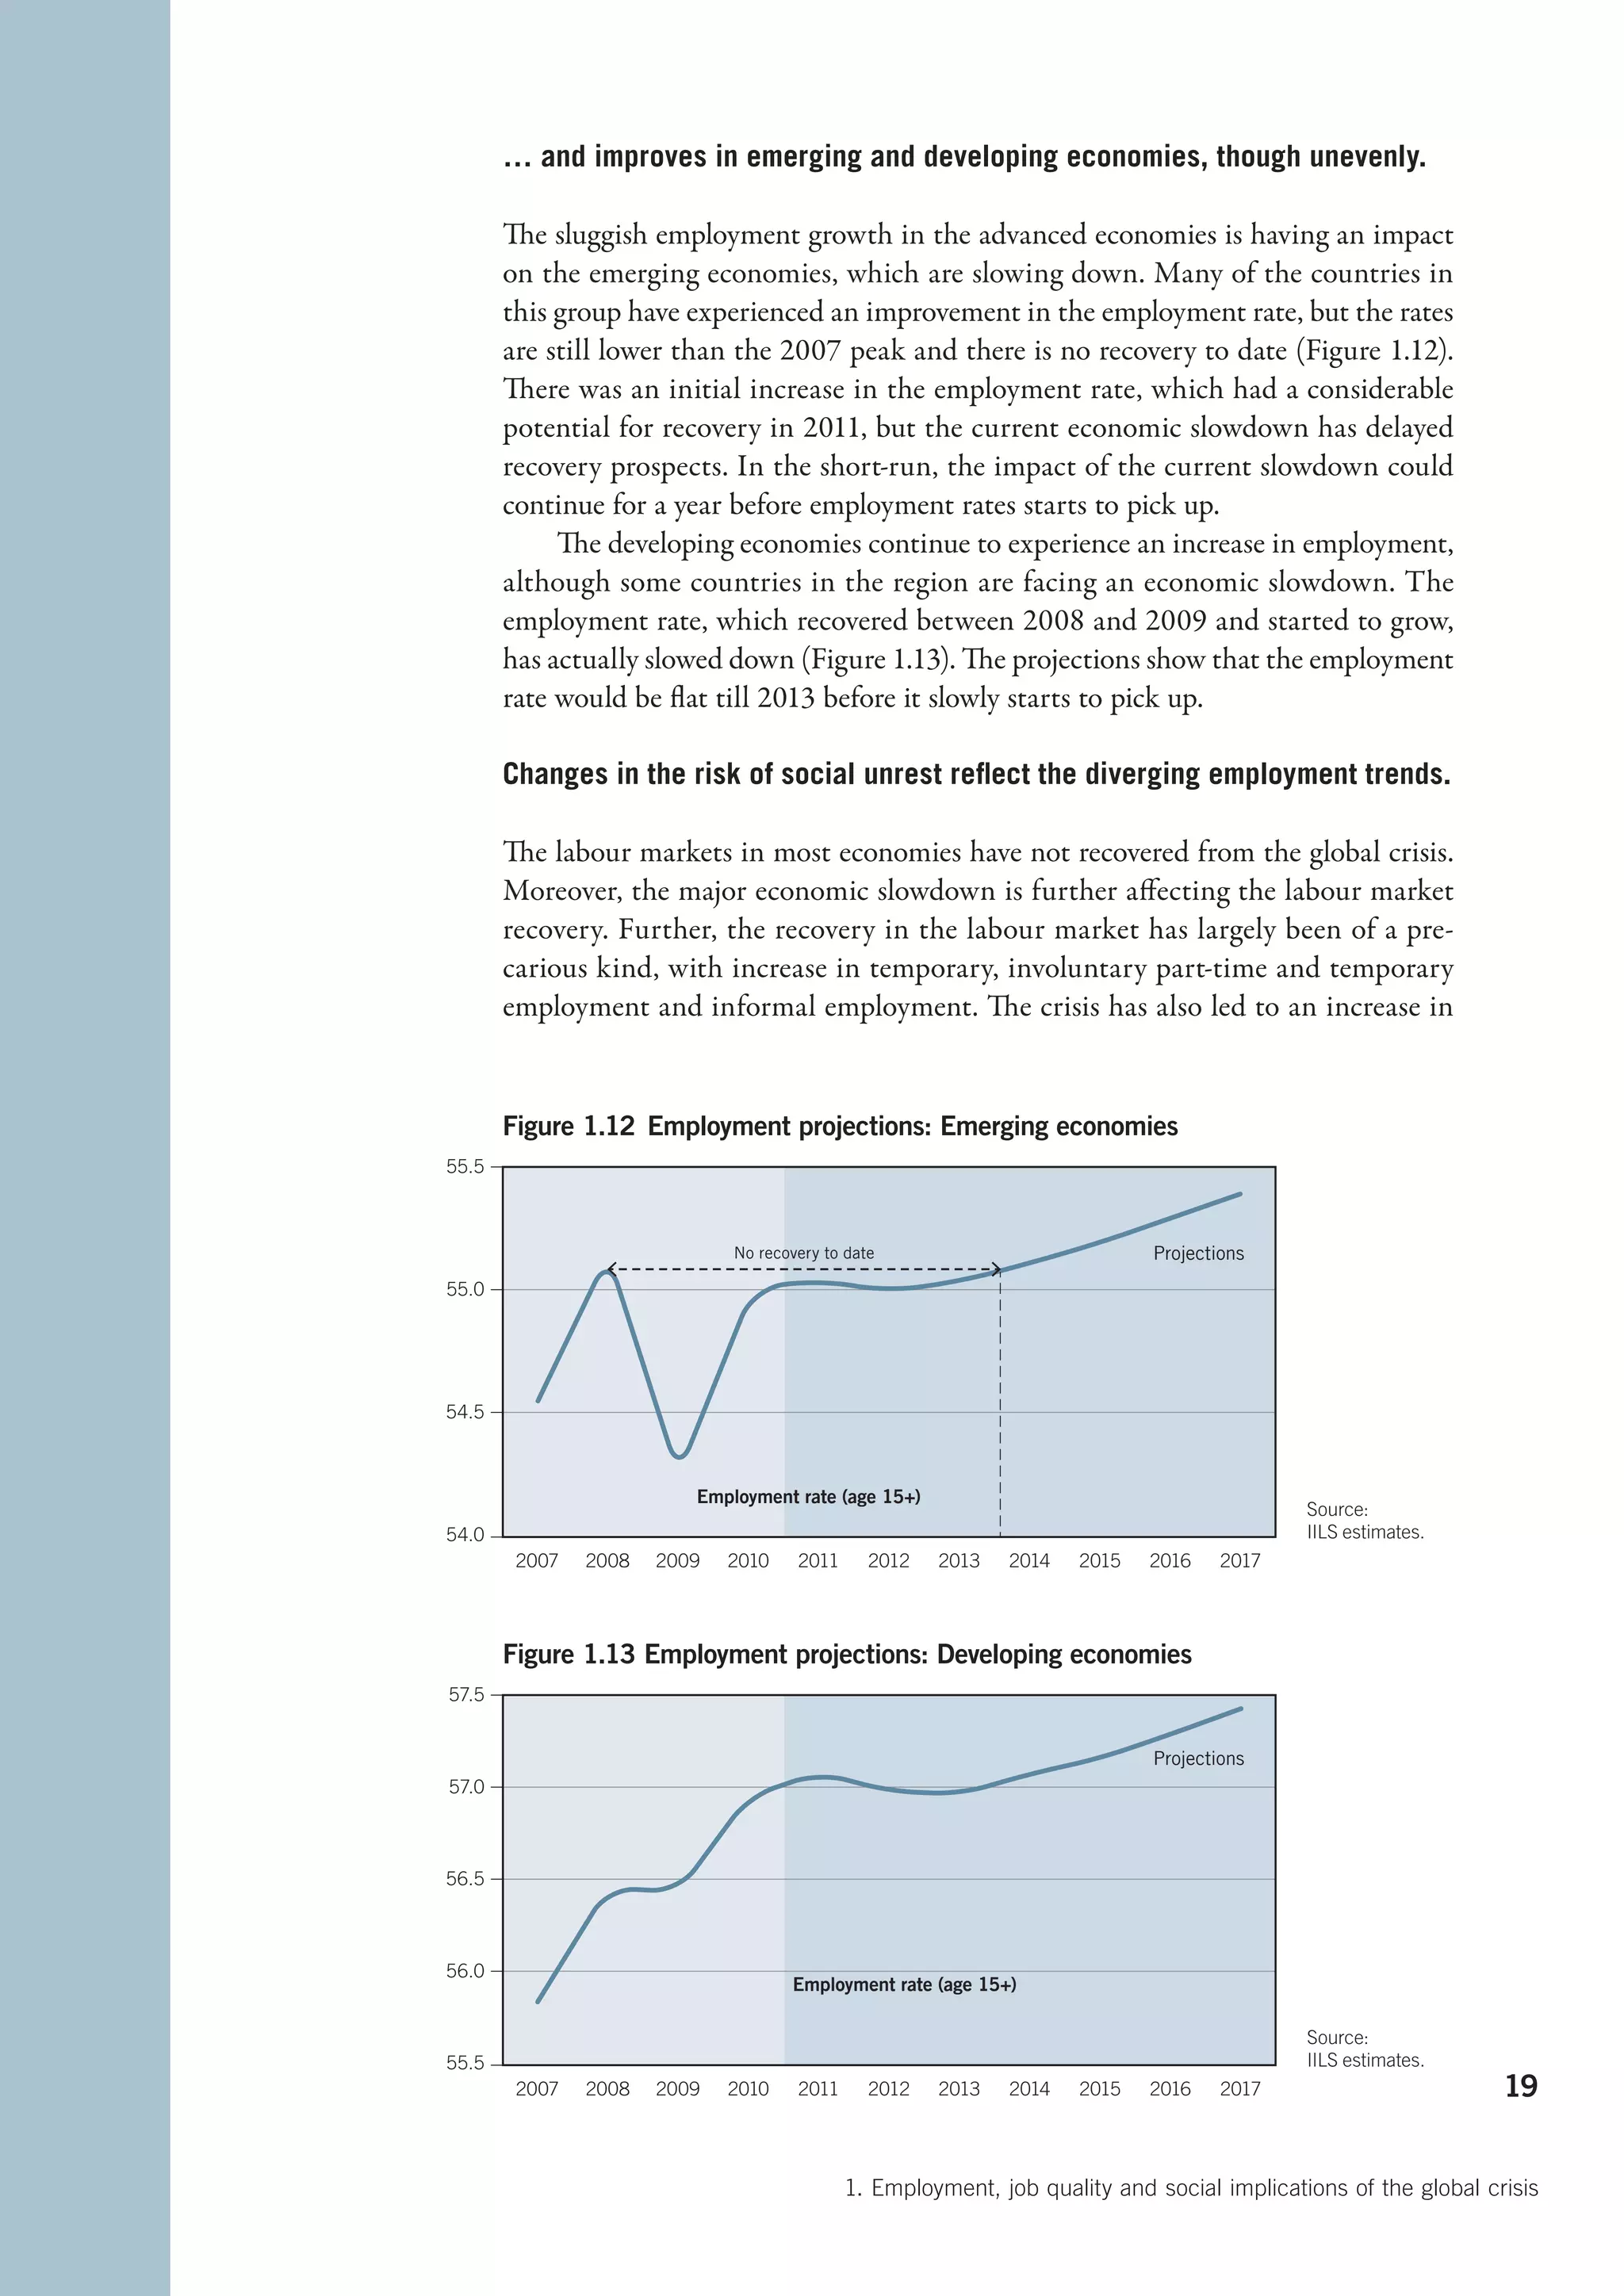
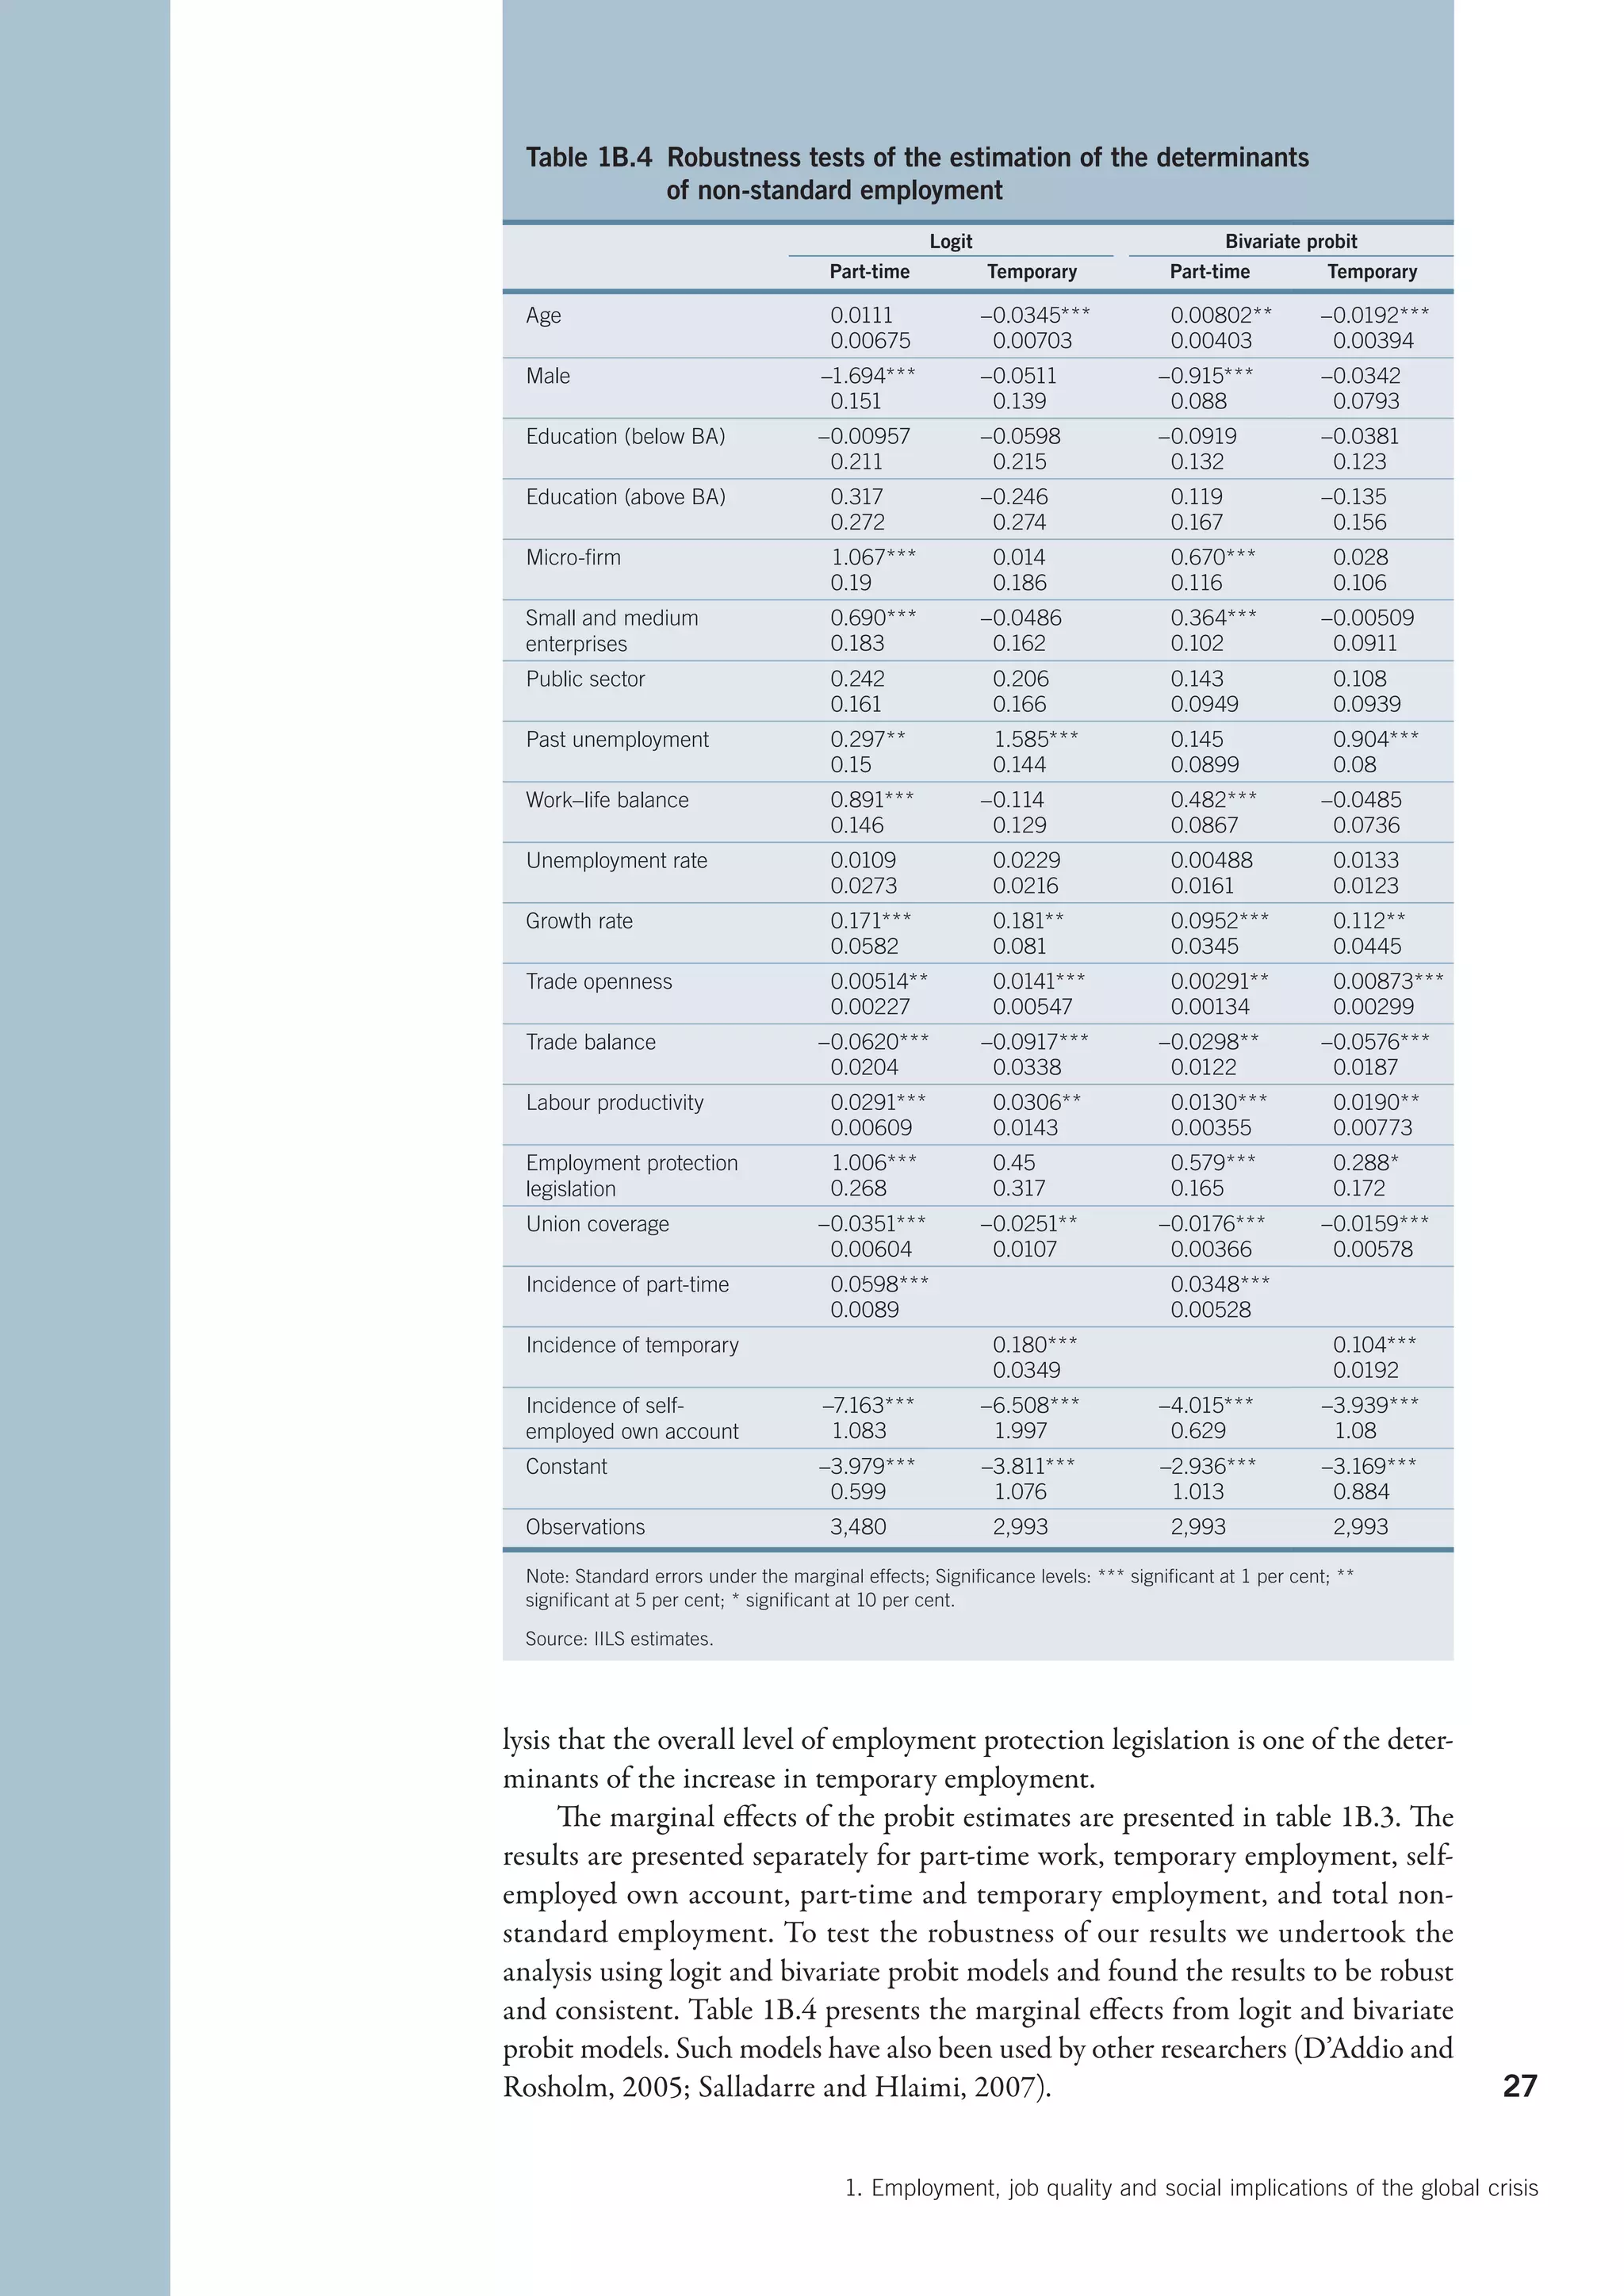
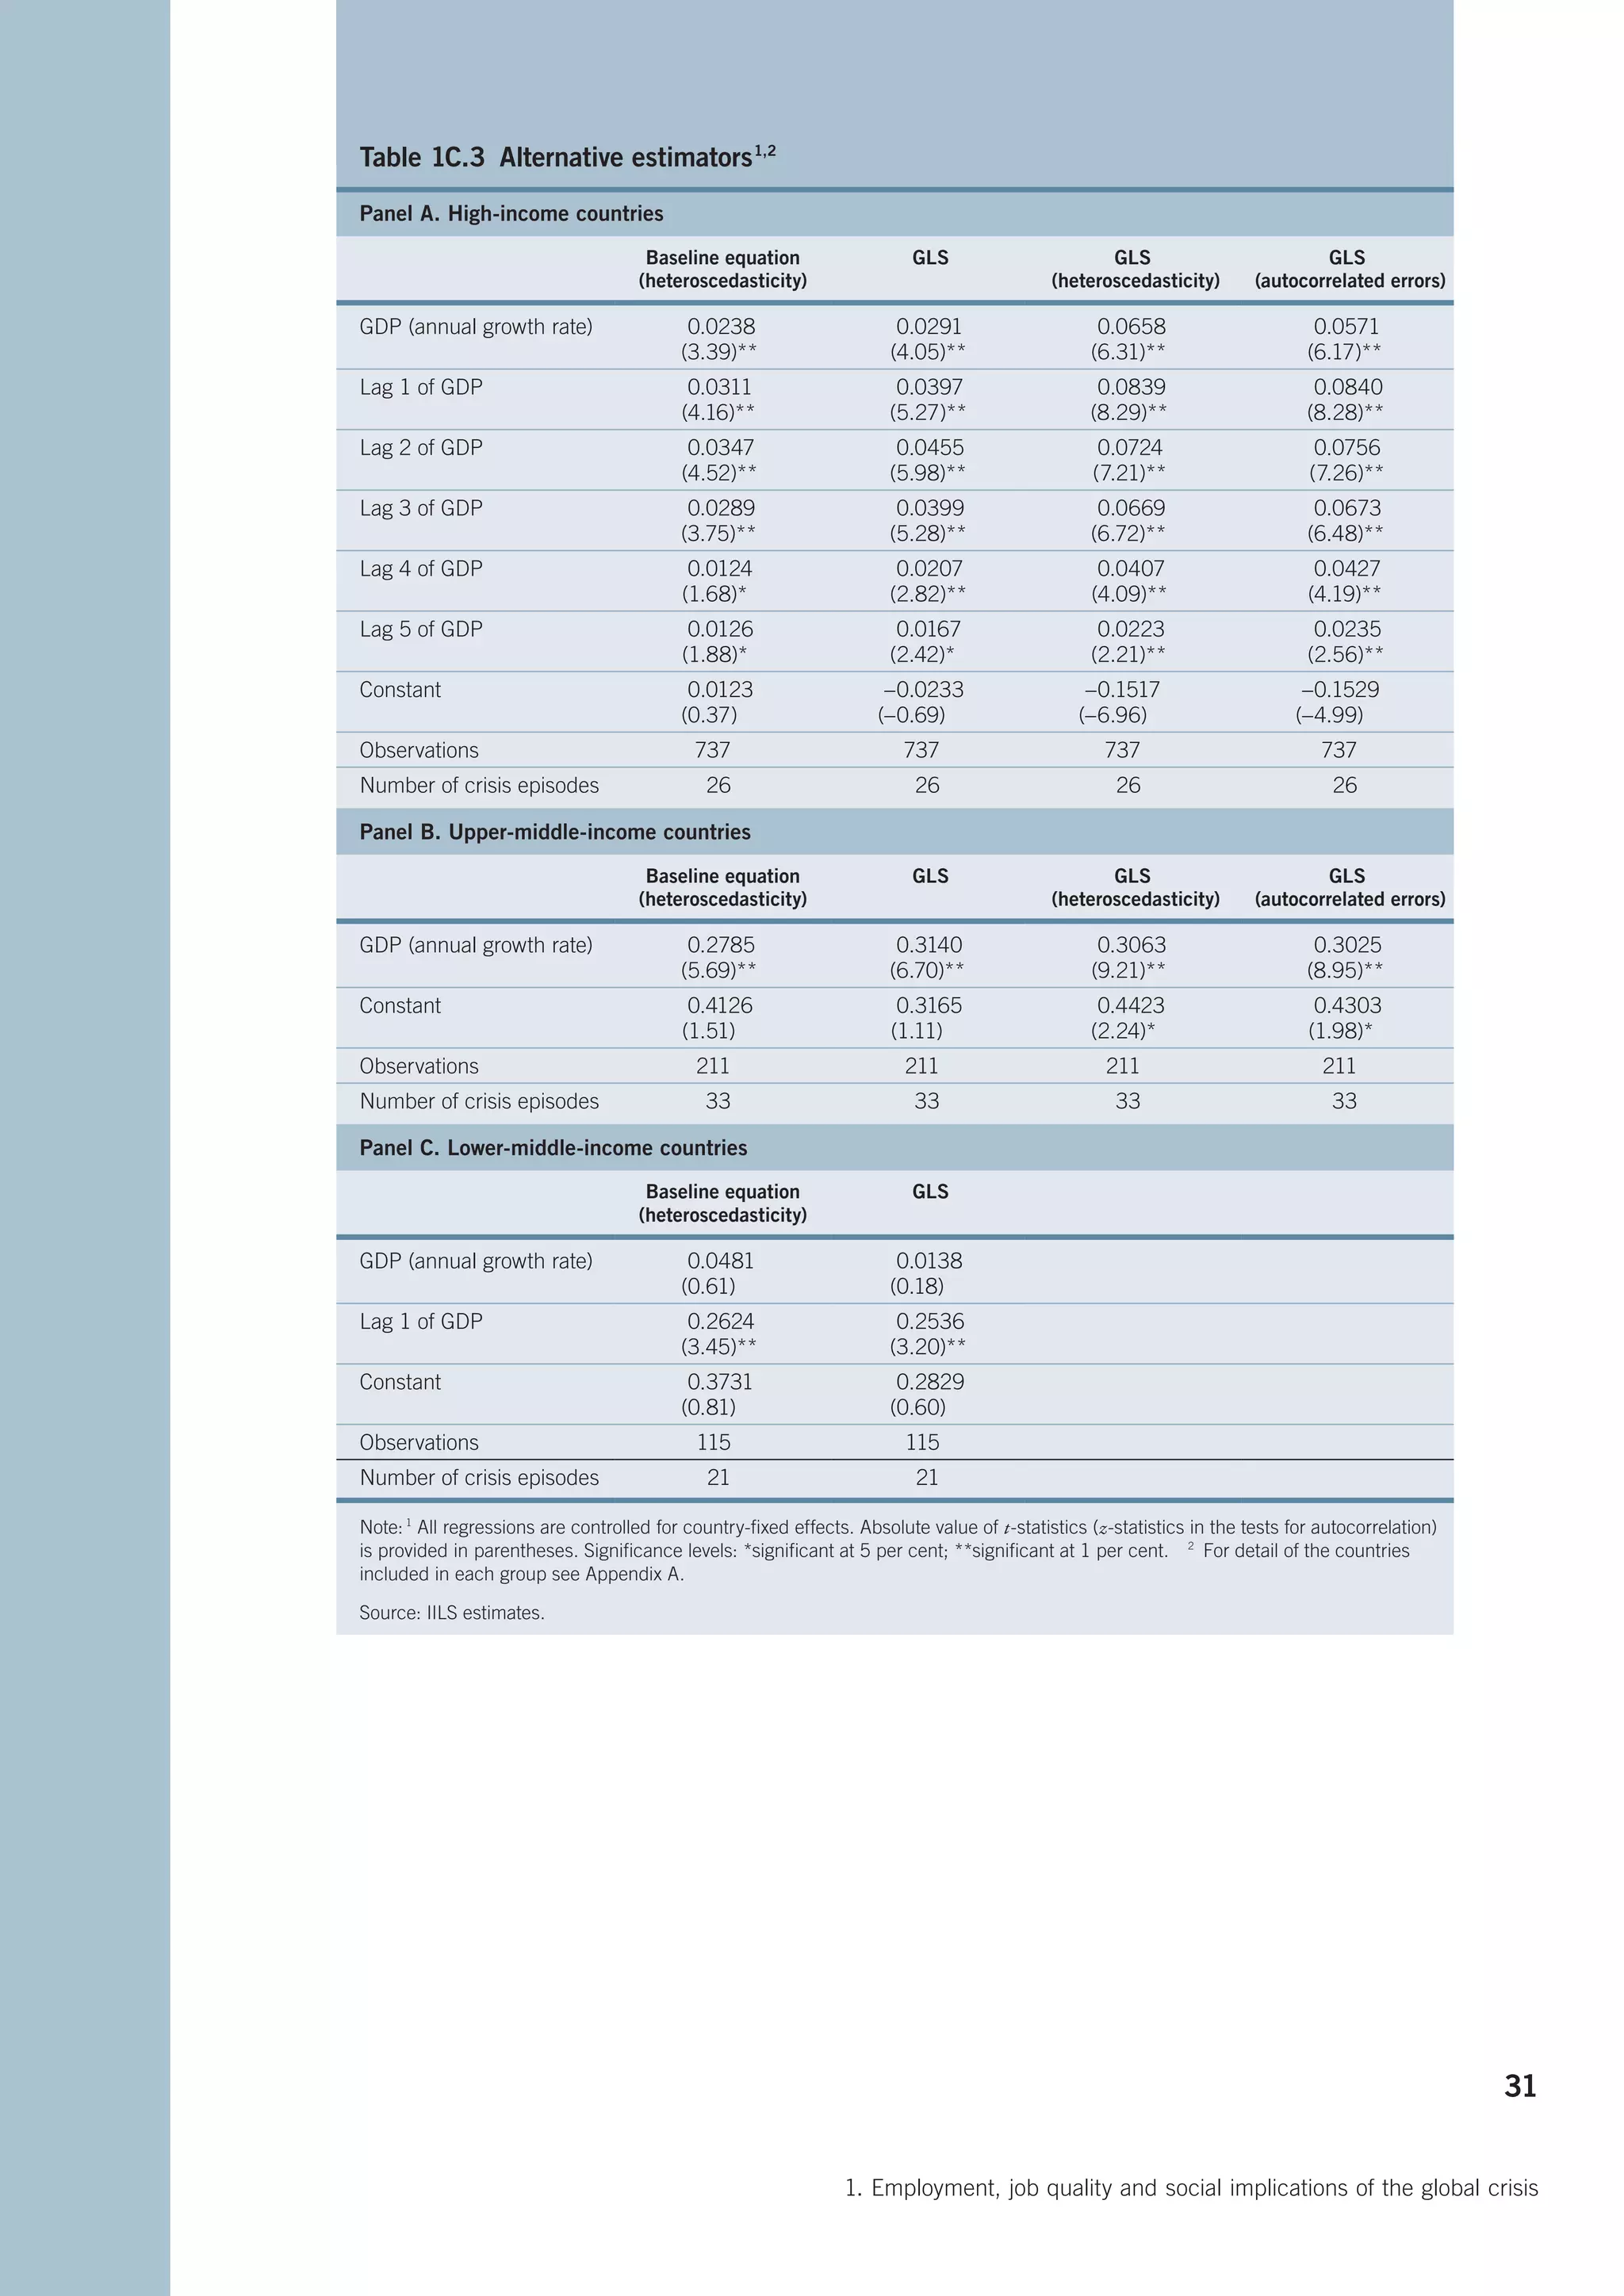
![Figure 1.8 Poverty rates (percentages)
Panel A. Emerging and developing economies
70
Countries where poverty rates decreased
Countries with no
significant change
Pre-crisis Crisis Countries where poverty
60
rates increased
50
40
30
20
10
0
Uruguay
Brazil
Belarus
Montenegro
Thailand
Kazakhstan
Sri Lanka
Albania
Indonesia
Viet Nam
Azerbaijan
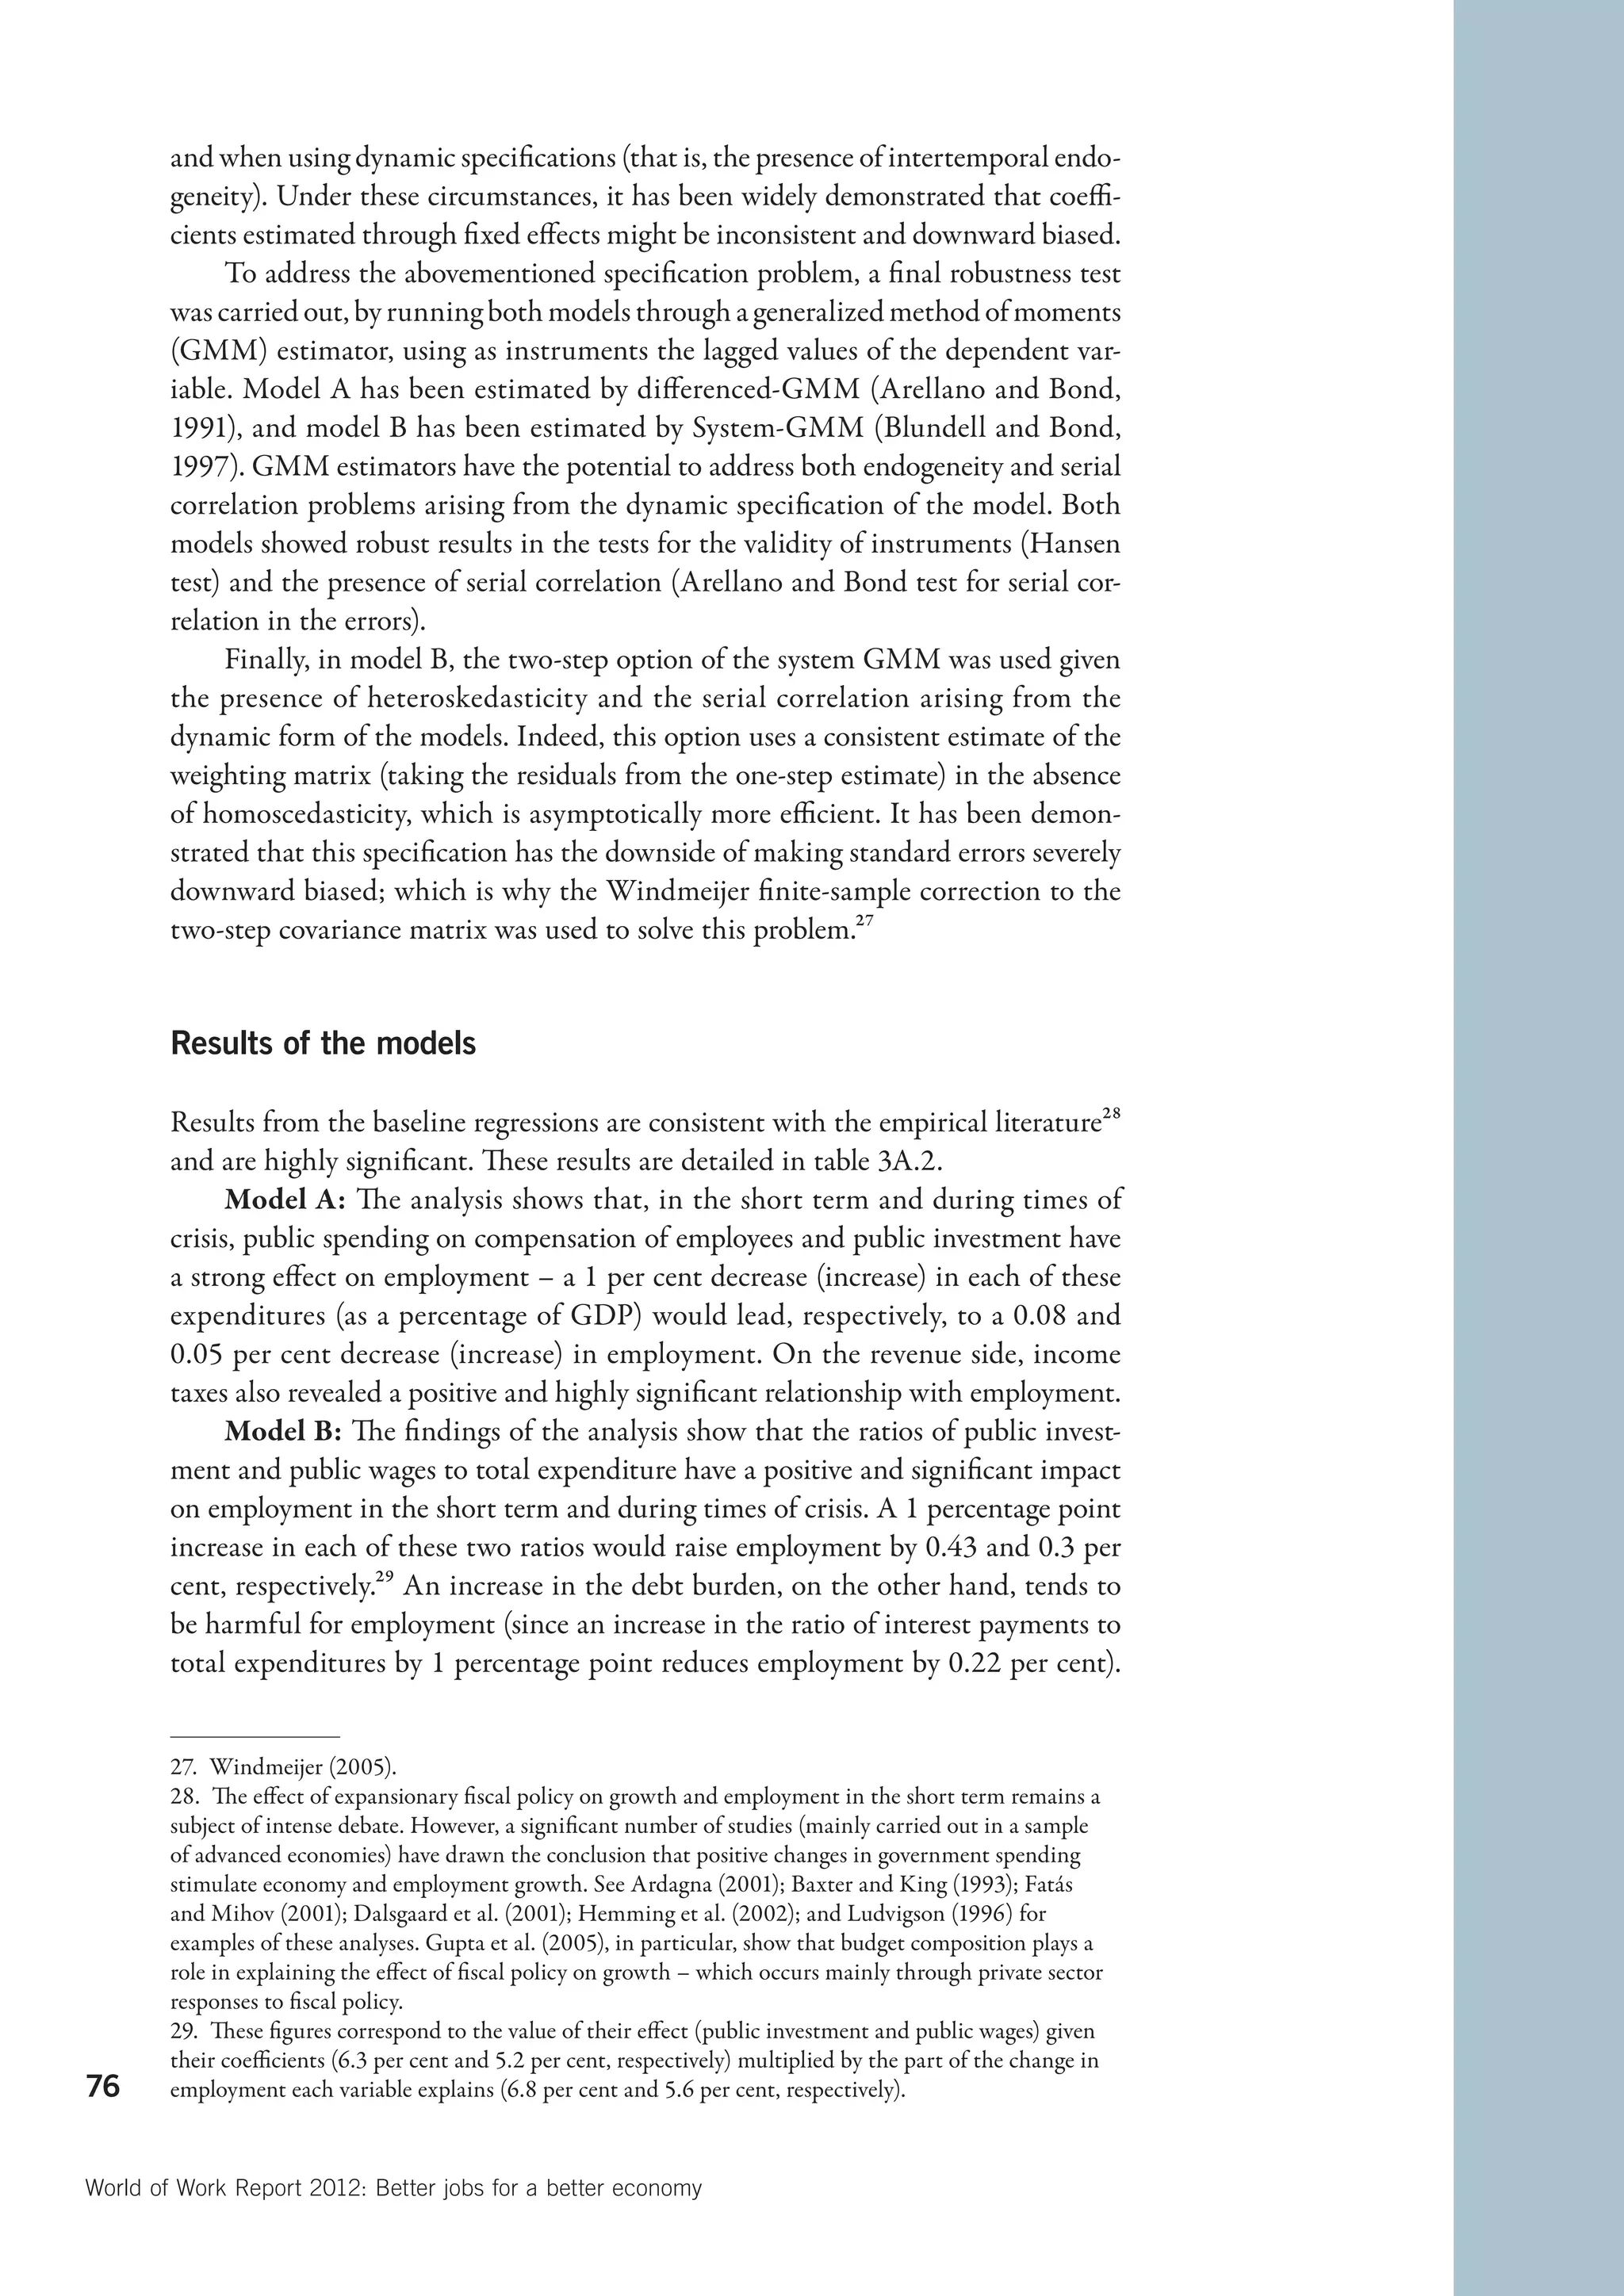
Uganda
Nepal
Lao PDR
India
Fiji
Bangladesh
Kyrgyz Republic
Panama
Dominican Republic
Peru
Paraguay
Ecuador
Rwanda
Chile
Costa Rica
Cote d'Ivoire
Mongolia
Colombia
Afghanistan
Mauritania
Tajikistan
Honduras
Malaysia
Philippines
Jordan
Turkey
Egypt, Arab Rep. of
Armenia
El Salvador
Mozambique
Venezuela, Bol. Rep. of
Moldova, Rep. of
Panel B. Advanced economies
30
Countries where poverty Countries with no Countries where poverty
2007 2010
rates decreased significant change rates increased
25
20
15
10
5
0
Czech Republic
Israel
Iceland
Norway
Belgium
Ireland
United Kingdom
Italy
New Zealand
Bulgaria
Romania
Netherlands
Austria
Hungary
Finland
Portugal
Greece
Latvia
Sweden
Denmark
Cyprus
Canada
Slovakia
Slovenia
France
Luxembourg
Malta
Germany
Switzerland
Poland
Lithuania
Spain
Japan
Australia
United States
Korea, Rep. of
Note: For emerging and developing economies, the poverty rate is measured as the percentage of the population living below
the national poverty rate. For advanced economies it is measured as the percentage of the population living below 60 per cent
of the median income. For Australia, Canada, Israel, Japan, Republic of Korea, New Zealand, Switzerland and the United States
the data refer to mid-2000s and latest year.
Source: IILS estimates based on World Bank, Eurostat and OECD databases.
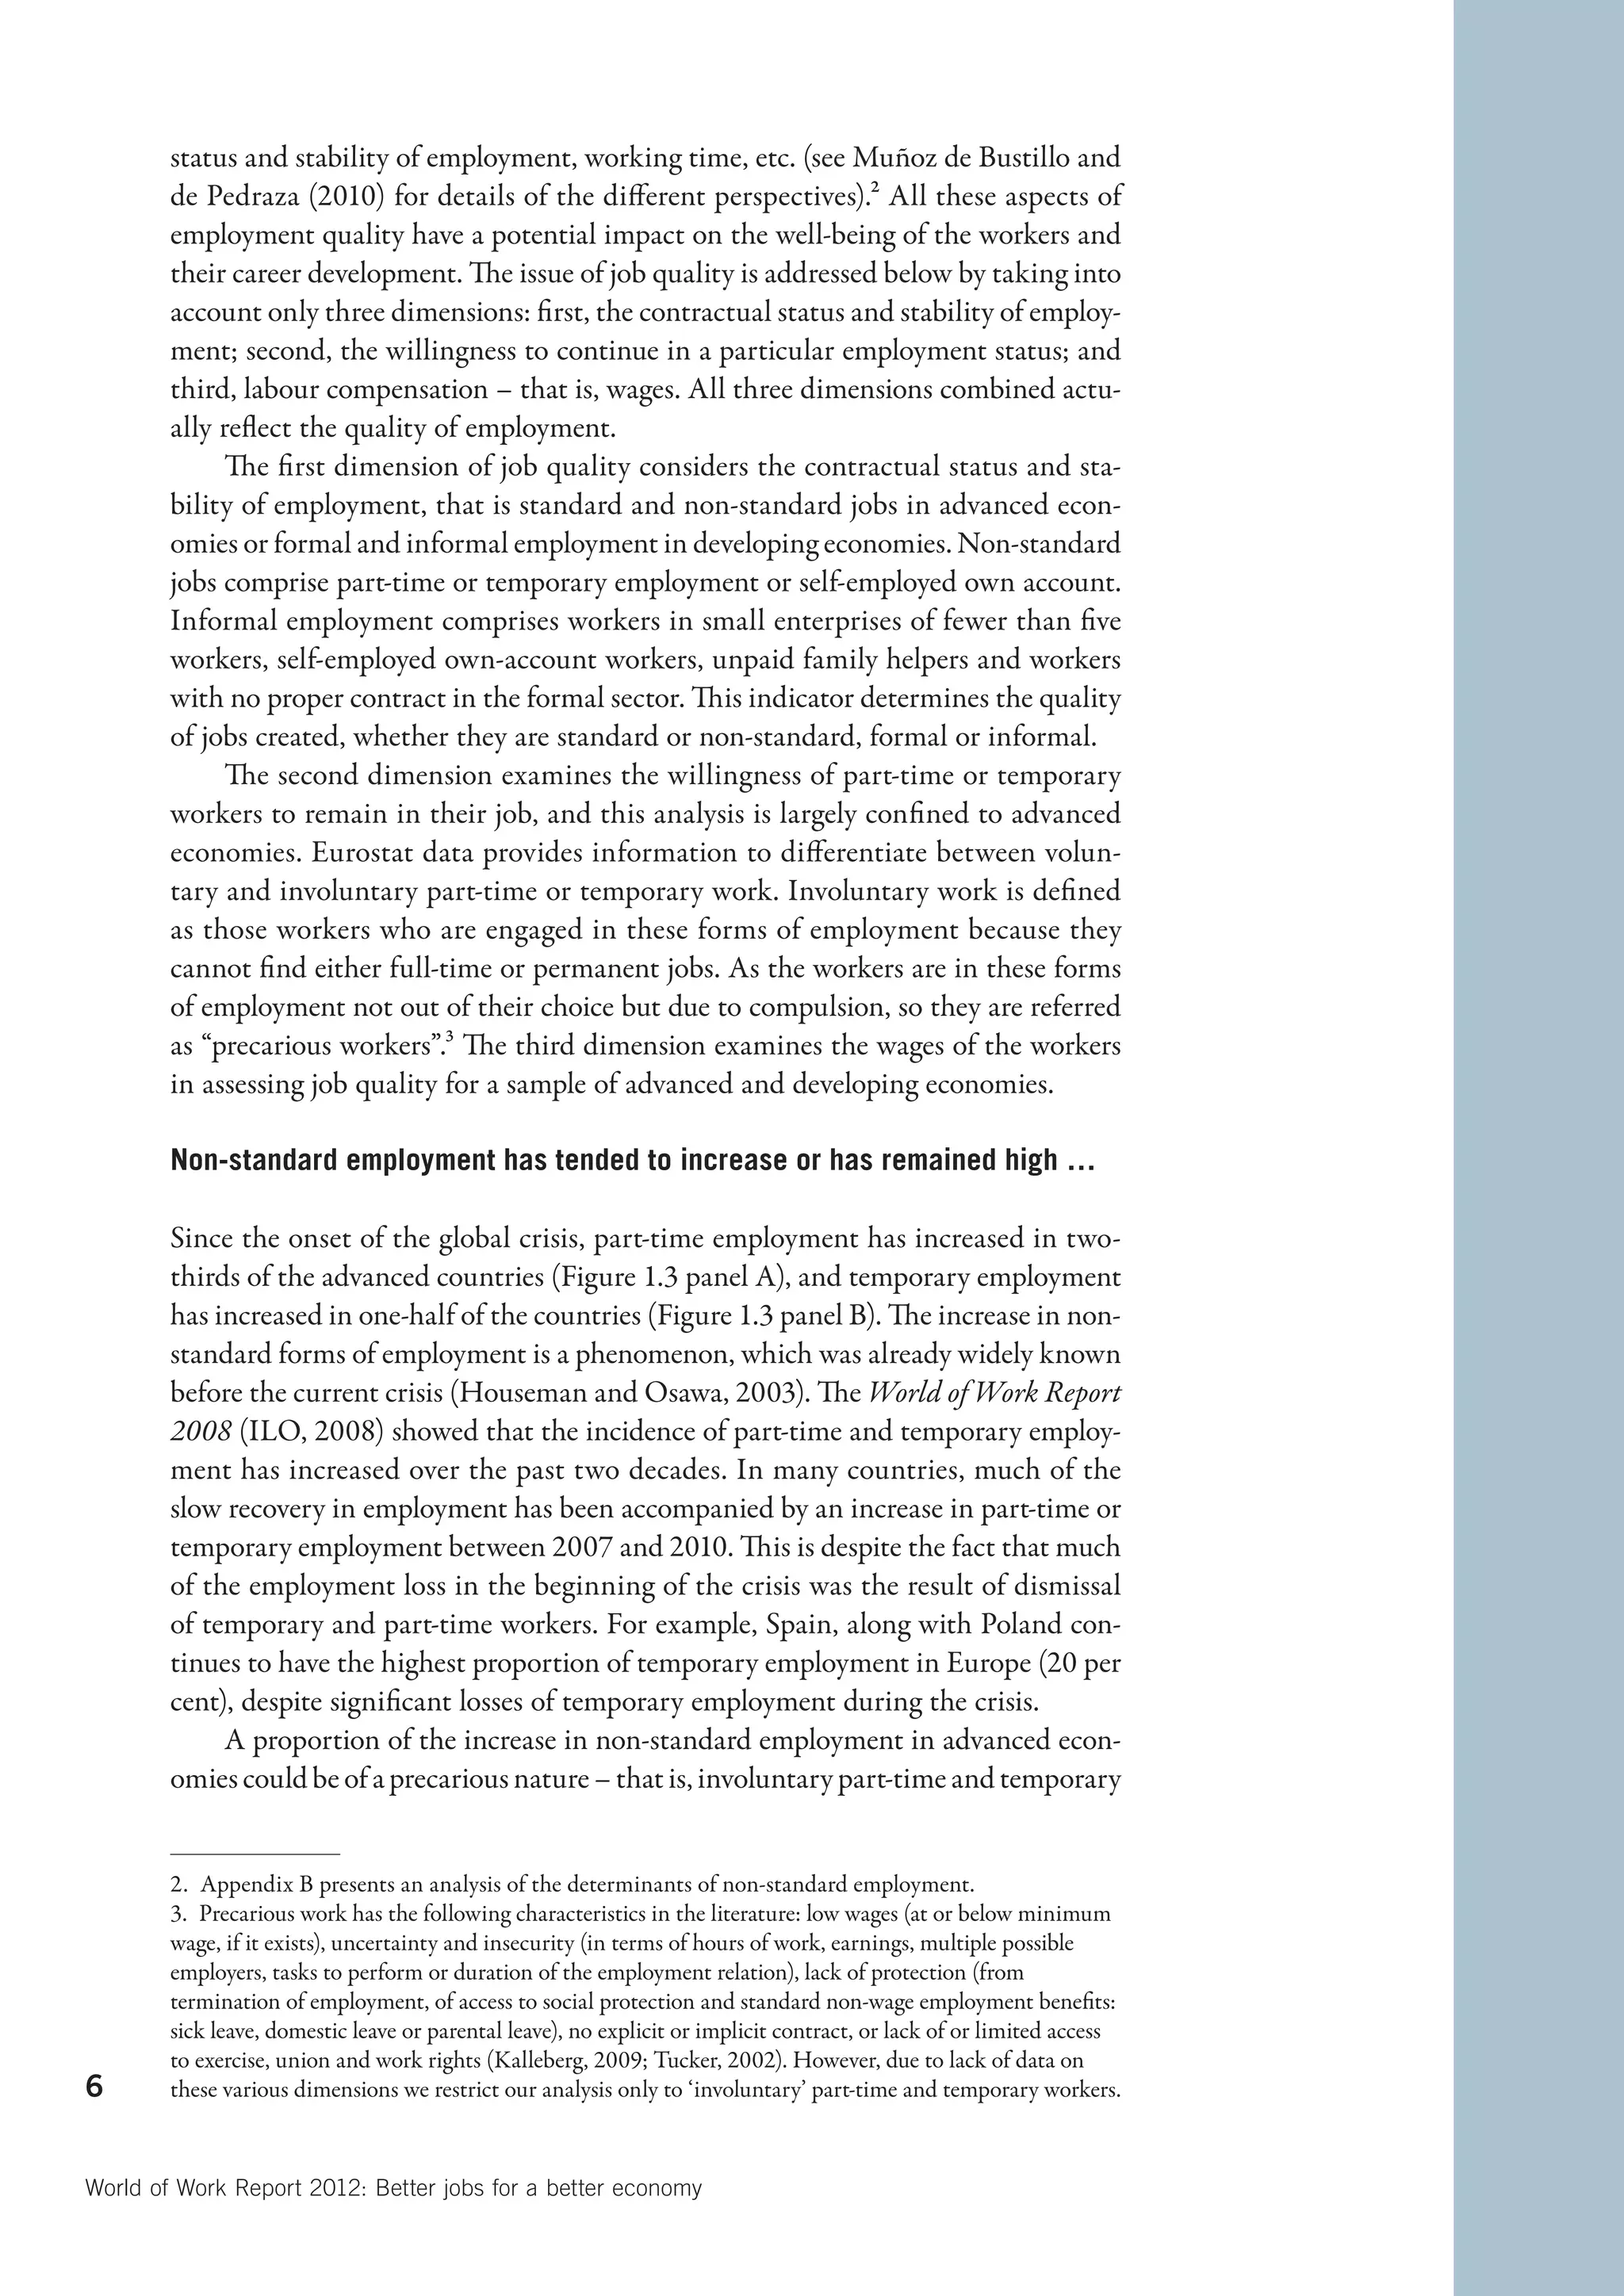
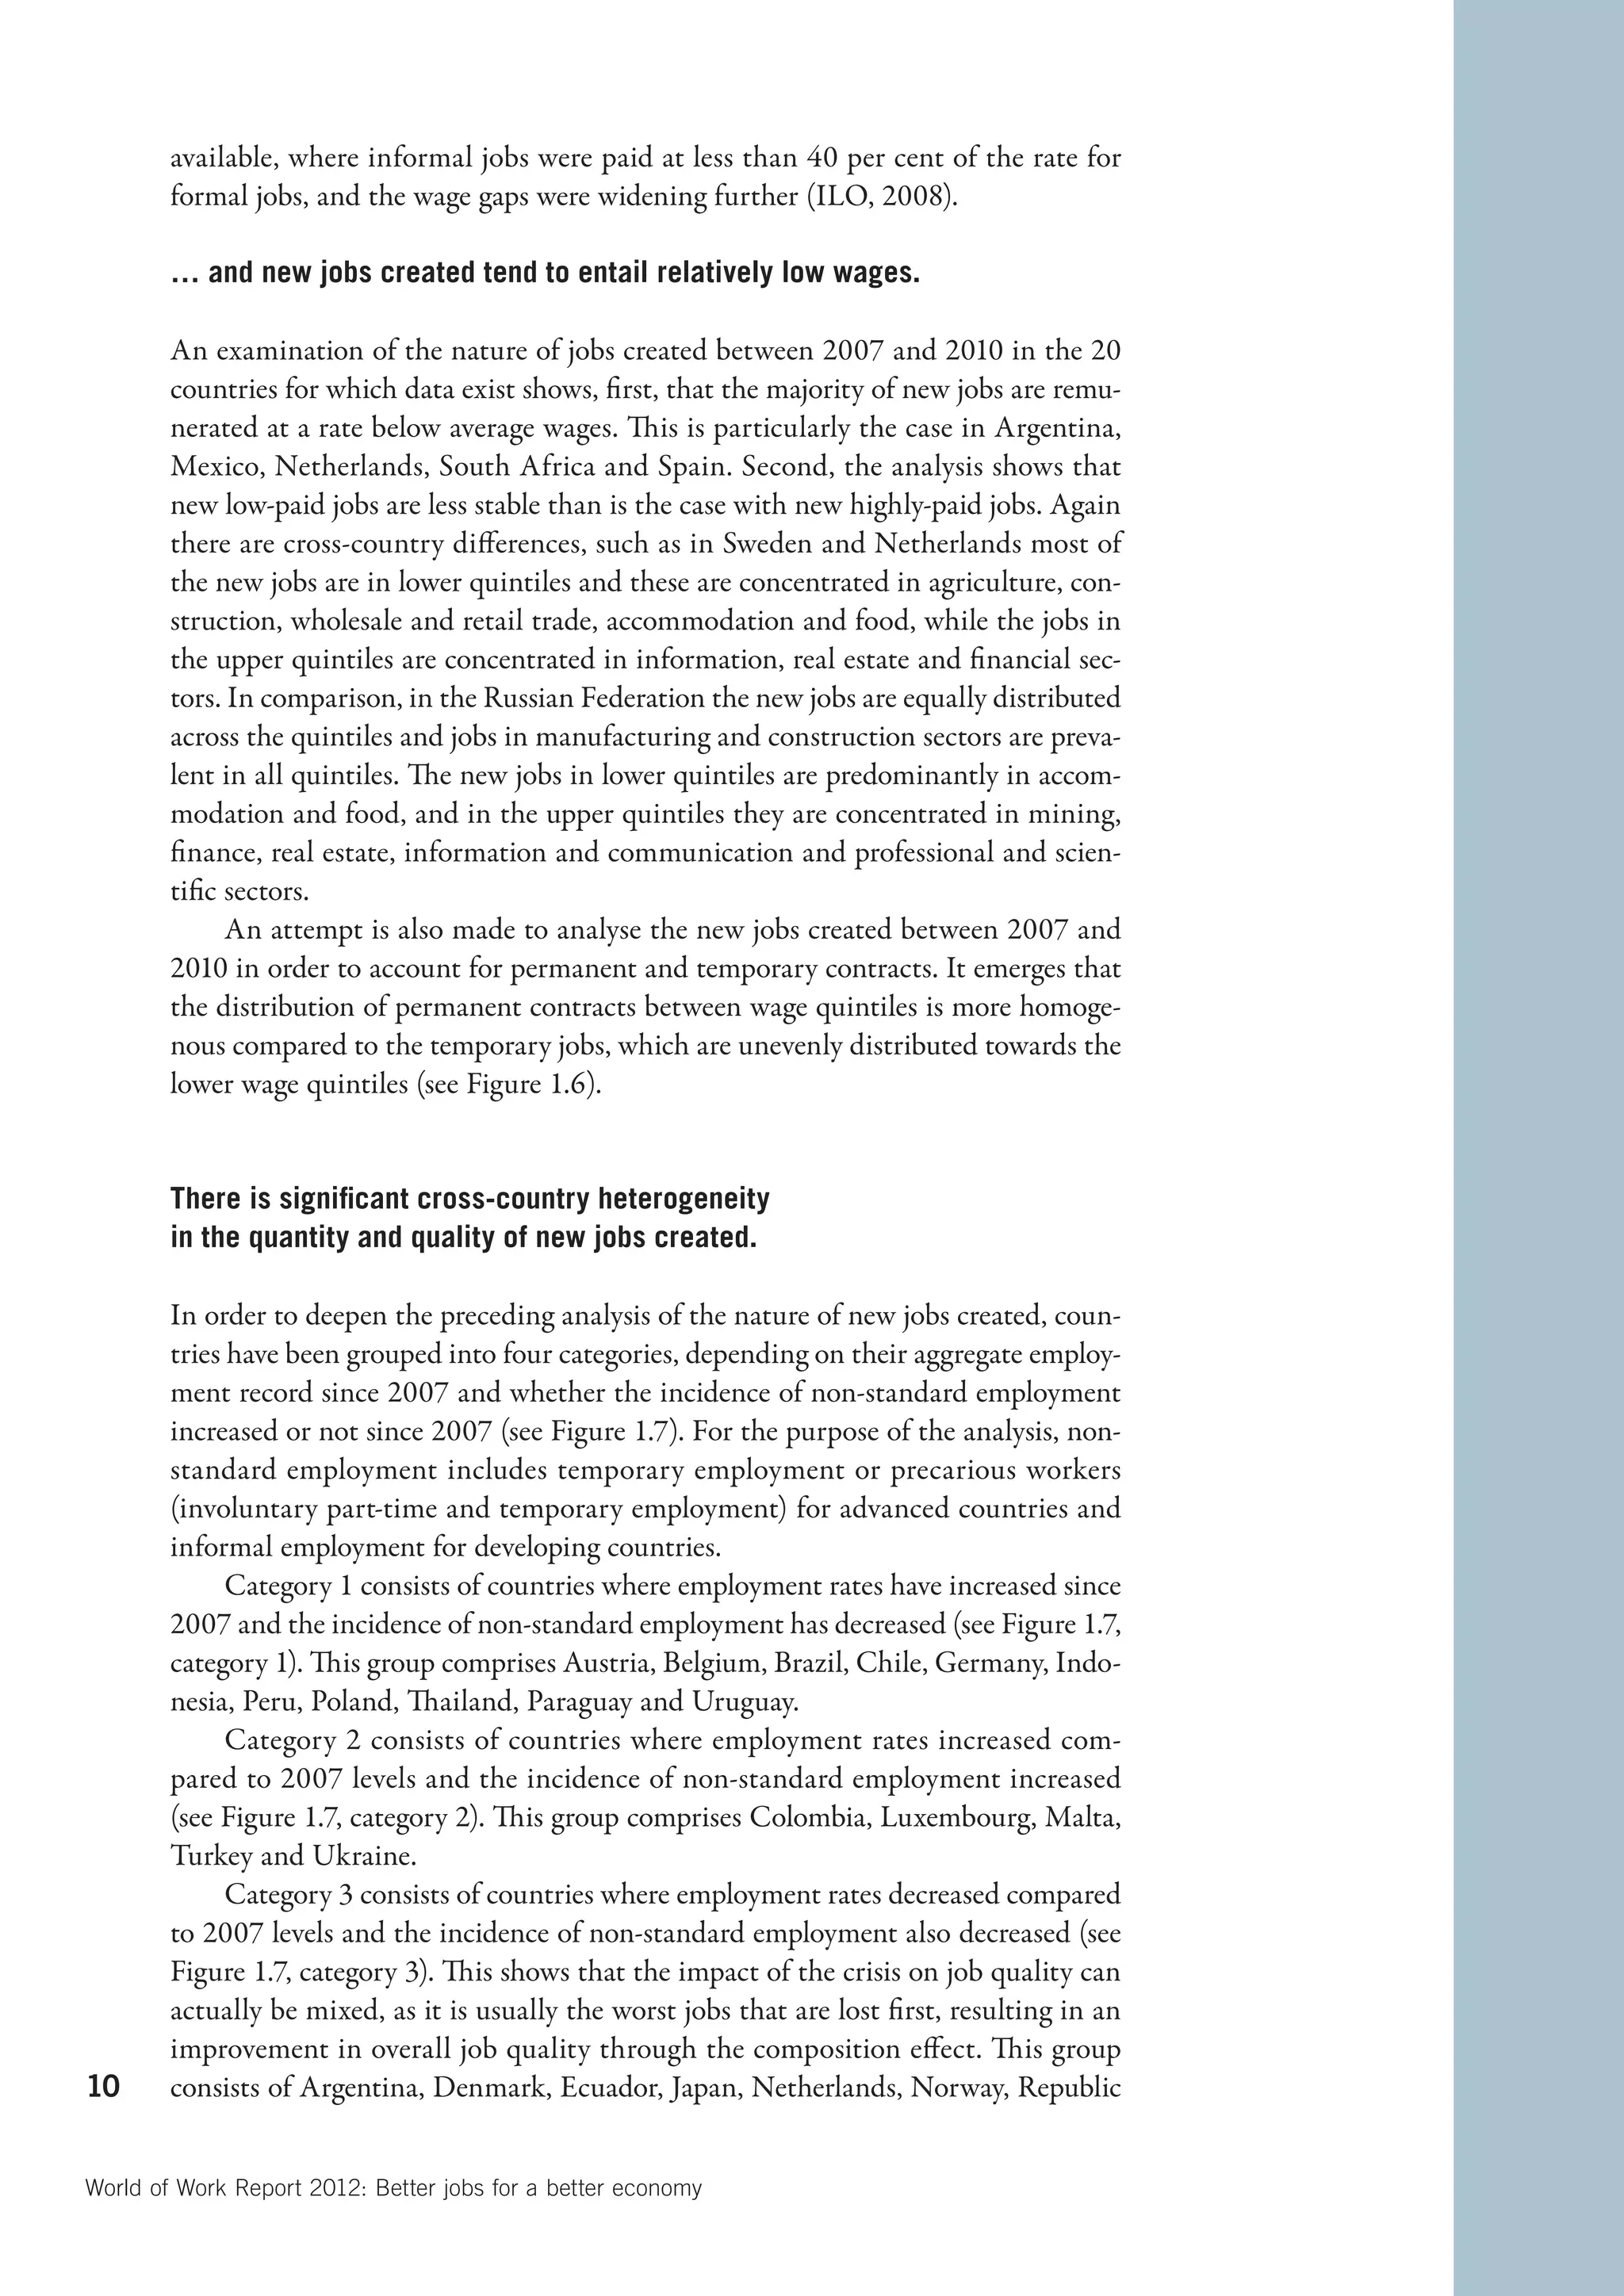
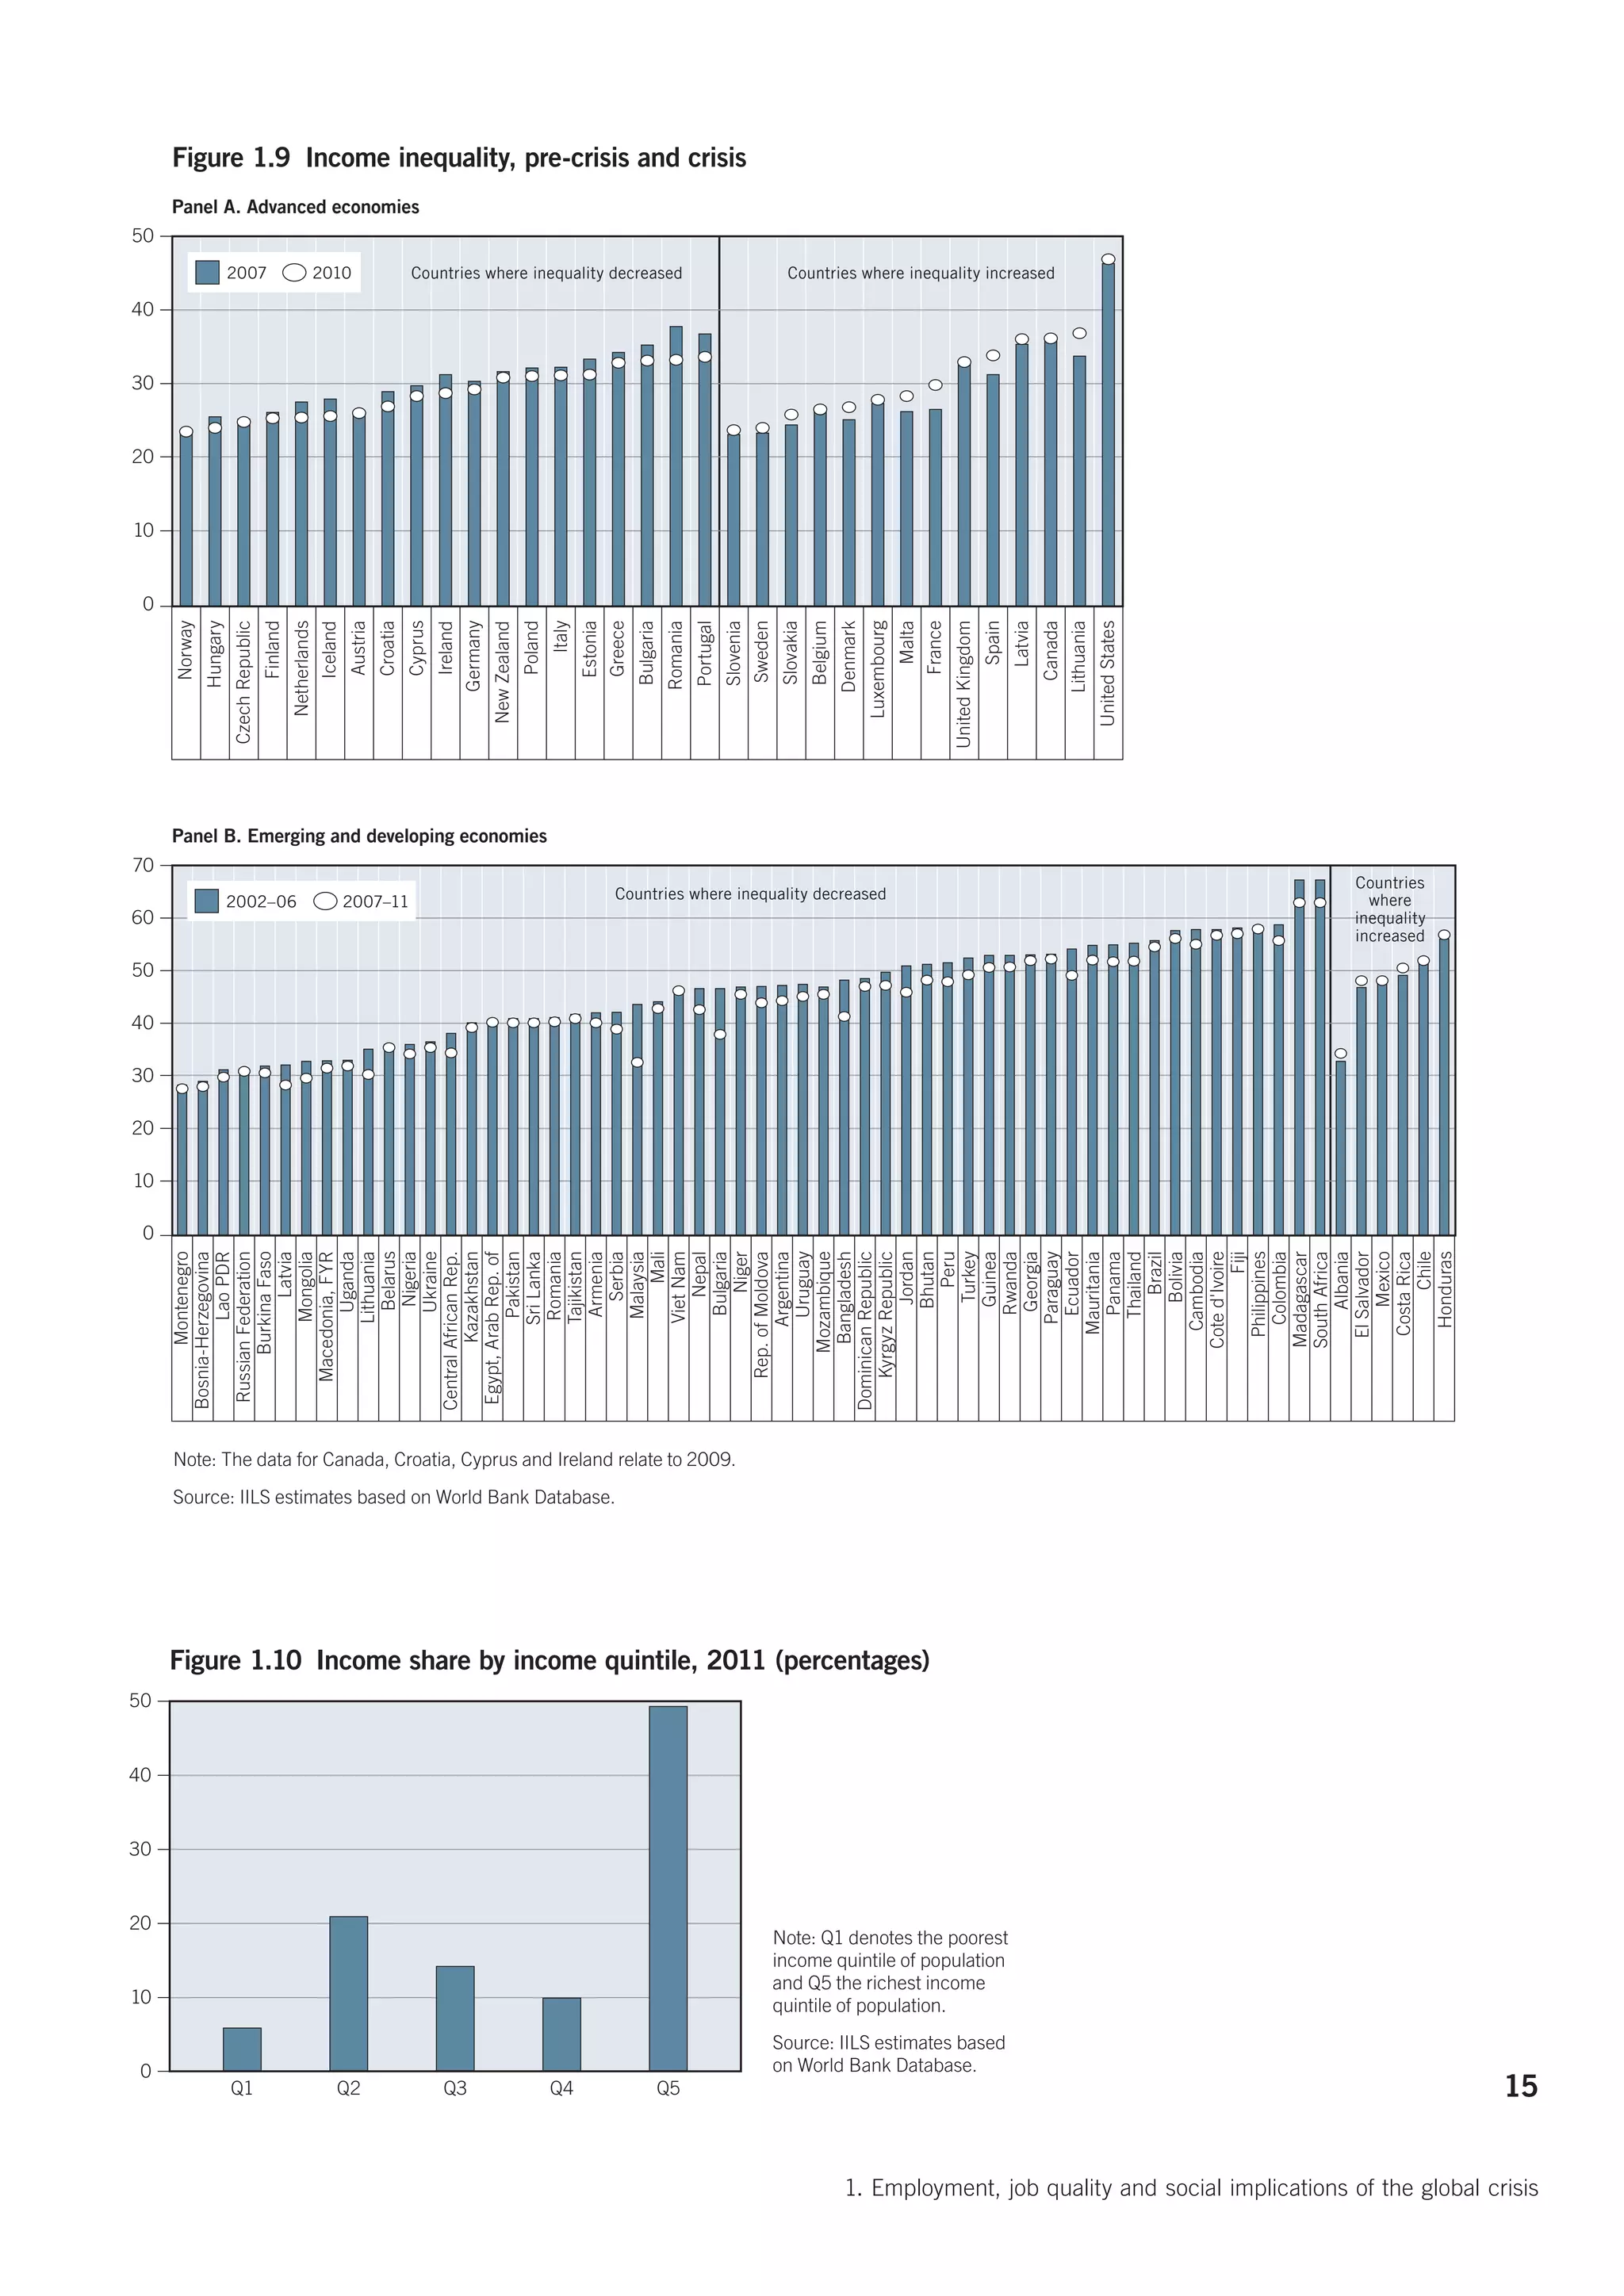
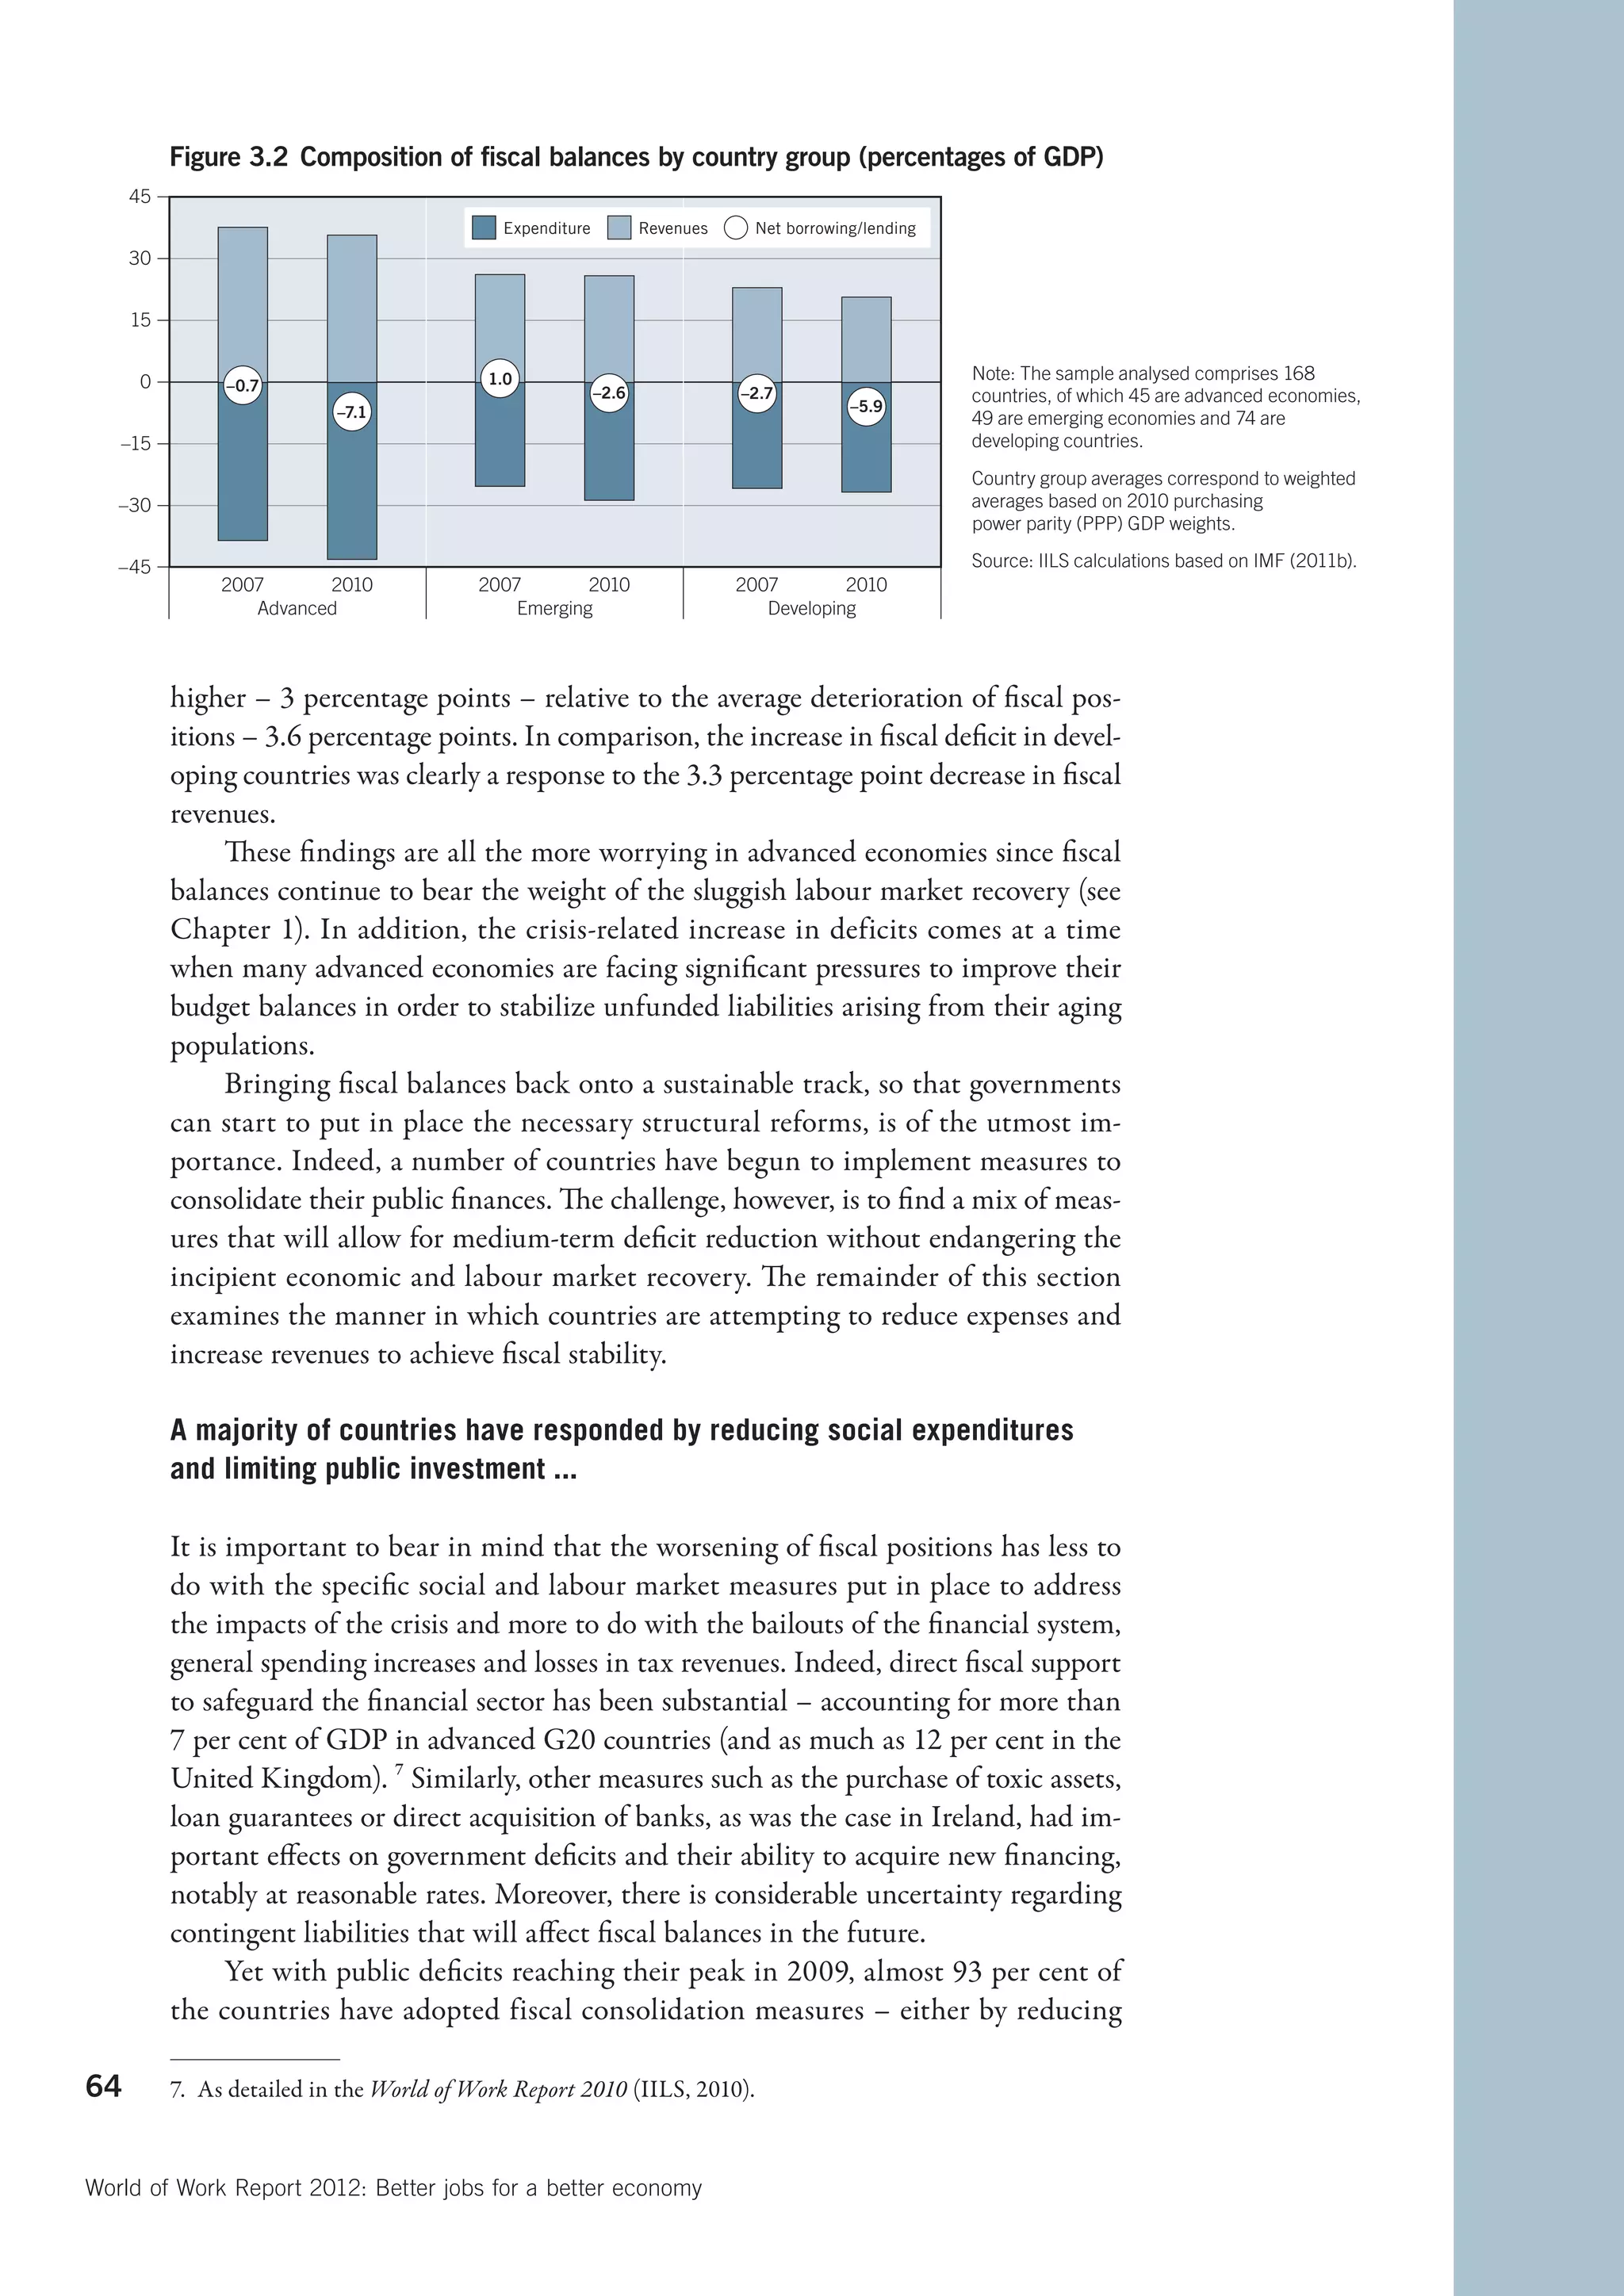
during this crisis. This is surprising given that both these countries observed a
decline in minimum wages by 20 and 25 per cent respectively, which should have
led to a decline in purchasing power and also increase in poverty.
One of the obstacles to reducing poverty is its intergenerational transmission
from parents to children, which increases the long-term probability that the poor
will remain in poverty. One of the reasons why certain groups are trapped in pov-
erty is due to low pay.8 “Historically poverty was associated with joblessness” (Luci-
fora and Salverda, 2009); however, today an increasing number of those who are
8. Low pay is defined by the ILO as “the proportion of workers whose hourly wages [are] less than
two-thirds of the median wage across all jobs” (ILO, 2010a). 13
1. Employment, job quality and social implications of the global crisis](https://image.slidesharecdn.com/oitworldofworkreport2012-120430075625-phpapp02/75/OIT-world-of-work-report-2012-32-2048.jpg)
![References
Ahmad, A. 2003. Inequality in the access to education and poverty in Bangladesh
(Department of Economics, Lund University). Available at: http://www.nek.lu.se/
publications/workpap/Papers/WP03_5.pdf [14 Apr. 2012].
Amuedo-Dorantes, C.; Serrano-Padial, R. 2005. “Fixed-term employment and its
poverty implications: Evidence from Spain”, in Focus, Vol. 23, No. 3, pp. 42-51.
Blanchard, O.; Landier, A. 2002. “The perverse effects of partial labour market reform:
Fixed-term contracts in France”, in Economic Journal, Vol. 112, No. 480, pp. F214–
F244. Available at: http://ideas.repec.org/a/ecj/econjl/v112y2002i480pf214-f244.
html [14 Apr. 2012]..
Booth, A.L.; Francesconi, M.; Frank, J. 2000. “Temporary jobs: Stepping stones or
dead ends?”, IZA Discussion Paper No. 205, Oct. (Bonn, Institute for the Study
of Labor (IZA)). Available at: http://ideas.repec.org/p/iza/izadps/dp205.html
[14 Apr. 2012].
Brixiová, Z.; Ndikumana, L. 2010. “Supporting Africa’s Post-crisis growth: The role
of macroeconomic policies”, Working Paper Research No. 117 (Tunis, African
Development Bank). Available at: http://www.afdb.org/fileadmin/uploads/afdb/
Documents/Project-related-Procurement/WORKING%20117%20word%20
document_ASS_.pdf [14 Apr. 2012].
Callan, T.; Leventi C.; Levy H., Matsaganis M.; Paulus A.; Sutherland H. 2011. The
Distributional Effects of Austerity Measures: a Comparison of Six EU Countries.
European Commission; Employment, Social Affairs and Inclusion; Social
Situation Observatory. Available at: http://www.socialsituation.eu/research-notes/
SSO2011%20RN2%20Austerity%20measures_final.pdf [5 March 2012].
Cockx, B; Picchio, M. 2011. “Scarring effects of remaining unemployed for long-term
unemployed school-leavers”, IZA Discussion Paper No. 5937 (Bonn, Institute for
the Study of Labor (IZA)).
D’Addio, A.C.; Rosholm, M. 2005. “Temporary employment in Europe: Characteristics,
determinants and outcomes”, in Brussels Economic Review, Vol. 48, No. 1–2,
pp. 13–42.
Dolado, J.J.; Garcia-Serrano, C.; Jimeno, J.F. 2002. “Drawing lessons from the boom
of temporary jobs in Spain”, in Economic Journal, Vol. 112, No. 721, pp.270-295.
Available at: http://ideas.repec.org/a/ecj/econjl/v112y2002i721pf270-f295.html
[14 Apr. 2012].
Economic Commission for Latin America and the Caribbean (ECLAC). 2012.
Preliminary overview of the economies of Latin America and the Caribbean
(Santiago, Chile, United Nations).
Escudero, V. 2009. “Effects of the Crisis on the Financial Sector: Trends and Policy
Issue”, Discussion Paper No. 197 (Geneva, International Institute for Labour
Studies, ILO).
European Central Bank (ECB). 2010. Survey on the access to finance of small and
medium-sized enterprises in the euro area: Second half of 2009. Available at: http://
www.ecb.int/pub/pdf/other/accesstofinancesmallmediumsizedenterprises201002en.
pdf [14 Apr. 2012].
—. 2011. Survey on the access to finance of SMEs in the euro area: April
to September 2011. Available at: http://www.ecb.int/pub/pdf/other/
accesstofinancesmallmediumsizedenterprises201112en.pdf [14 Apr. 2012].
Food and Agricultural Organisation (FAO). 2011. The State of Food and Agriculture.
Rome: FAO. http://www.fao.org/docrep/013/i2050e/i2050e.pdf [14 Apr. 2012].
Farber, H.S. 1999. “Alternative and art-time employment arrangements as a response to
job loss”, in Journal of Labor Economics, Vol. 17, No. 4, pp. 142–169.
Gagliarducci, S. 2005. “The dynamics of repeated temporary jobs”, in Labour Economics,
Vol. 12, No. 4, pp. 429–448.
Gartell, M. 2009. “Unemployment and subsequent earnings for Swedish college graduates:
A study of scarring effects”, Finland, Institute for Futures Studies, Working Paper
No. 2. Available at: http://www.ifau.se/upload/pdf/se/2009/wp09-10.pdf
Houseman, S.; Osawa, M. 2003. Nonstandard work in developed economies: Causes and
32 consequences (Michigan, W.E. John Institute for Employment Research).
World of Work Report 2012: Better jobs for a better economy](https://image.slidesharecdn.com/oitworldofworkreport2012-120430075625-phpapp02/75/OIT-world-of-work-report-2012-51-2048.jpg)
![International Fund for Agricultural Development (IFAD). 2010. Rural Poverty Report 2011
(Rome). Available at: http://www.ifad.org/rpr2011/report/e/rpr2011.pdf [15 Apr. 2012].
International Labour Office (ILO). 2008. World of Work Report: Income inequalities in
the age of financial globalization (Geneva)
—. 2010a. Global Wage Report: Wage policies in time of crisis (Geneva).
—. 2010b. World of Work Report 2010: From one crisis to the next? (Geneva).
—. 2011. World of Work Report 2011: Making markets work for jobs (Geneva).
—. 2012. Global Employment Trends: Preventing a deeper jobs crisis (Geneva).
—. 2012b. Men and Women in Informal Economy: A statistical picture (Geneva).
Institute for Health Metrics and Evaluation (IHME). 2010. Financial Global Health,
Development Assistance and Country Spending in Economic Uncertainty (Seattle,
WA). Available at: http://www.healthmetricsandevaluation.org/sites/default/files/
policy_report/2010/Report_Overview_%20FGH_2010_051111.pdf [20 Apr. 2012].
—. 2011. Financing Global Health, Continued Growth as MDG Deadline Approaches
(Seattle, WA). Available at: http://www.healthmetricsandevaluation.org/sites/
default/files/policy_report/2011/FGH_2011_overview_IHME.pdf [20 Apr. 2012].
Institute of Development Studies (IDS). 2009. Accounts of crisis: Poor people’s experiences
of the food, fuel and financial crises in five countries. Available at: http://www.ids.
ac.uk/files/dmfile/AccountsofCrisisFINAL.pdf [15 Apr. 2012].
Kahn, L.M. 2010. “Employment protection reforms, employment and the incidence of
temporary jobs in Europe: 1996–2001”, in Labour Economics, Vol. 17, No. 1, pp. 1–15.
Kalleberg, A.L. 2009. “Precarious work, insecure workers: Employment relations in
transition”, in American Sociological Review, Vol. 74, No. 1, pp. 1–22.
Kentikelenis, A.; Karanikolos, M; Papanicolas, I.; Basu, S.; McKee, M.; Stuckler, D.
2011. “Health effects of financial crisis: Omens of a Greek tragedy”, in The Lancet,
Vol. 378, No. 9801, pp. 1457–1458.
Kūla, E.; Lāce, T.; Vaskis, E.; Veretjanovs, V. 2011. Poverty situation and changes in social
assistance system in Latvia due to crisis, Improving the efficiency of social protection,
Portugal: Peer Review in Social Protection, European Commission. Available at:
http://www.peer-review-social-inclusion.eu/peer-reviews/2011/improving-the-
efficiency-of-social-protection [15 Apr. 2012].
Laeven, L.; Valencia, F. 2008. “Systemic banking crises: A new database”. Working Paper
No. 224 (Washington, DC, IMF).
——. 2010. “Resolution of banking crises: The good, the bad, and the ugly”. Working
Paper No. 164 (Washington, DC, IMF).
Lucifora, C.; Salverda, W. 2009. “Low pay”, in The Oxford handbook of economic
inequality, W. Salverda, B. Nolan and T. Smeeding (eds) (Oxford, Oxford
University Press), pp. 257–283.
McCann, F. 2011. “Access to credit amongst SMEs: Pre and post-crisis evidence from
Eastern Europe”, in Economic Letters, Issue 3. Available at: http://ideas.repec.org/a/
cbi/ecolet/y2011v2011i3.html [15 Apr. 2012].
Ministry of Finance and Planning. 2011. “Sri Lanka Labour Force Survey: Annual
report 2010” (Colombo, Department of Census and Statistics).
Mroz, T.A.; Savage, T.H. 2006. “The long-term effects of youth unemployment”, in
Journal of Human Resources, Vol. 41, No. 2, pp. 259–293.
Muñoz de Bustillo, R.; Pedraza, P. de 2010. “Determinants of job insecurity in five European
countries”, in Economic Journal of Industrial Relations, Vol 16, No. 1, pp. 5-20.
Panorama Laboral. 2011. América Latina y el Caribe. (Lima, OIT).
(OECD). 2011. OECD Economic Survey, Greece. (Paris).
Rani, U.; Belser, P. (Forthcoming). “The effectiveness of minimum wages in developing
countries: The case of India”, in International Journal of Labour Research.
Salladarre, F.; Hlaimi, B. 2007. “Analysis of the determinants of temporary employment
in 19 European countries”, Working Paper, HAL. Available at: http://ideas.repec.
org/p/hal/wpaper/hal-00174817.html [15 Apr. 2012].
Sanogo, I. 2009. “The global food price crisis and household hunger a review of recent
food security assessments”, in Humanitarian Exchange Magazine, Vol. 42. Available
at: http://www.odihpn.org/humanitarian-exchange-magazine/issue-42/the-global-
food-price-crisis-and-household-hunger-a-review-of-recent-food-security-assessments
[15 Apr. 2012]. 33
1. Employment, job quality and social implications of the global crisis](https://image.slidesharecdn.com/oitworldofworkreport2012-120430075625-phpapp02/75/OIT-world-of-work-report-2012-52-2048.jpg)
![Seshanna, S.; Decornez, S. 2003. “Income polarization and inequality across countries:
An empirical study”, in Journal of Policy Modeling, Vol. 25, No. 4, pp. 335-358.
Stancanelli, E.G.F. 2002. “Do temporary jobs pay? Wages and career perspectives of
temporary workers”, in Labour, Vol. 16, No.4, pp. 667–705.
Tijdens, K.; van Zijl, S.; Hughie-Williams, M.; van Klaveren, M.; Steinmetz, S. 2010.
“Codebook and explanatory note on the wageindicator dataset”. Working Paper
10-102 (Amsterdam, Amsterdam Institute for Advanced labour studies).
Torche, F.; Spilerman, S. 2008. “Household wealth in Latin America”, in Personal wealth
from a global perspective, J.B. Davies (ed.) (Oxford, Oxford University Press for
UNU-WIDER).
Tucker, D. 2002. “‘Precarious’ non-standard employment: A review of literature”
(Wellington, Department of Labour, Government of New Zealand).
United Nations Department of Economic and Social Affairs (UNDESA). 2005.
Report on the World Social Situation: The inequality predicament (New York,
United Nations). Available at: http://www.sustainable-design.ie/sustain/un2005_
ReportWorldSocialSystem.pdf [15 Apr. 2012].
—. 2010. Report on the World Social Situation: Rethinking poverty (New York, United
Nations).
—. 2012. World Economic Situation and Prospects 2012: Global Economic Outlook (New
York, United Nations).
United Nations Educational, Scientific and Cultural Organization (UNESCO).
2011. The hidden crisis: Armed conflict and education, EFA Global Monitoring
Report (Paris, UNESCO Publishing). Available at: http://unesdoc.unesco.org/
images/0019/001907/190743e.pdf [15 Apr. 2012].
Vanek, J.; Chen, M.; Hussmanns, R.; Heintz, J.; Carre, F. (Forthcoming). Men and
Women in Informal Economy: A statistical picture (Geneva, ILO)
World Bank. 2011. World Development Indicators (Washington, DC).
World Bank; International Monetary Fund (IMF). 2010. Global Monitoring Report: The
MDGs after the crisis (Washington, DC). Available at: http://www-wds.worldbank.
org/external/default/WDSContentServer/IW3P/IB/2010/05/11/000333037_2010
0511001700/Rendered/INDEX/544380PUB0EPI01BOX0349416B01PUBLIC1.
txt. [15 Apr. 2012].
34
World of Work Report 2012: Better jobs for a better economy](https://image.slidesharecdn.com/oitworldofworkreport2012-120430075625-phpapp02/75/OIT-world-of-work-report-2012-53-2048.jpg)


![References
Ardagna, S. 2001. “Fiscal policy composition, public debt, and economic activity”, in
Public Choice, Vol. 109, pp. 301–325.
Arellano, M.; Bond, S. 1991. “Some tests of specification for panel data: Monte Carlo
evidence and an application to employment equations”, in Review of Economic
Studies, Vol. 58, No. 2, Apr., pp. 277–297.
Baum, F.C.; Schaffer, M.E.; Stillman, S. 2003. Instrumental variables and GMM:
Estimation and testing, Working Paper No. 454, Feb. (Boston, MA, Boston
College).
Barnett, S., Brooks, R. 2010, “China: Does Government Health and Education
Spending Boost Consumption?”, IMF Working Paper No. 10/16.
Baxter, M.; King, R.G. 1993. “Fiscal policy in general equilibrium”, in American
Economic Review, Vol. 83, June, pp. 315–334.
Blinder, A.S; Solow, R.M. 1973. “Does fiscal policy matter?”, in Journal of Public
Economics, Vol. 2, pp. 319–337.
Blundell, R. and Bond, S. 1997. “Initial conditions and moment restrictions in dynamic
panel data models”, in Journal of Econometrics, Vol. 87, pp. 115–143.
Canzoneri, M.; Cumby, R.E.; Diba, B.T. 2005.“The need for international policy
coordination: What’s old, what’s new, what’s yet to come?”, in Journal of
International Economics, Vol. 66, Issue 2, pp. 363–384.
Cecchetti G.S.; Mohanty M.S.; Zampolli F. 2010.The future of public debt: Prospects and
implication, Working Papers No. 300 (Basel, Bank of International Settlements).
Charpe; M.; Kühn, S. (2012) “ILO friendly policies and crisis recovery: An ILO
modelling assessment”, mimeo, (Geneva, International Institute for Labour
Studies, ILO) .
Cooley, F.; Quadrini, V. 2002. “Common currencies vs. monetary independence”,
Working Paper (New York University).
Dalsgaard, T.; André, C.; Richardson, P. 2001. Standard shocks in the OECD interlink
model, Economics Department Working Paper No. 306, Sep., ECO/WKP(2001)32
(OECD, Paris).
Escudero, V.; López Mourelo, E. Forthcoming. “Public debt, fiscal consolidation and
the effect on employment”, Discussion Paper No. 213 (forthcoming), (International
Institute for Labour Studies, ILO).
European Commission (EC); International Monetary Fund (IMF); Organisation for
Economic Co-operation and Development (OECD); United Nations (UN); World
Bank (WB). 2009. System of National Accounts 2008.
Fatás, A.; Mihov, I. 2001. “The effects of fiscal policy on consumption and employment:
Theory and evidence”, CEPR Discussion Paper No. 2760, Apr.
Frieden, J. 2009. “Avoiding the worst: International economic cooperation and domestic
politics”, VoxEU, 2 Feb. Available at: http://voxeu.org/index.php?q=node/2956
[7 Apr. 2012].
Gupta, S.; Clements, B.; Baldacci, E.; Mulas-Granados, C. 2005. “Fiscal policy, expenditure
composition and growth in low-income countries”, in Journal of International Money
and Finance, No. 24 (Washington, DC, International Monetary Fund), pp. 441–463.
Hemming, R.; Kell, M.; Mahfouz, S. 2002. “The effectiveness of fiscal policy in
stimulating economic activity: A review of the literature”, IMF Working Paper,
WP/02/208, Dec. 2002 (Washington, DC).
International Institute for Labour Studies. 2010. World of Work Report 2010: From one
crisis to the next (Geneva, International Labour Organization).
International Monetary Fund (IMF). 2001. Government Finance Statistics Manual 2001
(Washington, DC).
—. 2011a. World Economic Outlook: Slowing growth, rising risks, Sep. (Washington, DC).
—. 2011b. Public Sector Debt Statistics: Guide for compilers and users (Washington, DC).
—. 2012. World Economic Outlook Update: Global recovery stalls, downside risks intensify,
Jan. (Washington, DC).
Keho, Y. 2010. “Budget deficits and economic growth: Causality evidence and policy
implications for WAEMU countries”, in European Journal of Economics, Finance
78 and Administrative Sciences, Issue 18, pp. 99–104.
World of Work Report 2012: Better jobs for a better economy](https://image.slidesharecdn.com/oitworldofworkreport2012-120430075625-phpapp02/75/OIT-world-of-work-report-2012-97-2048.jpg)
![Kneller, R.; Bleaney, M.F.; Gemmell, N. 1999. “Fiscal policy and growth: Evidence from
OECD countries”, in Journal of Public Economics, Vol. 74, Issue 2, pp. 171–190.
Kollmann, R. 2002. “Monetary policy rules in an interdependent world”, Working
Paper (University of Bonn).
Layard, R.; Nickell, S. 1986.“Unemployment in Britain”, in Economica, Vol. 53, No. 210,
pp. S121–S169.
Lequiller, F.; Blades, D. 2006. Understanding national accounts (Paris, Organisation for
Economic Co-operation and Development).
Ludvigson, S. 1996. “The macroeconomic effects of government debt in a stochastic
growth model”, Journal of Monetary Economics, Vol. 38, Mar., pp. 25–45.
Martner, R.; Tromben, V. 2004. “La sostenibilidad de la deuda pública”, in Revista de la
CEPAL, No. 84, Dec.
Monacelli, T.; Perotti, R.; Trigari, A. 2010. “Unemployment fiscal multipliers”, in Journal
of Monetary Economics, Vol. 57, No. 5, pp. 531–553.
Oudiz, G.; Sachs, J.; Blanchard, O.; Marris, S. N.; Woo, W.T. 1984. “Macroeconomic
policy coordination among the industrial economies”, in Brookings Papers
on Economic Activity, Vol. 1984, No. 1, pp. 1–75 (The Brookings Institution,
Washington, DC).
Pappa, E. 2002. “Do the ECB and the Fed really need to cooperate? Optimal monetary
policy in a two-country world”, Working Paper (London School of Economics).
—. 2009. “The effects of fiscal shocks on employment and the real wage”, in International
Economic Review, Vol. 50, No. 1, pp. 217–244.
Pauvanic, I. 2005. “Public debt sustainability in the northern countries of Latin
America”, in Revista de la Cepal, No. 87, Dec.
Presbitero, A.F. 2006. The debt-growth nexus in poor countries: A reassessment,
Proceedings of the German Development Economics Conference, Berlin 2006,
Verein für Socialpolitik, Research Committee Development Economics, No. 22.
Available at: http://www.econstor.eu/handle/10419/19848 [7 Apr. 2012].
Roodman, D. 2006. How to do xtabond2: An introduction to “Difference” and “System”
GMM in Stata, Working Paper, No. 103, Dec. (Washington, DC, Center for
Global Development).
Soto, M. 2010. System GMM estimation with small sample (Barcelona, Instituto de
Análisis Económico).
Sutherland, A. 2002.“International monetary policy coordination and financial market
integration”, Working Paper No. 174, European Central Bank.
Tchakarov, I. 2002. “The gains from international monetary cooperation revisited”,
Working Paper (University of California, Davis).
Windmeijer, F. 2005. “A finite sample correction for the variance of linear two-step
GMM estimators”, in Journal of Econometrics, Vol. 126(1), pp. 25–51.
79
3. Fiscal consolidation and employment growth](https://image.slidesharecdn.com/oitworldofworkreport2012-120430075625-phpapp02/75/OIT-world-of-work-report-2012-98-2048.jpg)

![References
Bachmann, R.; Elstner, S.; Sims, E. 2011. Uncertainty and economic activity, mimeo
(University of Michigan).
Baker, S.; Bloom, N.; Davis, S. 2012. Measuring economic policy uncertainty, mimeo
(University of Stanford).
Baum, C.; Caglayan, M.; Ozkan, N.; Talavera, O. 2004. “The impact of macroeconomic
uncertainty on cash holdings for non-financial firms”, Working Paper No. 04/19,
June (University of Leicester, Department of Economics).
Beck, T.; Demirguc-Kunt, A; Maksimovic, V. 2008. “Financing patterns around the world:
Are small firms different?”, in Journal of Financial Economics, vol. 89, No. 3, Sep.
Belser, P.; Lee, S. 2011. “Wages and economic crisis: Towards a new perspective on
wages, productivity and economic growth”, in The global crisis, causes, responses and
challenges (Geneva, International Labour Organization), pp. 151–165.
Bhaduri, M.; Marglin, S. 1990. “Unemployment and the real wage: The economic basis
for contesting political ideologies”, in Cambridge Journal of Economics, No. 14,
pp. 375–393.
Bhagat, S.; Obreja, J. 2011. “Employment corporate investment and cash flow uncertainty”,
29 Oct. 2011 (Department of Finance, University of Colorado at Boulder).
Bigelli, M.; Sànchez-Vidal, J. 2011. “Cash holdings in private firms”, in Journal of
Banking and Finance, vol. 36, pp. 26-35.
Bloom, N. 2009, “The impact of uncertainty shocks”, in Econometrica, vol. 77,
pp. 623–685.
Brooks, D.; Go, E. 2011. “Infrastructure’s role in sustaining Asia’s growth”, Economics
Working Paper Series, No. 294, Dec. (Asian Development Bank).
Chuan, L. 2007. “Infrastructure development in China”, in N. Kumar (ed.): Economic
Research Project Report 2007, No. 2 International infrastructure development in East
Asia: Towards balanced regional development and integration. Available at: http://
www.eria.org/research/no2.html [13 Apr. 2012].
Citigroup Global Markets. 2011. India equity strategy, Heartland hues: Up and down
in UP, 6 Sep.
Cochrane, J. 2012. “Stimulus and etiquette”, in The Grumpy Economist. Available at: http://
johnhcochrane.blogspot.com/2012/01/stimulus-and-etiquette.html [13 Apr. 2012].
Communications Workers of America. 2008. “Proposals to stimulate broadband
investment”, letter to the House Speaker and Senate Majority Leader, 9 Dec. 2008.
Delong, B. 2008. Lessons from the Great Depression blogging. Available at: http://delong.
typepad.com/sdj/2008/11/lessons-from-th.html [13 Apr. 2012].
—. 2012. The limits of monetary policy in a liquidity trap. Available at: http://
seekingalpha.com/article/426621-the-limits-of-monetary-policy-in-a-liquidity-trap
[13 Apr. 2012].
DeMarzo, P.; Uuliy, S. 2006, “Optimal security design and dynamic capital structure in
a continuous time agency model”, in Journal of Finance, vol. 61, pp. 2681–2724.
Evans, C.L. 2010. “A perspective on the future of U.S. monetary policy”, speech at a
conference sponsored by the Bank of France, The Future of Monetary Policy, Rome,
Italy, 1 Oct.
Fernandez-Villaverde, J.; Guerron-Quintana, P.; Kuester , K.; Rubio-Ramirez, J. 2011.
Fiscal volatility shocks and economic activity, mimeo (University of Pennsylvania).
Food and Agriculture Organization (FAO). 2001. Water harvesting in western and
central Africa (Accra, Ghana, Regional Office for Africa).
Fontanella-Khan, J.; Lamont, J. 2012. “Rural India enjoys consumption boom”, in
Financial Times, 29 Feb.
Gabas, J.J. 2011. “Les investissements agricoles en Afrique”, in Afrique Contemporaine,
No. 237, pp. 47–55.
Gérard, F. (CIRAD); Alpha, A. (GRET); Beaujeu, R. (IRAM); Levard, L. (GRET);
Maitre d’Hotel, E. (CIRAD); Rouille d’Orfeuil, H. (CIRAD); Bricas, N.
(CIRAD); Daviron, B. (CIRAD); Galtier, F. (CIRAD); Boussard, J.M.
(Académie d’Agriculture). 2011. Managing food price volatility for food security and
development, GREMA. Available at: http://www.csa-be.org/IMG/pdf_Managing_
102 Food_Price_Volatility_for_Food_Security_and_development.pdf [13 Apr. 2012].
World of Work Report 2012: Better jobs for a better economy](https://image.slidesharecdn.com/oitworldofworkreport2012-120430075625-phpapp02/75/OIT-world-of-work-report-2012-121-2048.jpg)
![Gilchrist, S.; Williams, J. 2005. “Investment, capacity and uncertainty: A putty-clay
approach”, in Review of Economic Dynamics, vol. 8, pp. 1 –27.
Han, S.; Qiu, J. 2007. “Corporate precautionary cash holdings”, in Journal of Corporate
Finance, 13, pp. 43–57. Available at: http://www.business.mcmaster.ca/finance/
jiaping/paper/cashholdings.pdf [13 Apr. 2012].
International Labour Office (ILO). 2011. World of Work Report 2011: Making markets
work for jobs (Geneva, International Institute for Labour Studies).
International Monetary Fund (IMF). 2011. World Economic Outlook database, Sep.
(Washington, DC).
Kalecki, M. 1971. Selected essays on the dynamics of the capitalist economy (Cambridge,
Cambridge University Press).
Kerekes, C.B.; Williamson, C.R. 2010. “Propertyless in Peru, even with a Government
land title”, in American Journal of Economics and Sociology, vol. 63, No. 3, July.
Keynes, J.M. 1936. The general theory of employment, interest and money (London,
Macmillan).
—. 1937. “The general theory of employment”, in Quarterly Journal of Economics, vol. 51,
pp. 209–223.
Kohansal, M.R.; Ghorbani M.; Mansoori, H. 2008. “Effect of Credit Accessibility
of Farmers on Agricultural Investment and Investigation of Policy options in
Khorasan-Razavi Province” in Journal of Applied Sciences, vol. 8, pp. 4455-4459.
Krugman, P. 2008. The return of Depression economics and the crisis of 2008 (London,
Penguin Books).
—. 2011. “Even more on 1921”, New York Times. Available at: http://krugman.blogs.
nytimes.com/2011/04/02/even-more-on-1921/ [13 Apr. 2012].
Leahy, J.; Whited, T. 1996. “The effect of uncertainty on investment: Some stylized
facts”, in Journal of Money, Credit and Banking, vol. 28, pp. 64–83.
McCulley, P.; Pozsar, Z. 2012. Does central bank independence frustrate the optimal
fiscal–monetary policy mix in a liquidity trap?, Global Society of Fellows Working
Paper, 26 Mar. Available at: http://www.interdependence.org/wp-content/
uploads/2012/03/Paul-McCulley-Fellows-Paper.pdf [13 Apr. 2012].
Narita, F. 2011. Hidden actions, risk-taking, and uncertainty shocks, mimeo (University of
Minnesota).
Nikiforos, M.; Foley, D. 2011. “Distribution and capacity utilization: Conceptual issues
and empirical evidence”, in Metroeconomica, vol. 63, 1, pp. 200–229.
Panousi, V.; Papanikolaou, D. Forthcoming. “Investment, idiosyncratic risk and
ownership”, in Journal of Finance.
Pastor, L.; Veronesi, P. Forthcoming. “Uncertainty about government policy and stock
prices”, in Journal of Finance.
Qiang, C.Z. 2010. “Broadband infrastructure investment in stimulus packages:
Relevance for developing countries”, in Info, vol. 12, Issue 2, pp. 41–56.
Son, H.; San Andres, E. 2009. How has Asia fared in the financial crisis? A tale of three
countries: Republic of Korea, Philippines and Thailand, Asian Development Bank
Economic Working Paper Series No. 174, Oct.
Slichter, S. 1938. “The downturn of 1937”, in The Review of Economic Statistics 20, Aug.
(Harvard University’s Kennedy School of Government), pp. 97–108.
United Nations Conference on Trade and Development (UNCTAD). 2008. World
Investment Report (Geneva).
—. 2010. Trade and Development Report 2010 (Geneva).
United Nations Department for Economic and Social Affairs (UNDESA). 2012. World
economic situation and prospects (New York).
—. 2008. World Economic and Social Survey 2008: Overcoming economic insecurity (New
York).
United States Census Bureau. 2012. Statistics of U.S. Businesses (SUSB). Available at:
http://www.census.gov/econ/susb/ [14 Apr. 2012].
Weir, S. 1999. The effects of education on farmer productivity in rural Ethiopia, Mar.
(Oxford, Centre for the Study of African Economies).
World Bank (WB). 2012. Global economic prospects: Uncertainties and vulnerabilities
(Washington, DC).
103
4. Investing in a sustainable recovery](https://image.slidesharecdn.com/oitworldofworkreport2012-120430075625-phpapp02/75/OIT-world-of-work-report-2012-122-2048.jpg)


This document provides a summary of the World of Work Report 2012 published by the International Institute for Labour Studies. It outlines that the global jobs crisis has entered a new structural phase as labour markets have not fully recovered from the 2008 crisis. It argues that austerity policies in advanced economies, primarily Europe, have led to a worsening of the situation and have failed to stimulate growth or job creation. However, it notes that alternative approaches exist that could promote employment while meeting fiscal goals through measures like strengthening labour market institutions, restoring credit to small businesses, and shifting fiscal policy.


