
Download to read offline
![Interpreting the data: League Table 4 – Life satisfaction
Lifesatisfactionat4orlessoutof10
Relative life satisfaction gap
Higher life satisfaction gap Lower life satisfaction gap
HigherlifesatisfactionLowerlifesatisfaction
TR
PL
CZ
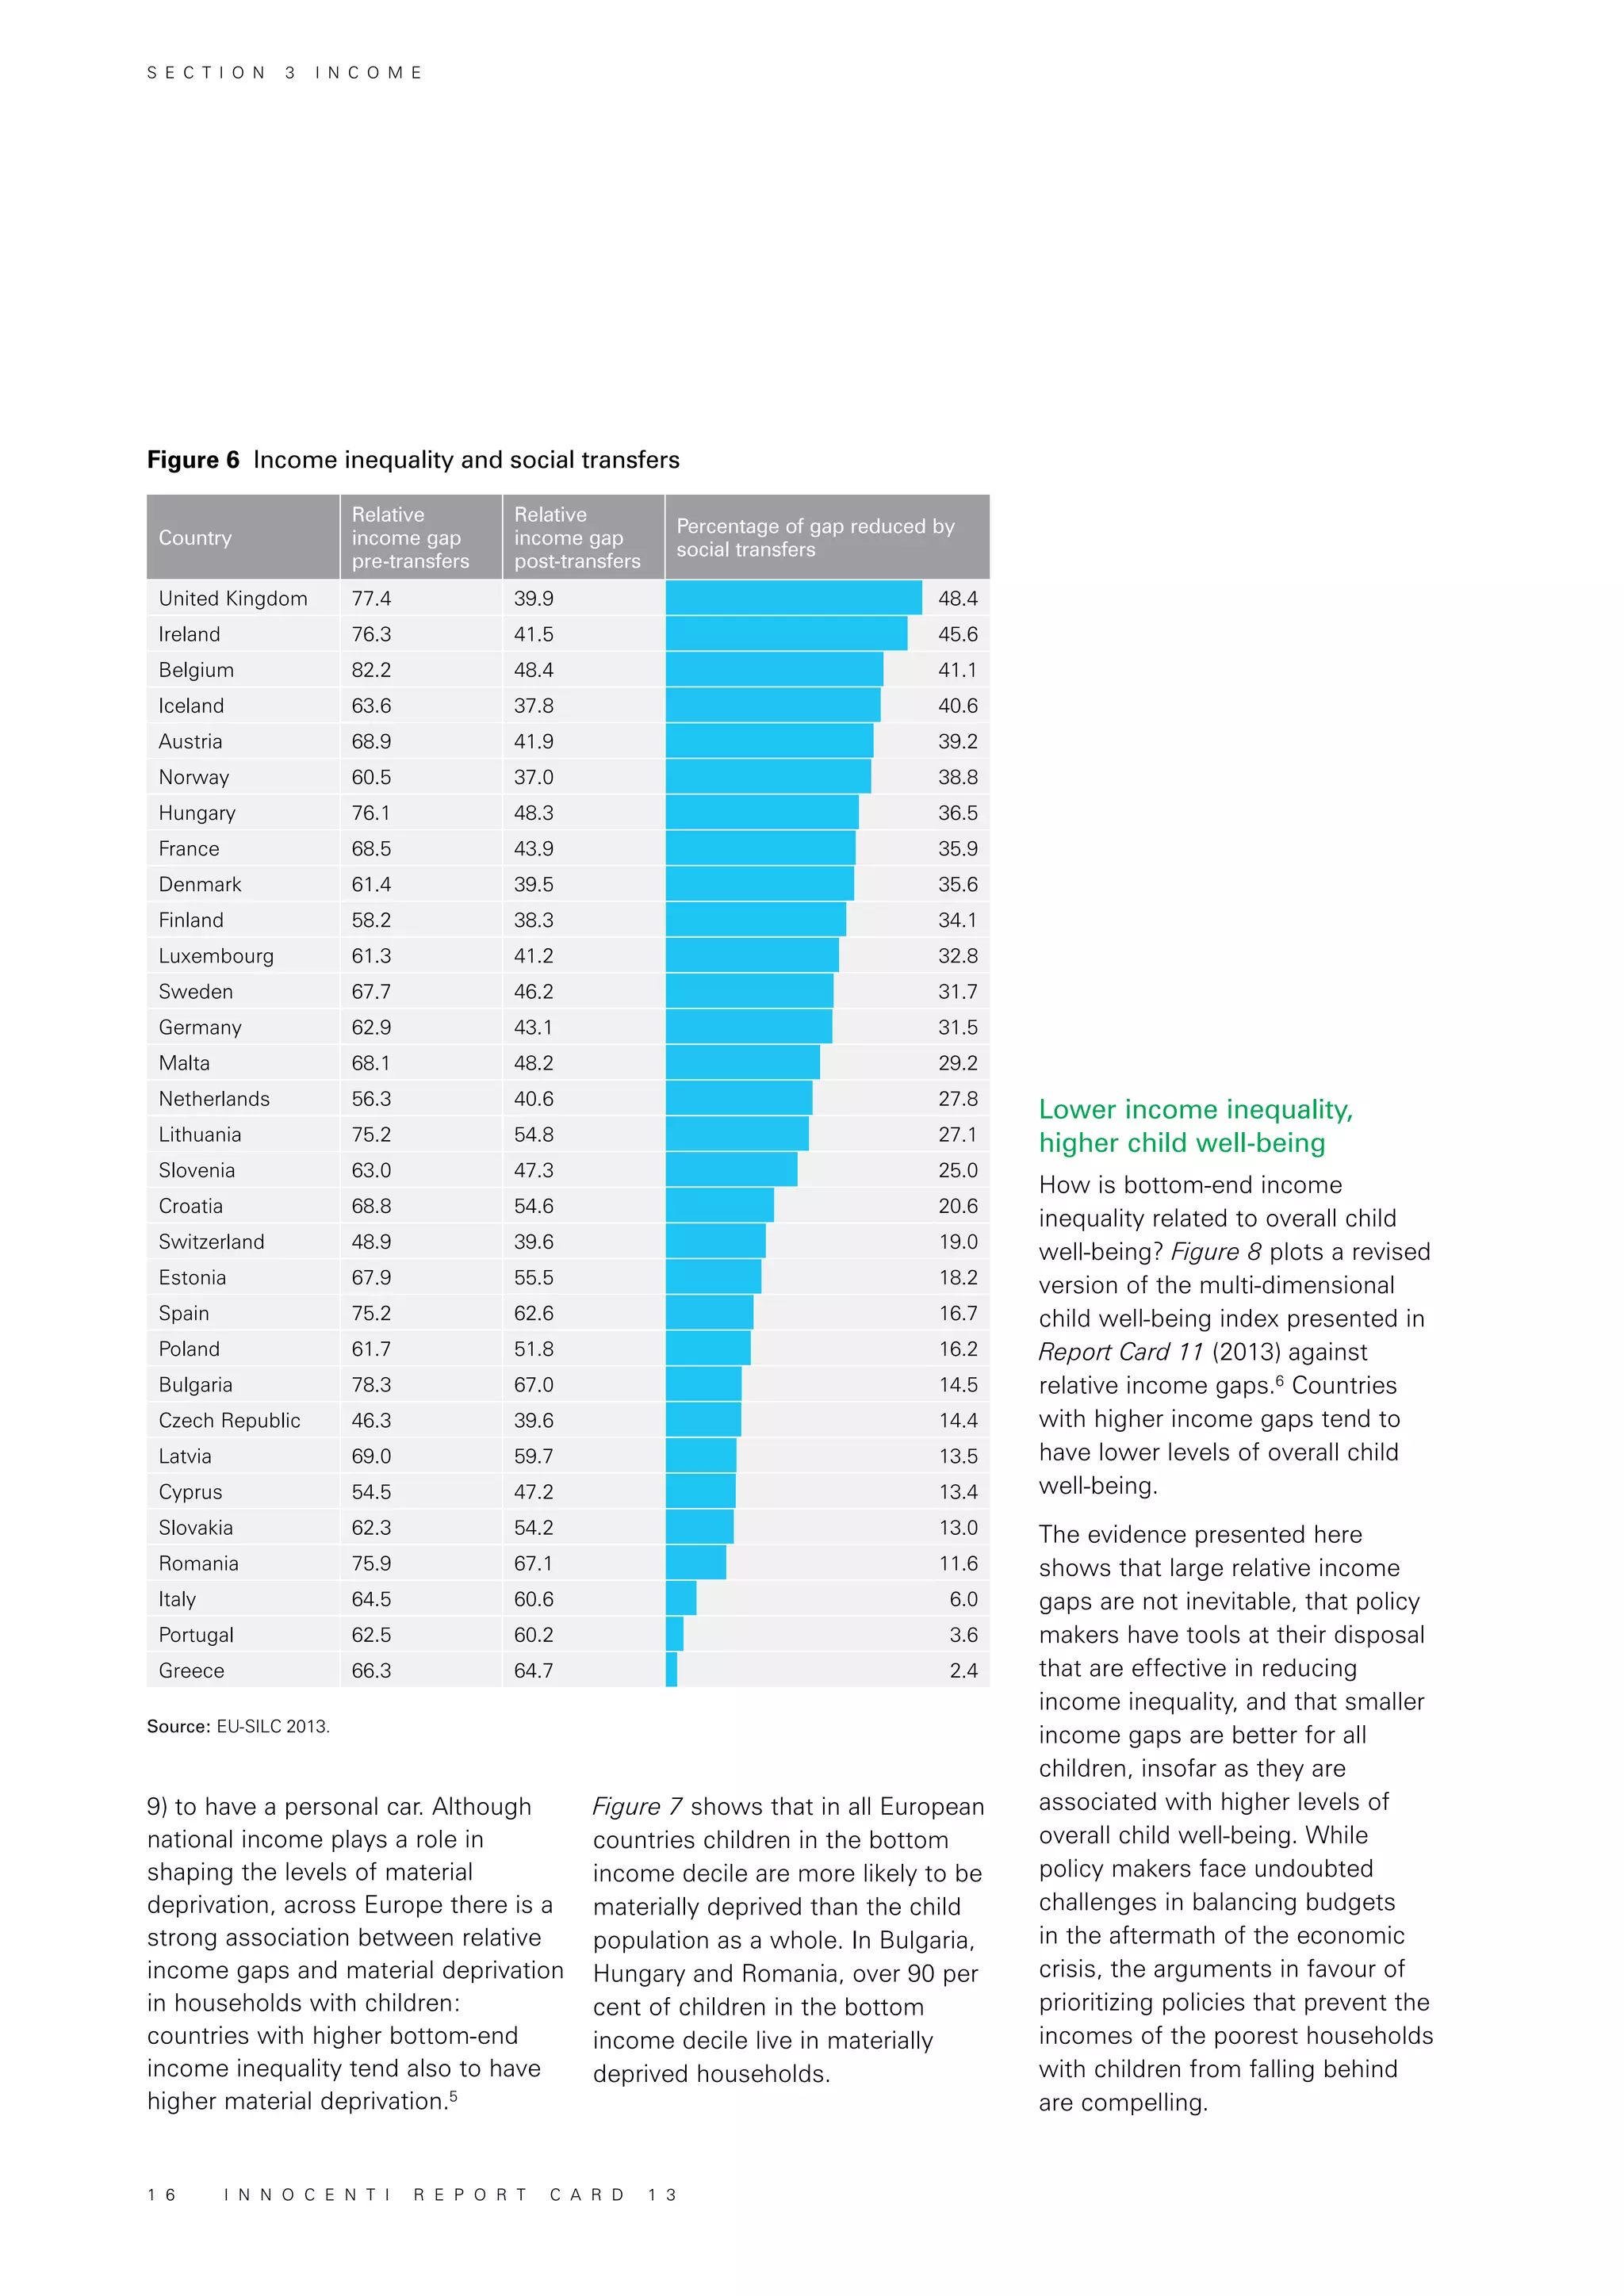
BE
LU
IL
FR
DE
CA
IT
SK
IS
SE
UKUS
ESLT
HR
HU
PT
MT
BG
SI
FI
IE
EE
AT
LV
CH
NO
RO
DK
GR
AU
NL
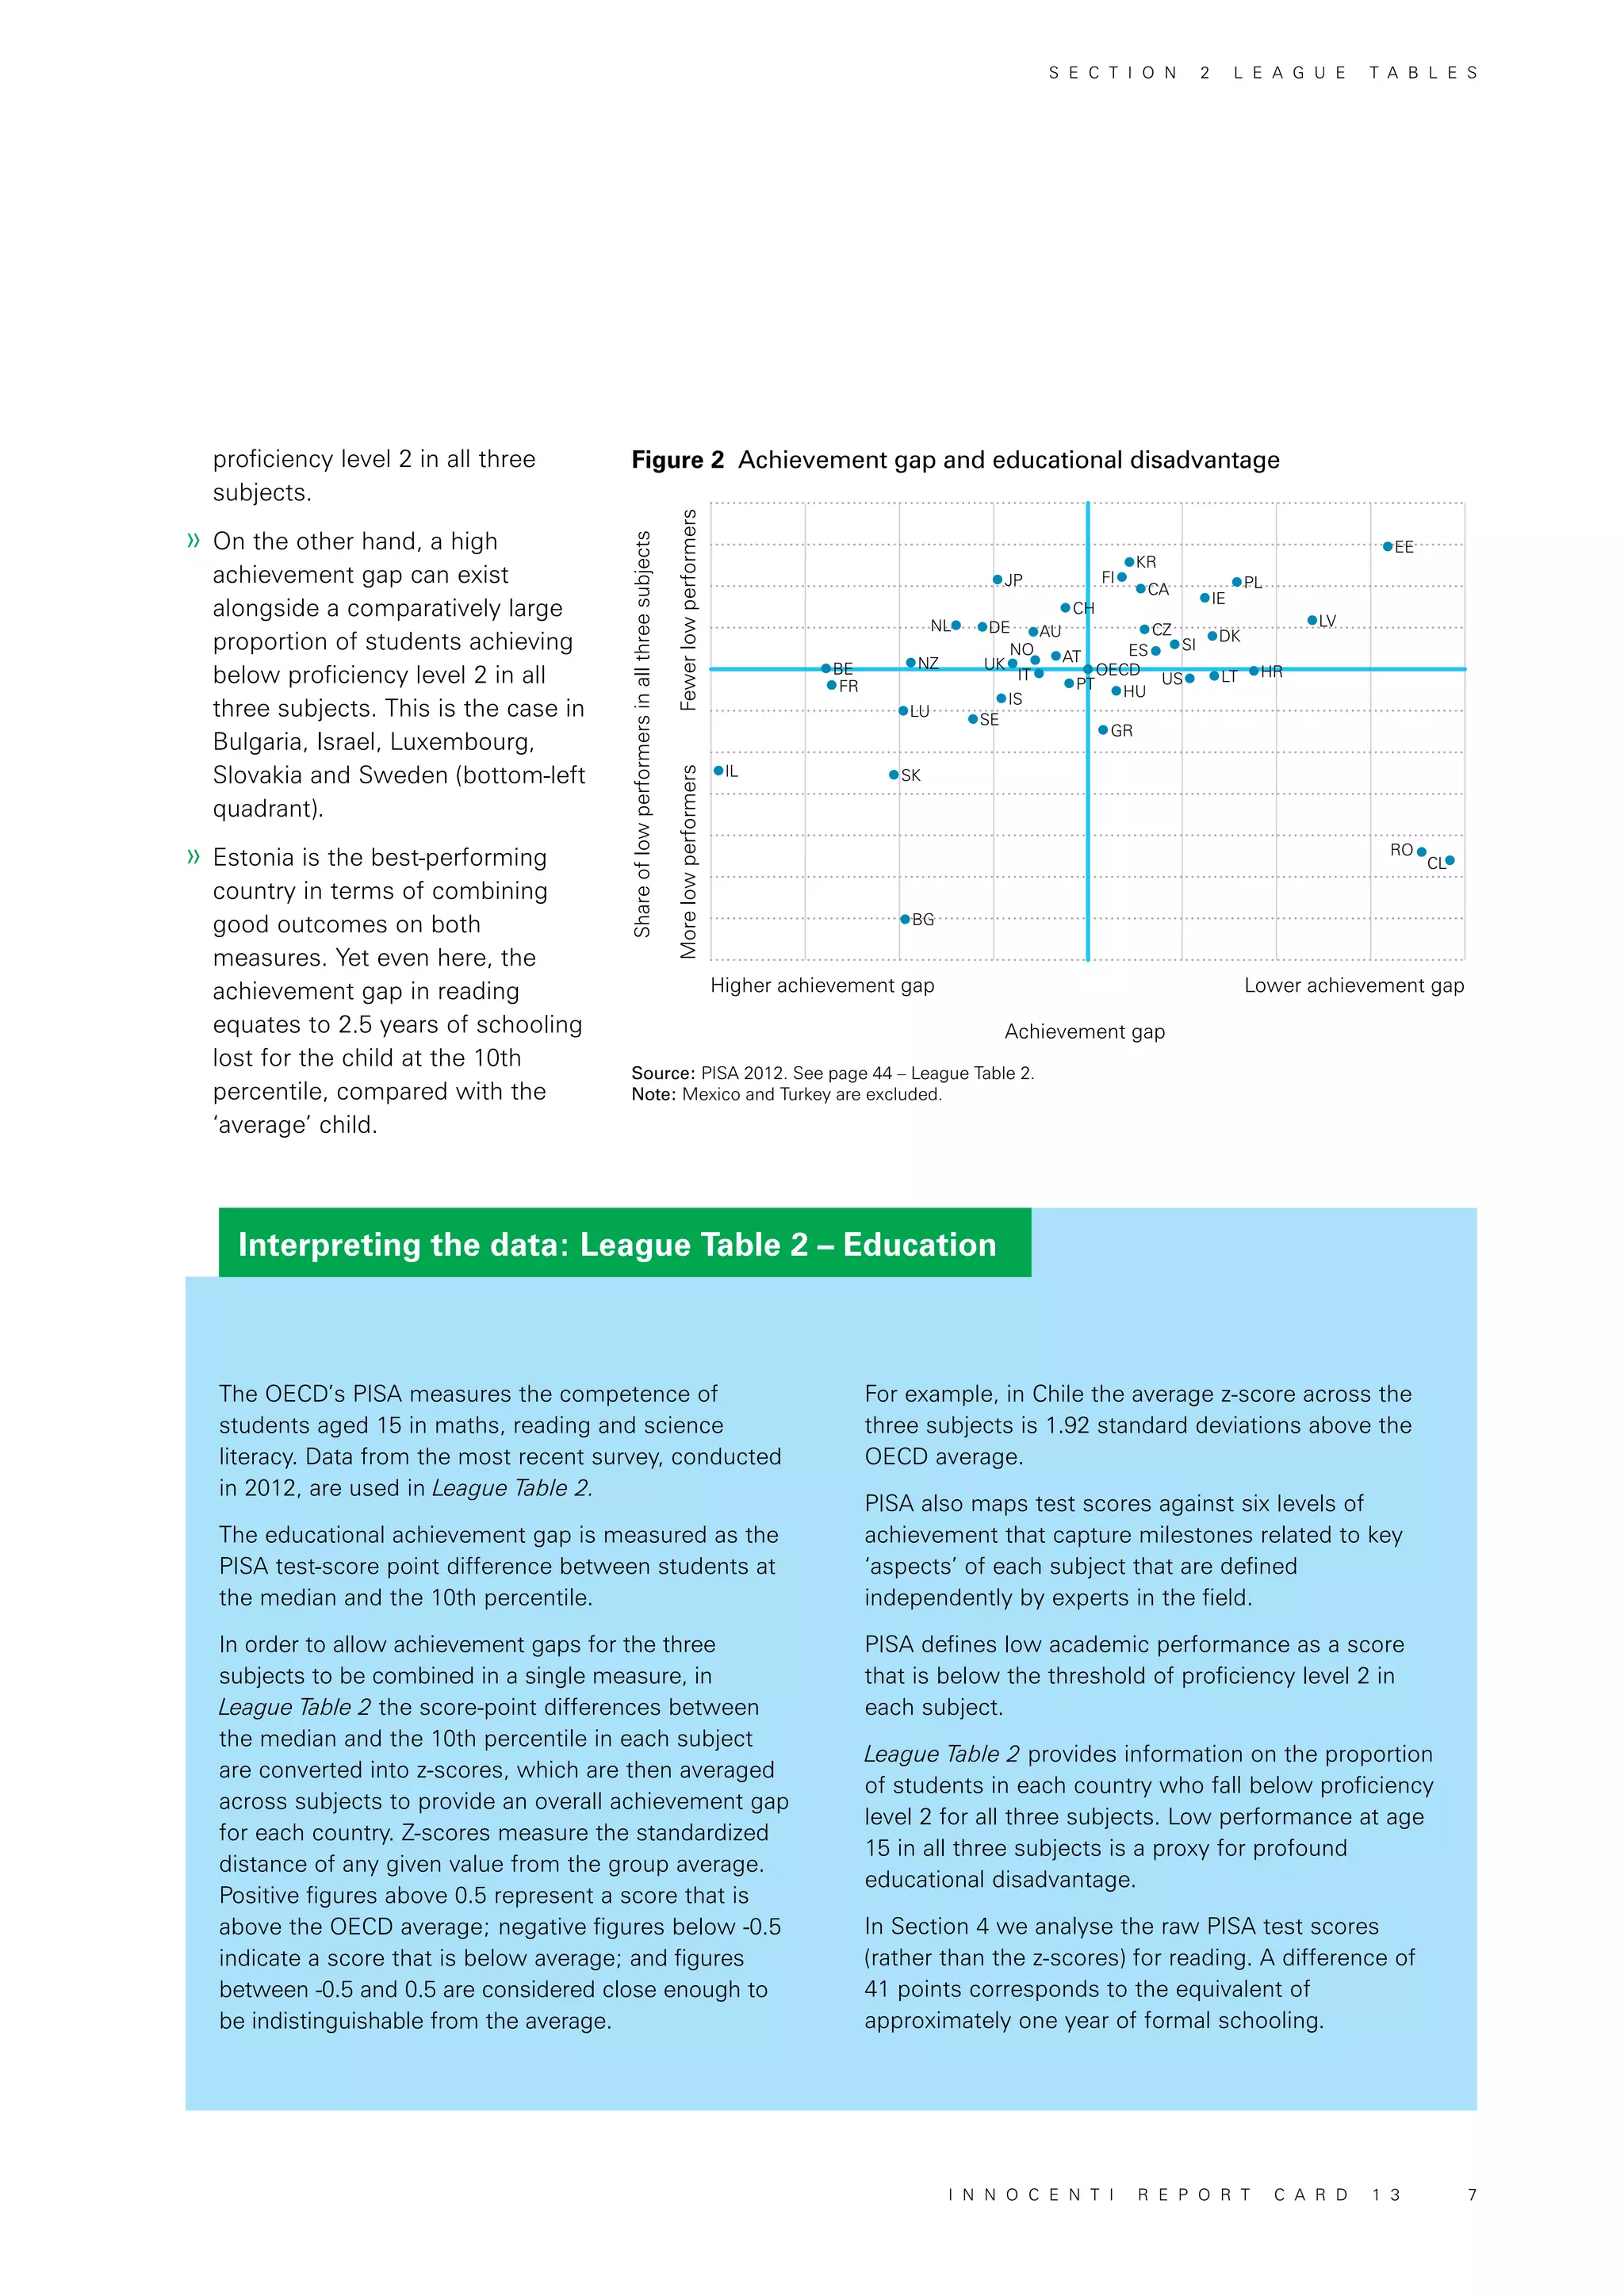
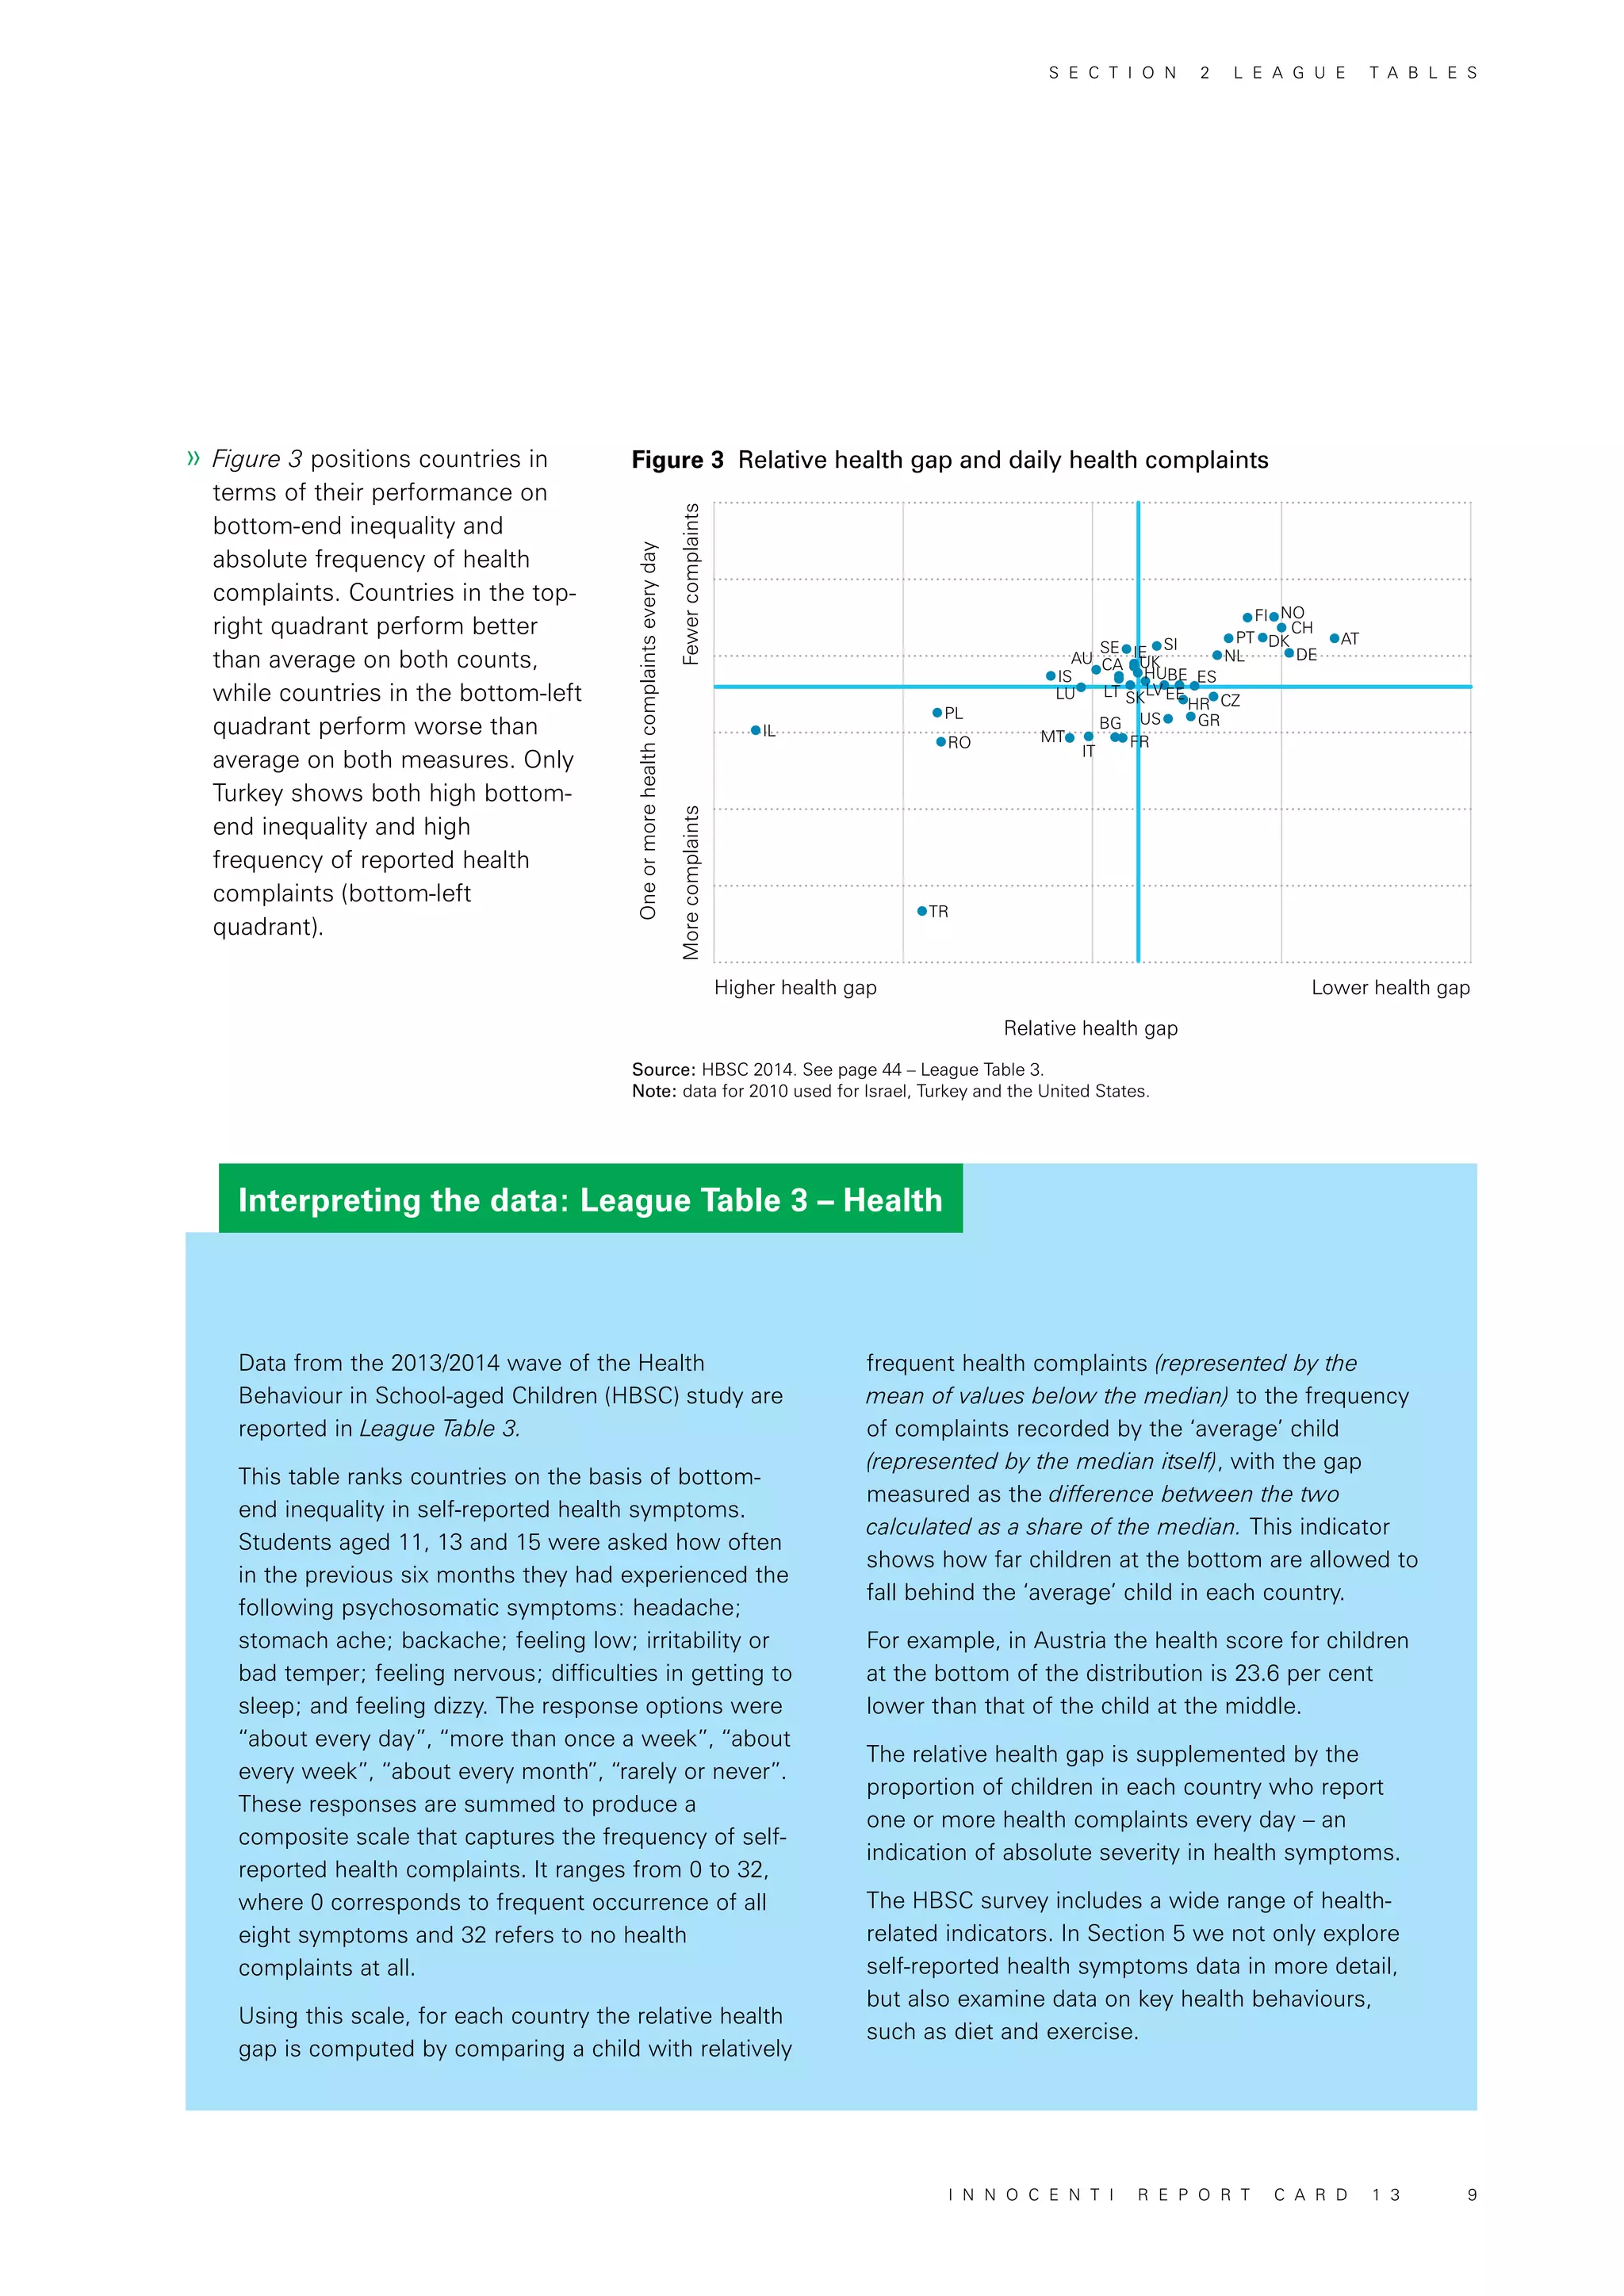
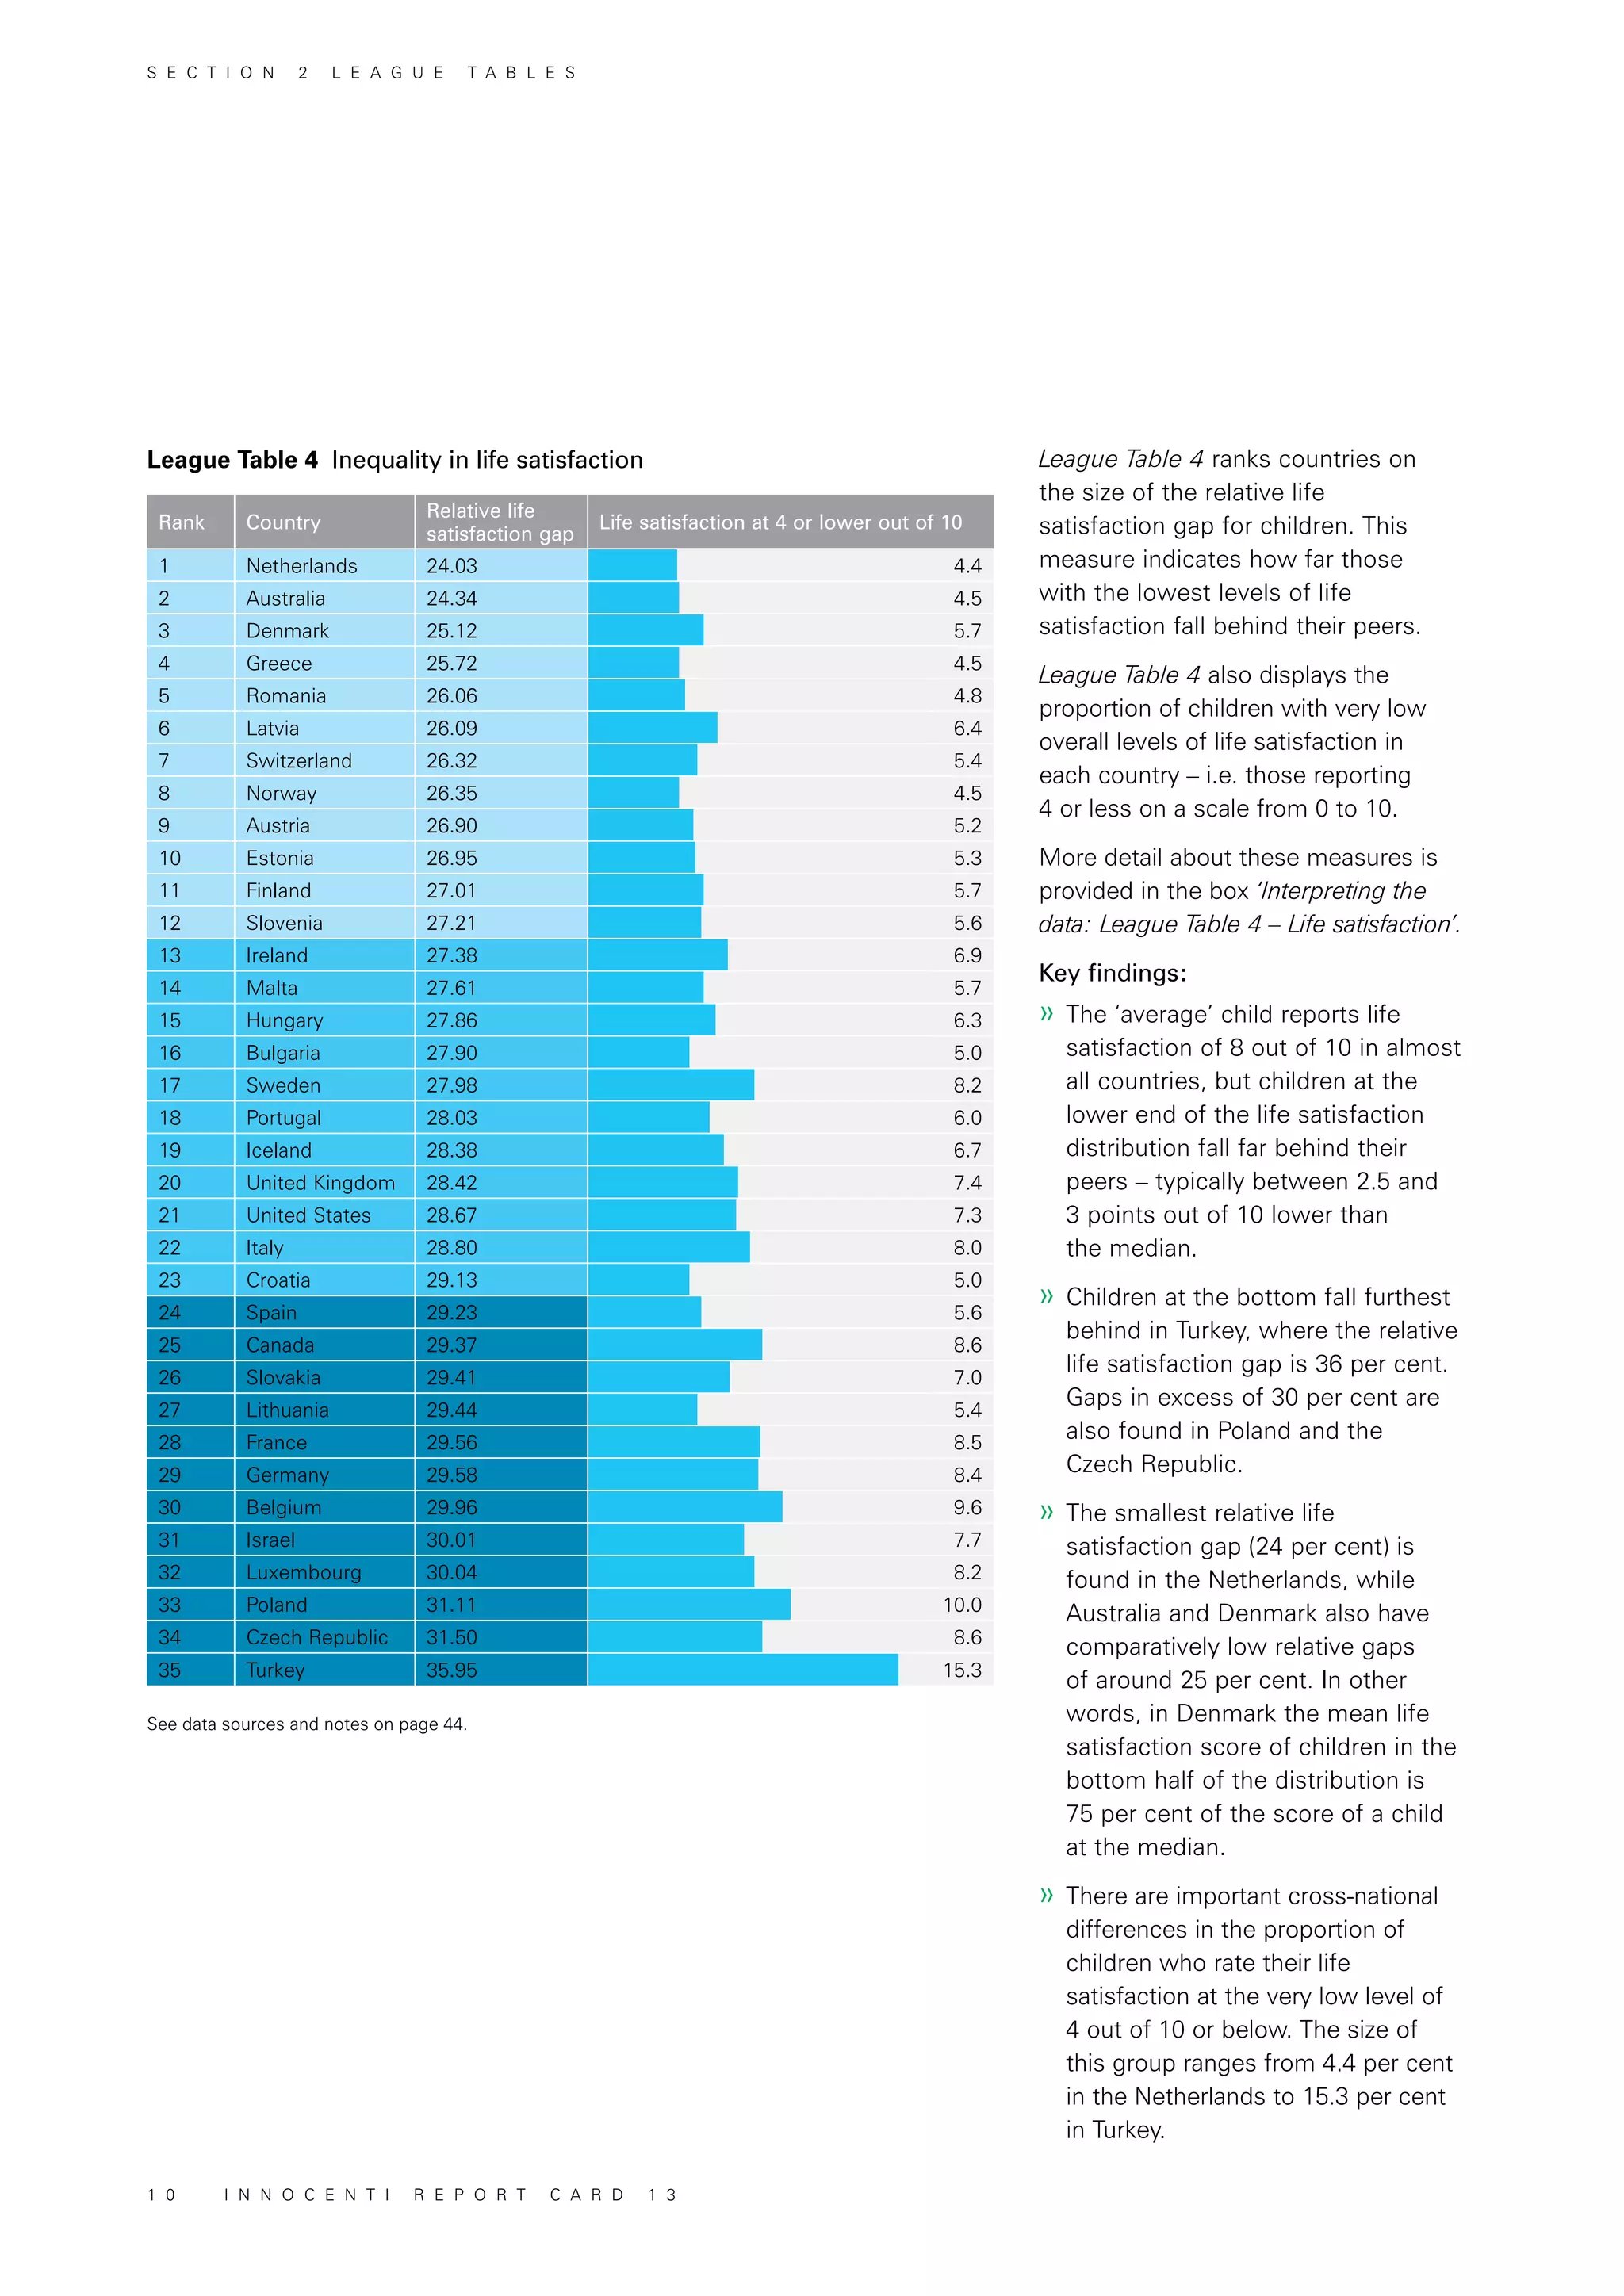
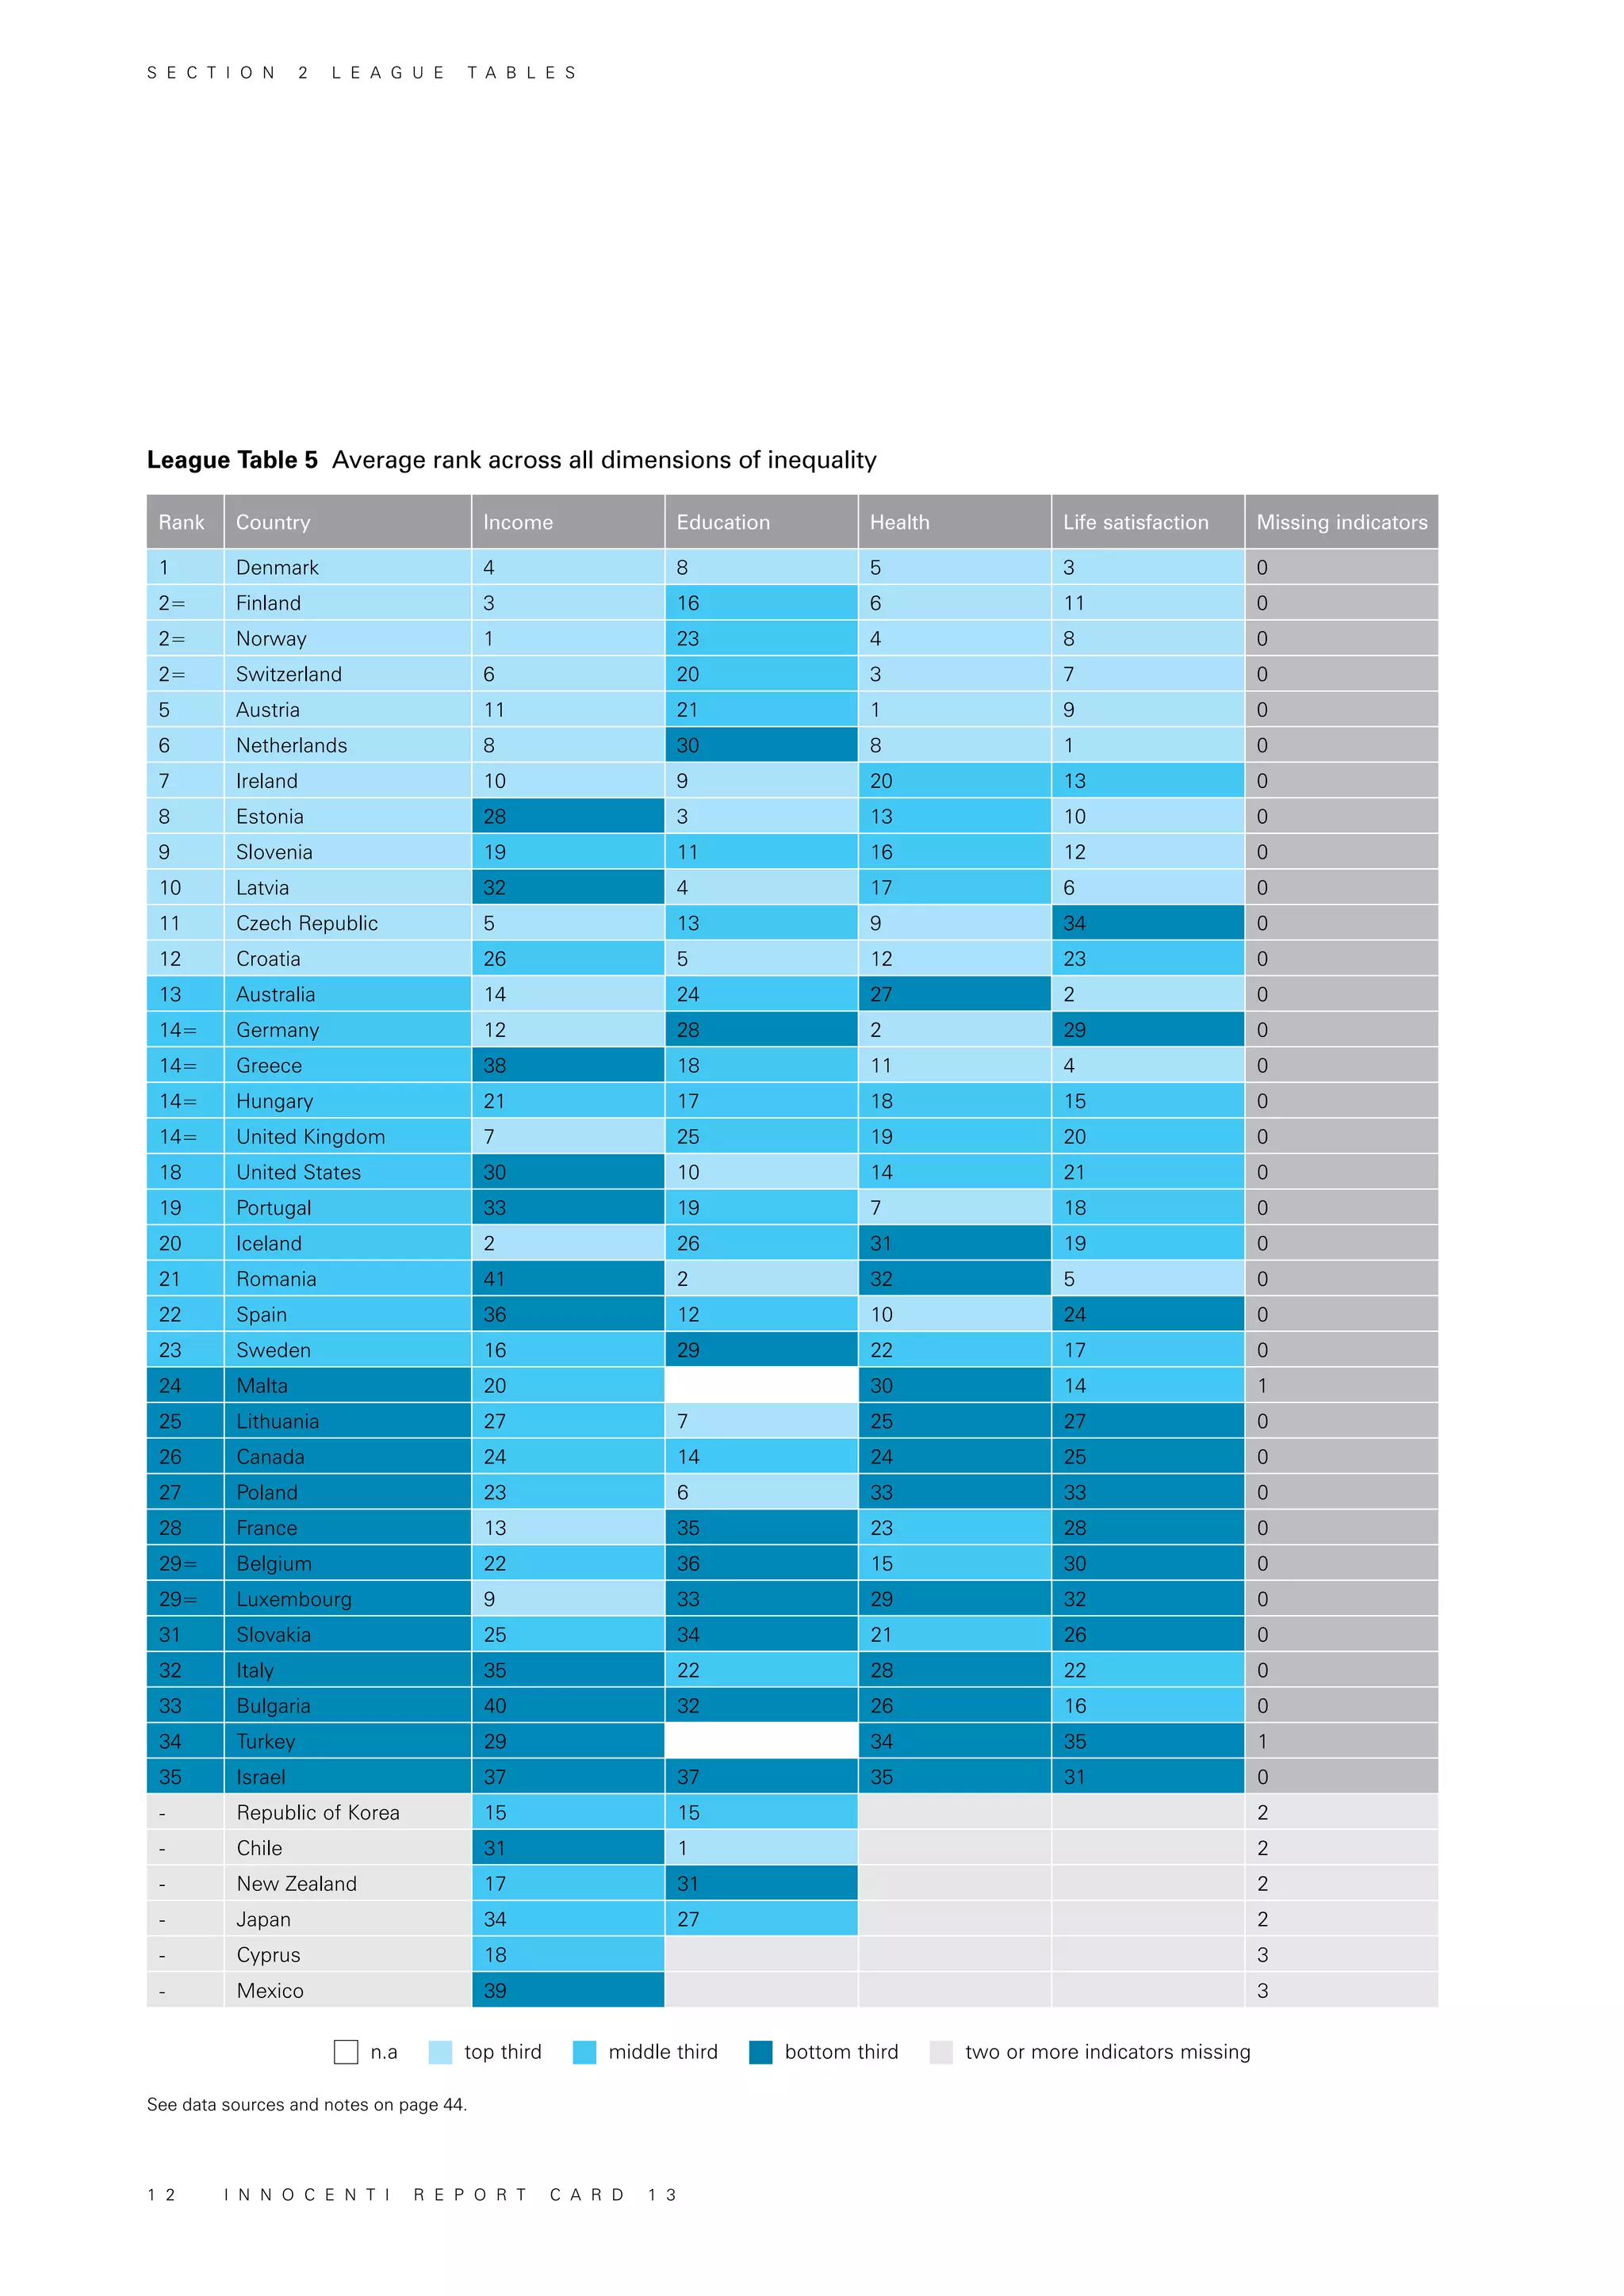
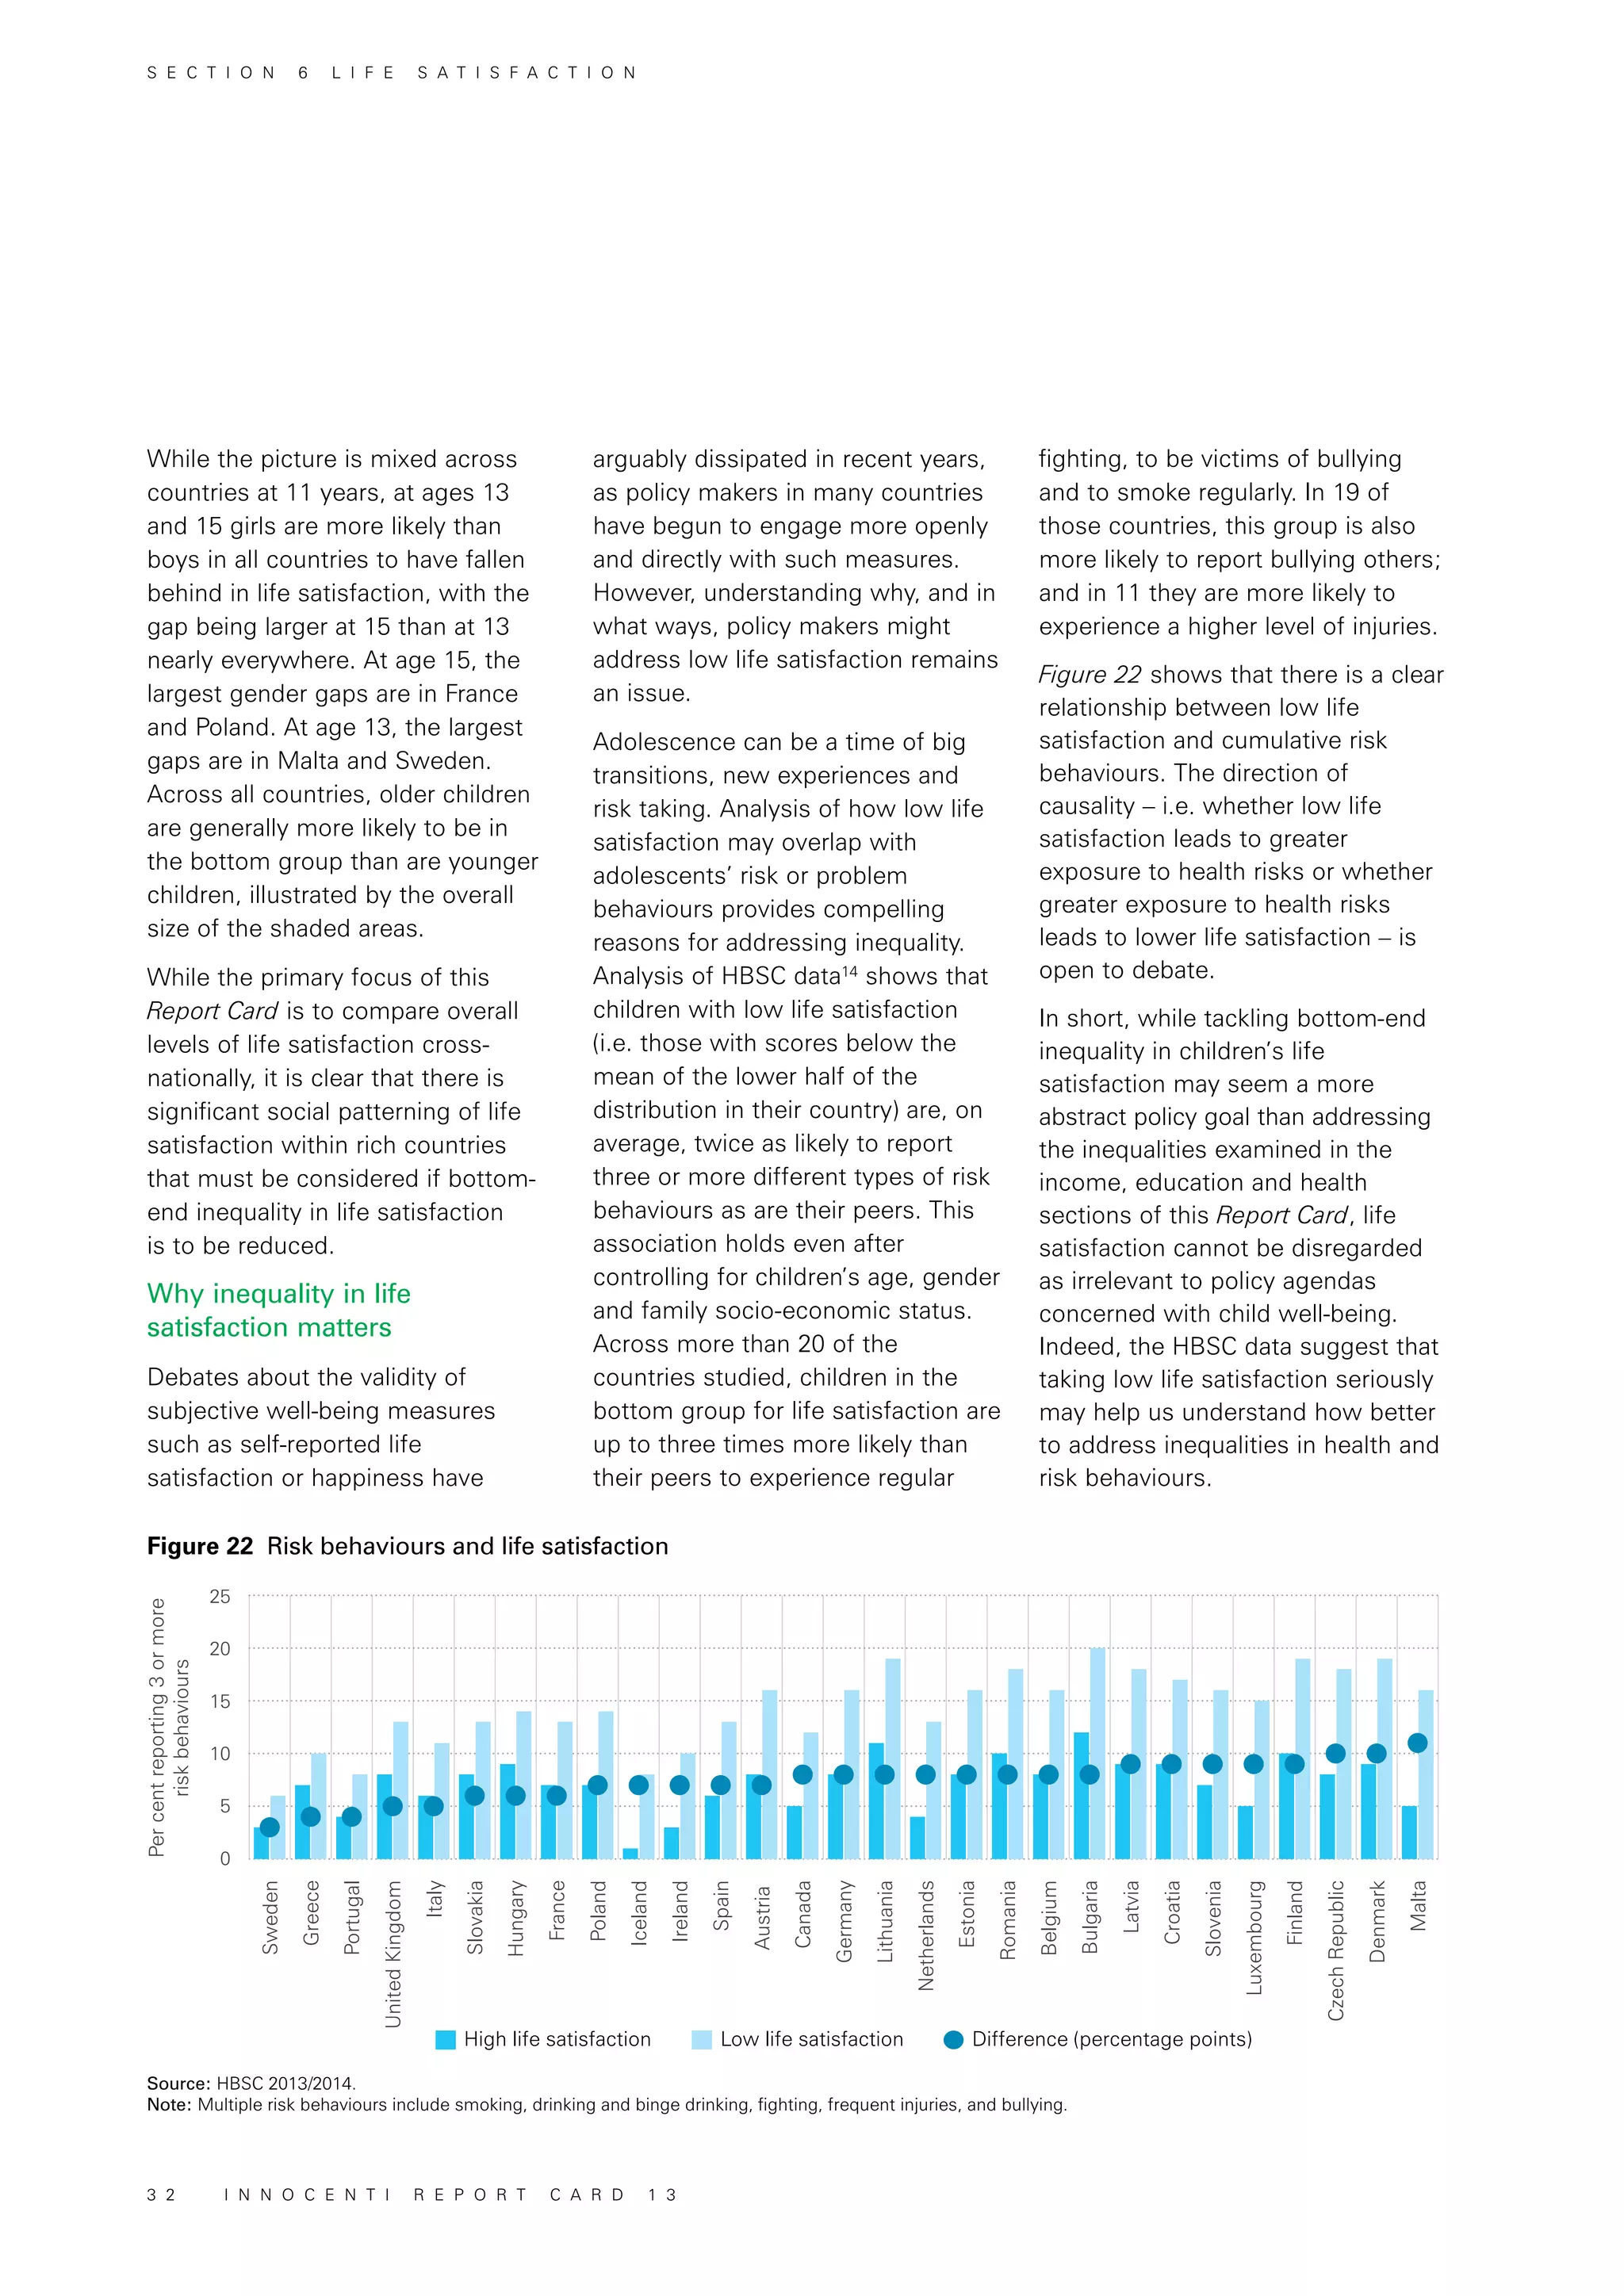
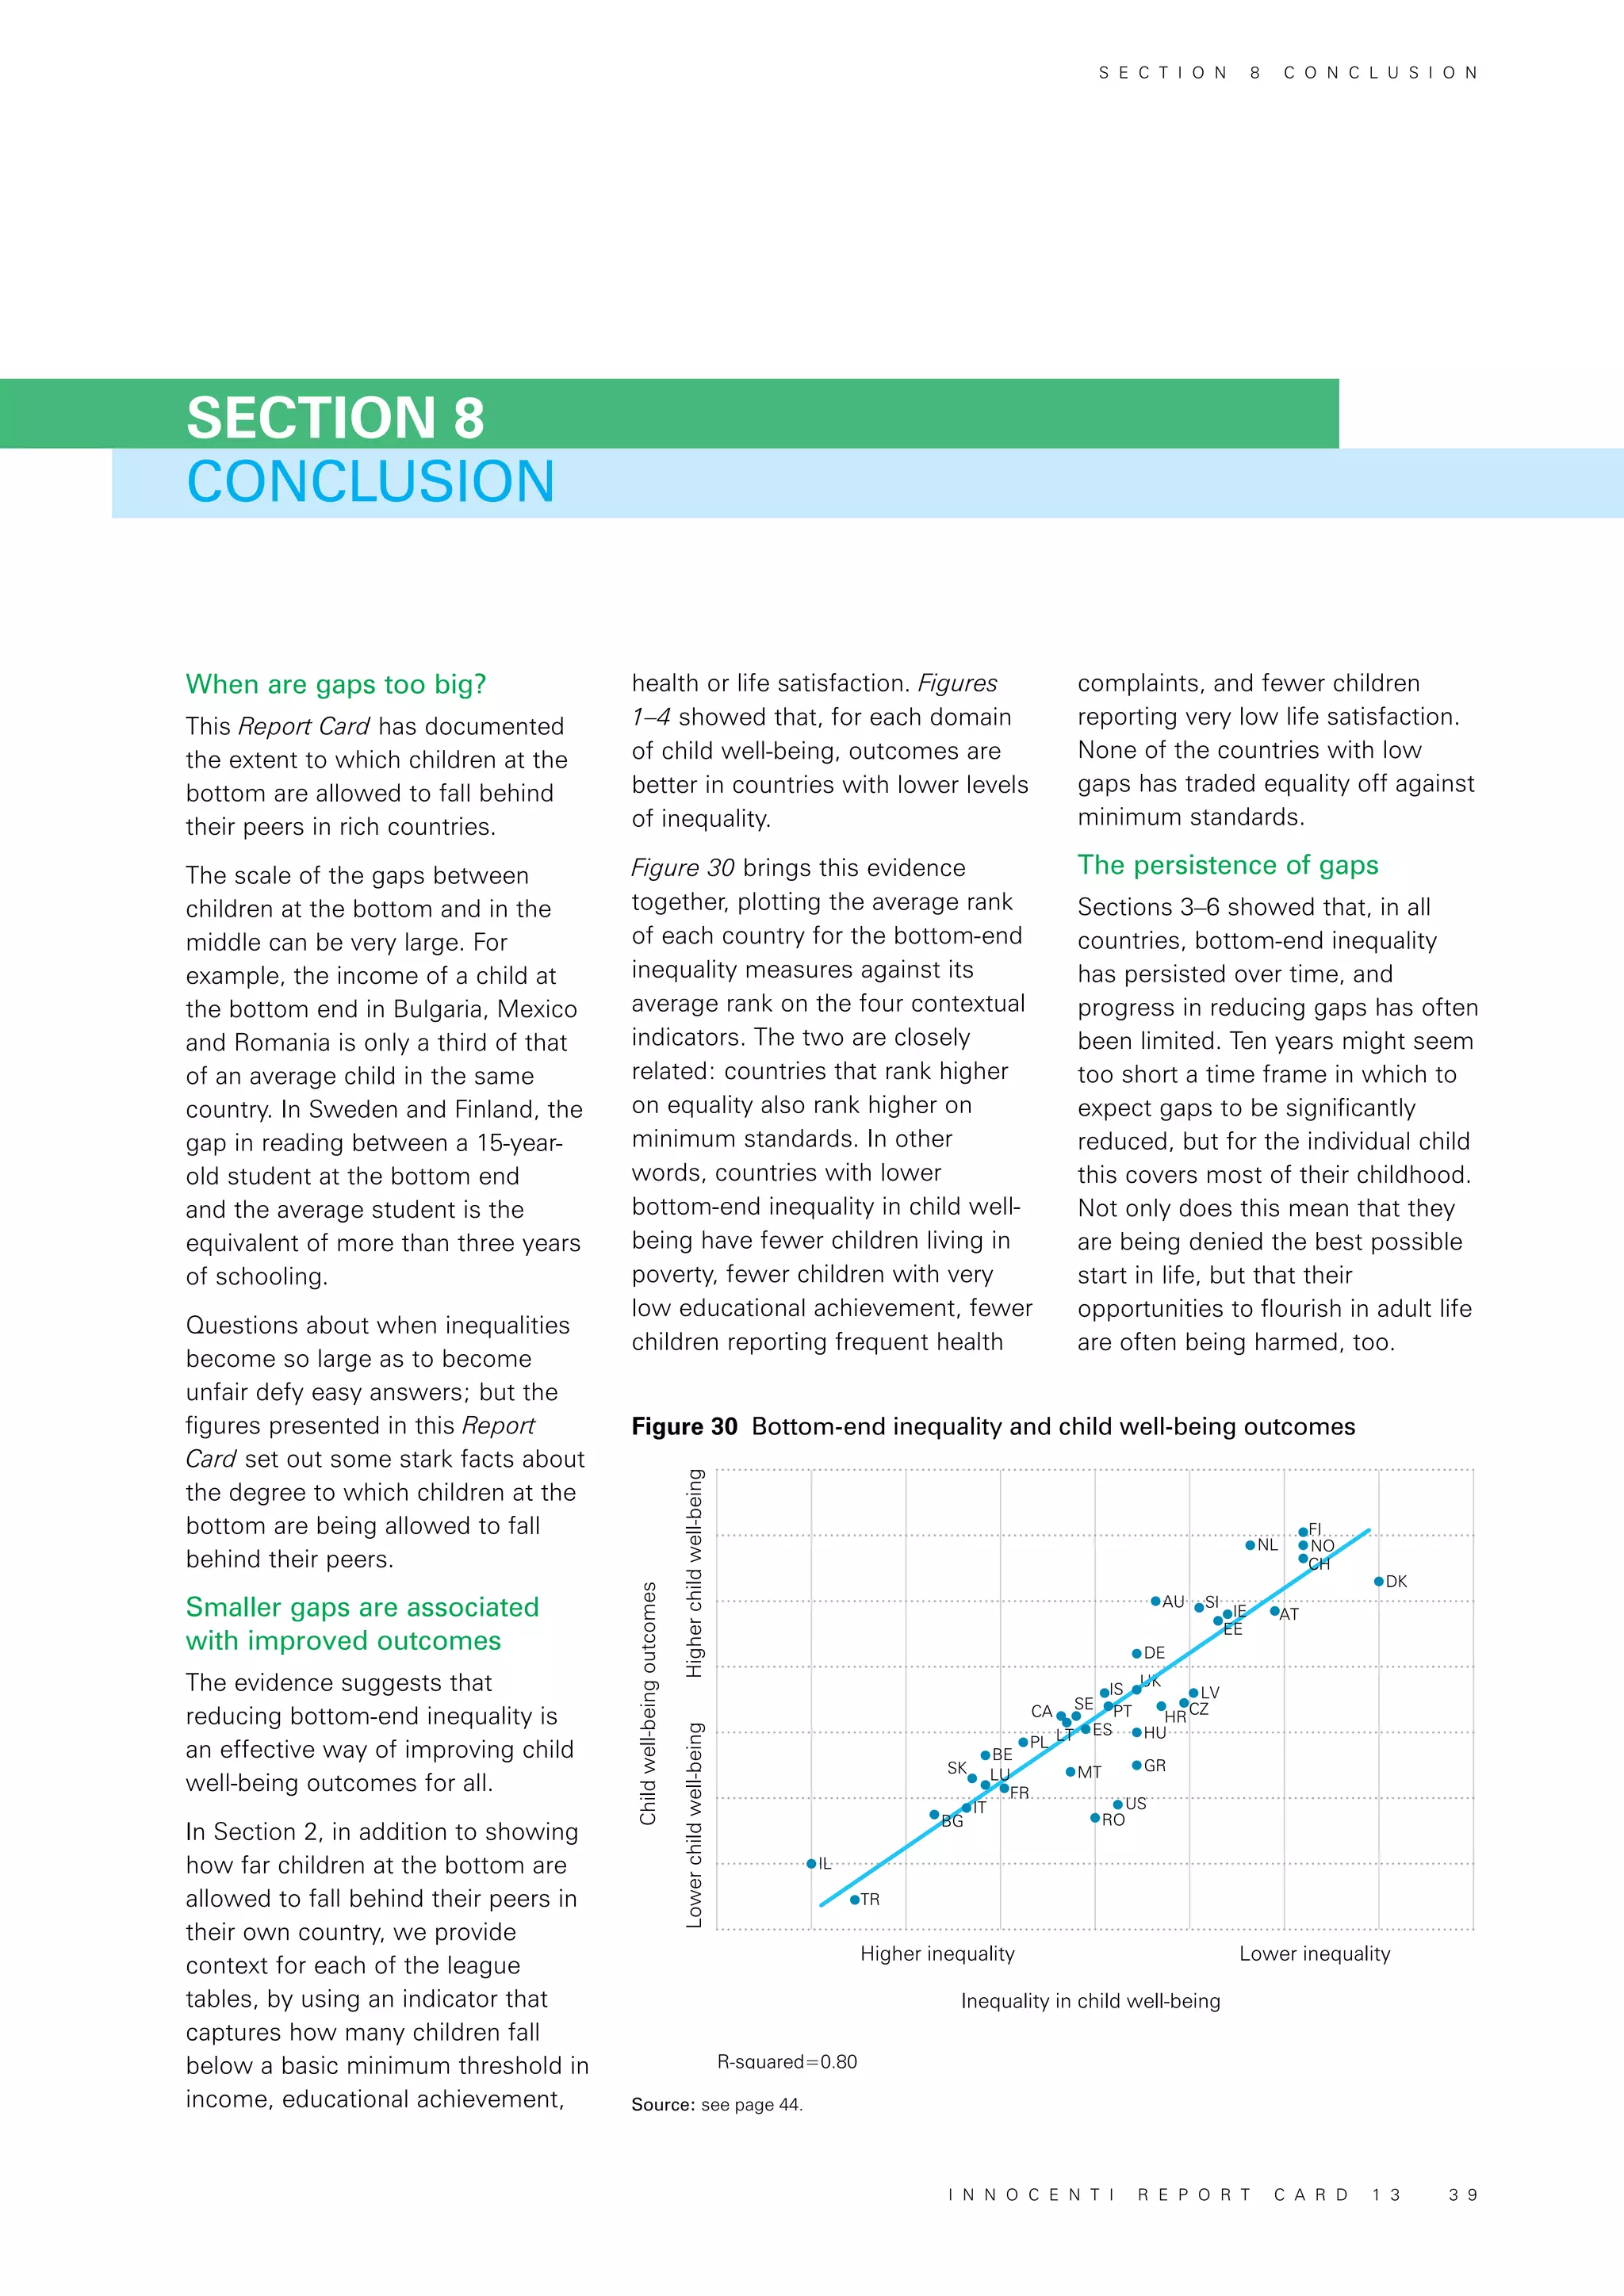
»» Figure 4 places countries in one
of four quadrants where, as
before, those in the top-right
quadrant perform better than
average both in bottom-end
inequality and in the proportion
of children reporting very low life
satisfaction. For life satisfaction,
the relationship between the two
is quite strong, as most countries
are either in the top-right or the
bottom-left quadrants. Countries
with lower bottom-end inequality
also tend to have a lower share
of children who rate their life
satisfaction at 4 out of 10 or
below, and vice versa – a larger
proportion of those in countries
with higher bottom-end
inequality assign life satisfaction
a low score.
Data from the 2013/2014 [see page 44] wave of the
Health Behaviour in School-aged Children (HBSC)
study are reported in League Table 4.
The life satisfaction scores are based on children’s
own ratings of their life satisfaction on a scale of 0
(“the worst possible life for you”) to 10 (“the best
possible life for you”).
For each country, the relative life satisfaction gap is
the difference between mean life satisfaction of a
child with relatively low life satisfaction (represented
by the mean of values below the median) and the
life satisfaction of the ‘average’ child (represented by
the median itself), with the gap measured as the
Figure 4 Relative life satisfaction gap and low life satisfaction
Source: HBSC 2014. See page 44 – League Table 4.
Note: data for 2010 used for Israel, Turkey and the United States.
difference between the two calculated as a share of
the median. This indicates how far those with
relatively low levels of life satisfaction have fallen
behind their peers.
For example, in the Netherlands the life satisfaction
score for children at the bottom is 24 per cent lower
than that for children in the middle.
League Table 4 also reports the proportion of
children in each country rating their life satisfaction
at 4 out of 10 or below. This allows us to assess the
prevalence of very low levels of life satisfaction in
each country.
S E C T I O N 2 L E A G U E T A B L E S
I N N O C E N T I R E P O R T C A R D 1 3 1 1](https://image.slidesharecdn.com/oct23-ccyhcsymposium-morley-1stlink-170116203346/75/Oct-23-CCYHC-Symposium-UNICEF-document-1-13-2048.jpg)


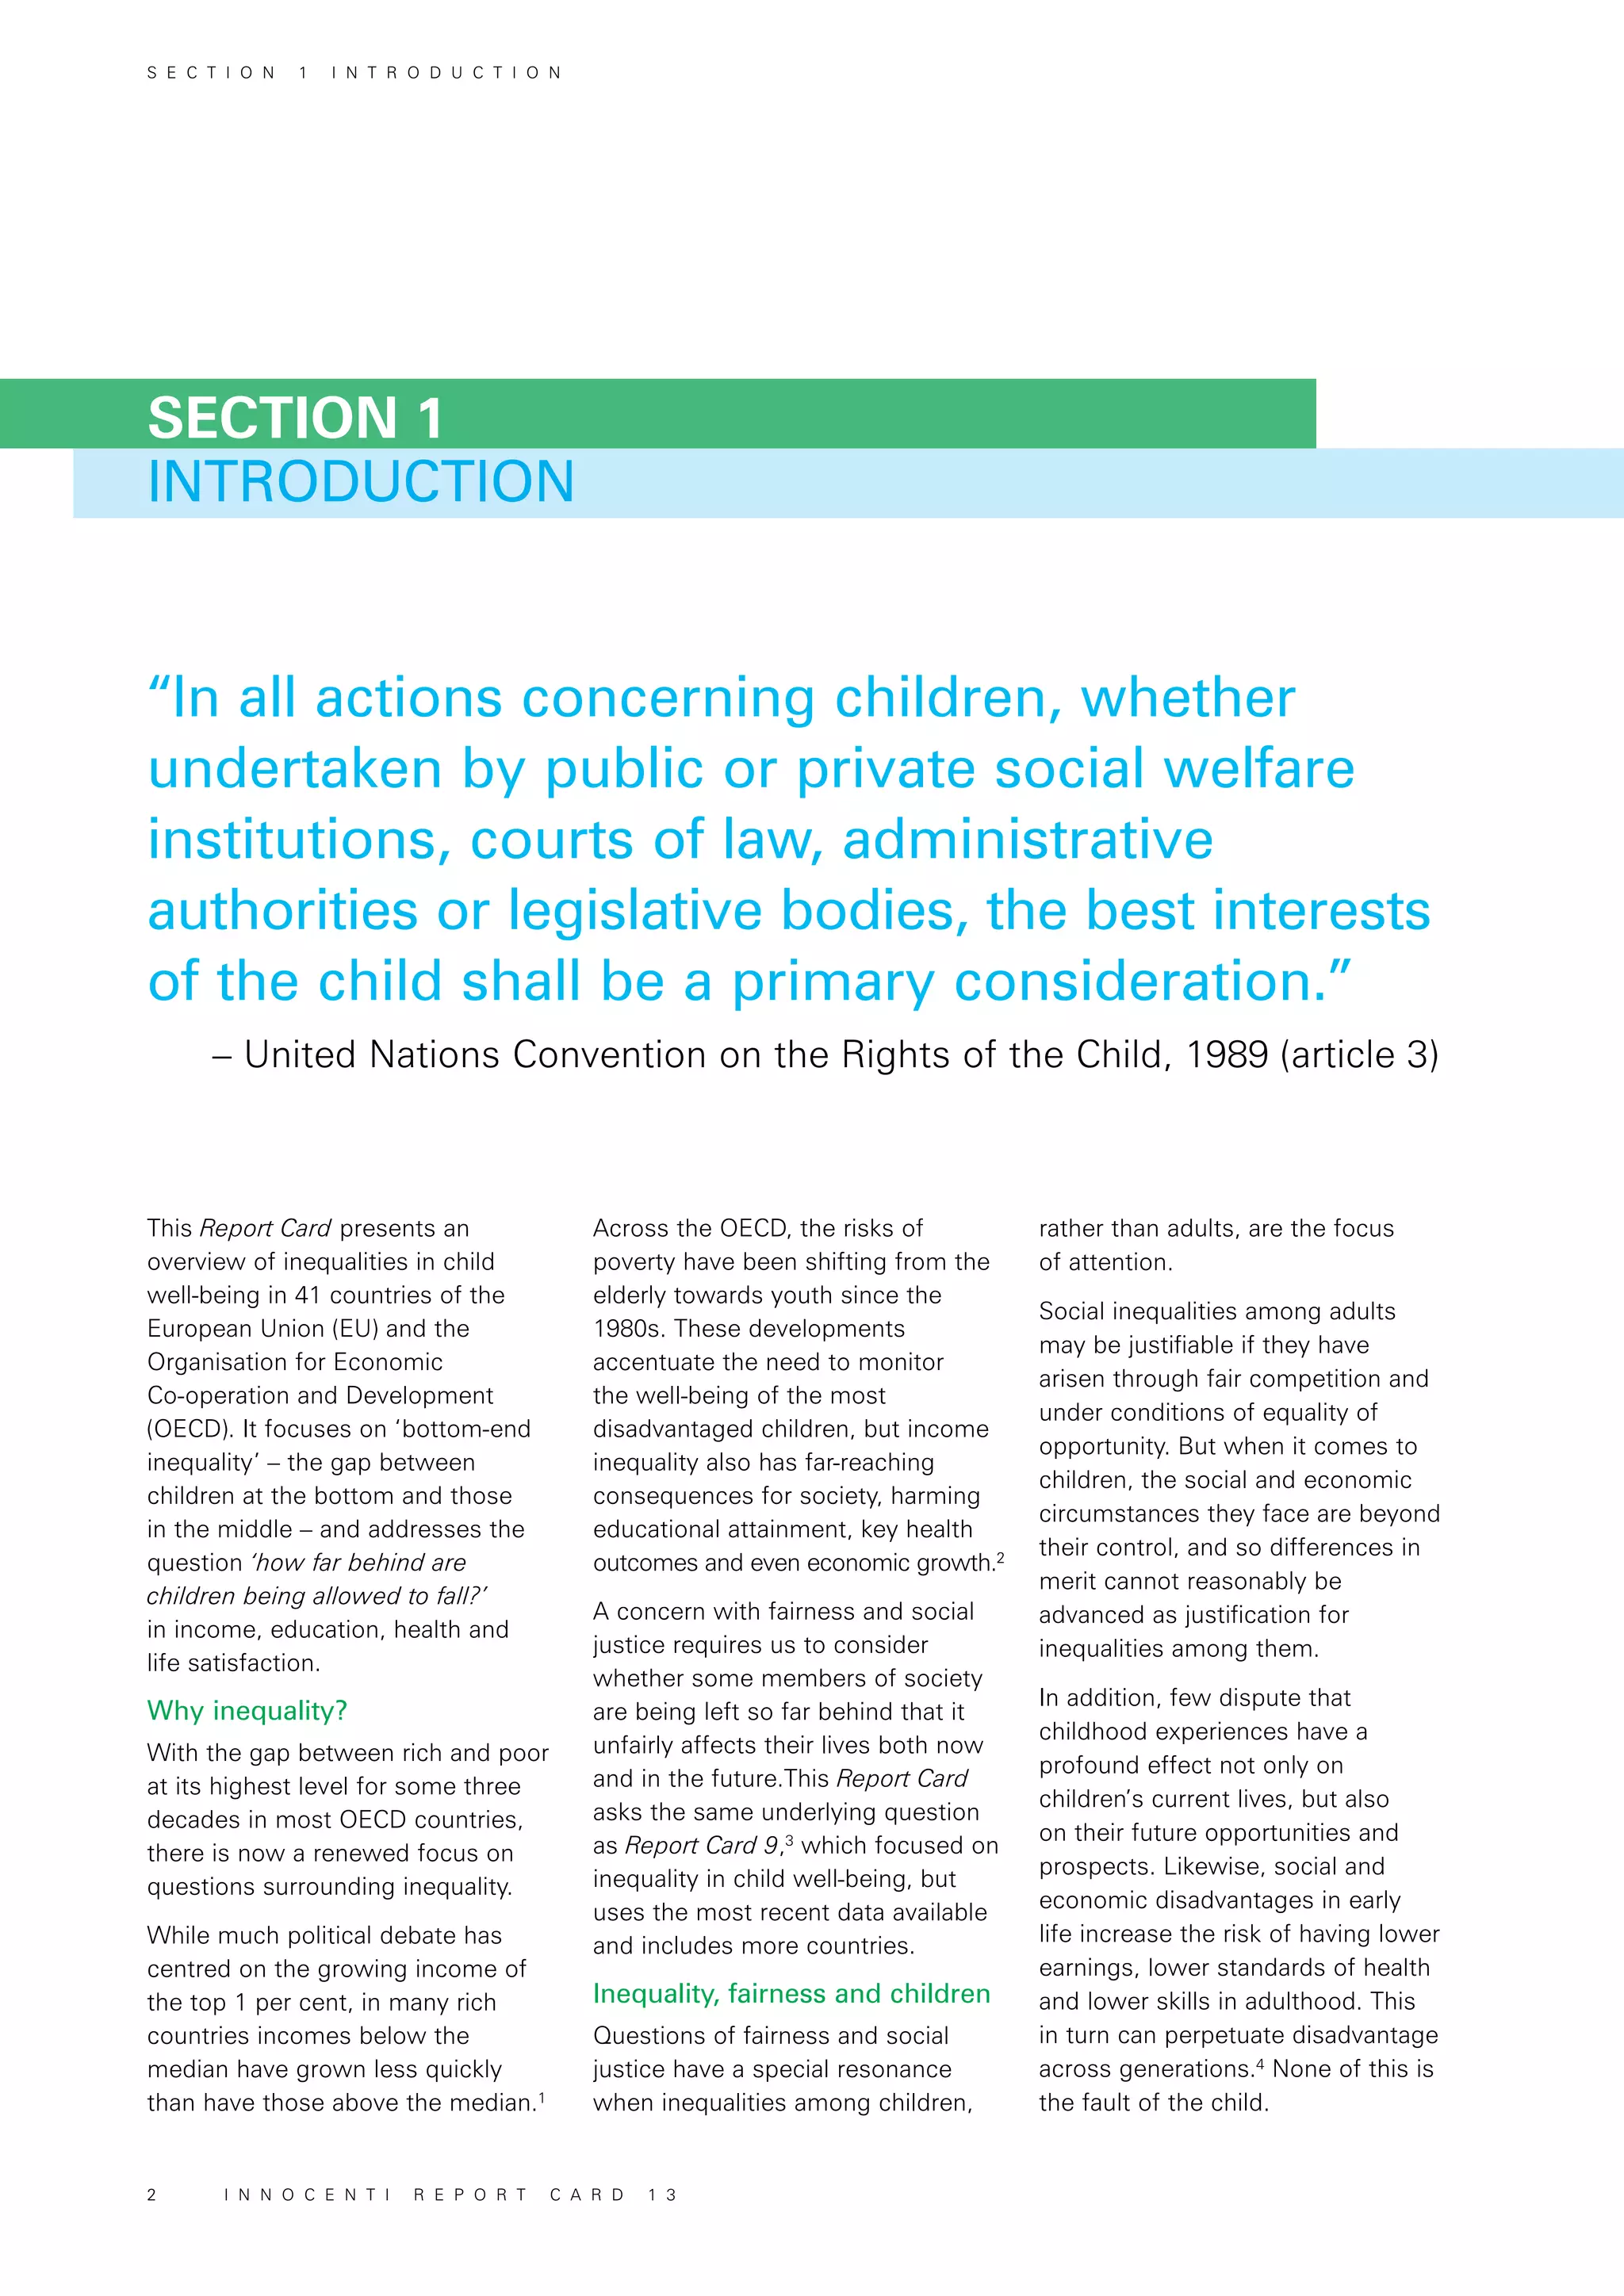
This document is a report by UNICEF that examines inequality in child well-being among developed nations. It provides league tables that rank 41 European and OECD countries based on measures of inequality affecting children's income, education, health, and life satisfaction. The report aims to evaluate how far behind the most disadvantaged children are allowed to fall in different countries and analyze the impacts of inequality on children's current and future well-being.


