Measuring Children's Well-Being in Europe

In this Position Paper, Rivera and Santos analyze some socio-economic and psychological indicators on Children's well-being in Europe. They consider that well-being is at the foremost position of national and international political agendas due to increased concerns of how to implement effective and sustainable policies, which implies evidence-based design and, in consequence, to properly measure societies’ progress and welfare. The OECD’s Better Life Initiative, presented in OECD (2011), identifies three pillars for understanding and measuring people’s well-being: 1) Material living conditions (or economic wellbeing), 2) Quality of life, and 3) the Sustainability of the socio-economic and natural systems. The authors highlight the relevance of including indicators such as social connections and civic engagement. Both are relevant for children, particularly from a human rights perspective that considers their participation and strong socio-cultural relations as relevant for a stable and consistent development. Rivera and Santos consider well-being a central topic for constructing children’s social policies, mainly for these reasons: 1) World leaders of 192 states have made commitments to children through the UN Convention on the Rights of the Child (UNCRC), and the Millennium Declaration. Investing in child-sensitive development is key to empowering children’s rights and reaching the Millennium Development Goals (MDGs). 2) Investing in children’s well-being also has significant potential payoffs for economic growth which, in turn, translates to greater productivity, sustainable growth and lower child and infant mortality. Thus, it is crucial in breaking the cycle of intergenerational poverty. 3) Finally, investing in children means that countries are at a better position to receive the crop that they have seed in the form of qualified and better adults who contribute to society and economy, and help build social cohesion.

Recommended
Recommended
More Related Content
What's hot
What's hot (20)
Viewers also liked
Viewers also liked (16)
Similar to Measuring Children's Well-Being in Europe
Similar to Measuring Children's Well-Being in Europe (20)
More from InterMedia Consulting
More from InterMedia Consulting (20)
Recently uploaded
Recently uploaded (15)
Measuring Children's Well-Being in Europe
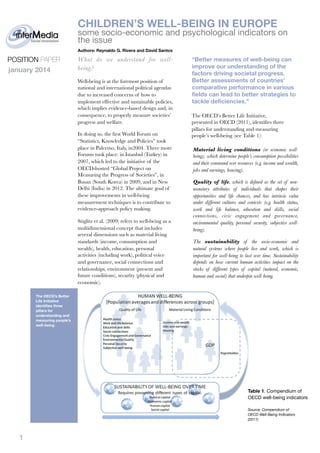
- 1. CHILDREN’S WELL-BEING IN EUROPE some socio-economic and psychological indicators on the issue Authors: Reynaldo G. Rivera and David Santos POSITION PAPER january 2014 What do we understand for wellbeing? Well-being is at the foremost position of national and international political agendas due to increased concerns of how to implement effective and sustainable policies, which implies evidence-based design and, in consequence, to properly measure societies’ progress and welfare. In doing so, the first World Forum on “Statistics, Knowledge and Policies” took place in Palermo, Italy, in2004. Three more Forums took place: in Istanbul (Turkey) in 2007, which led to the initiative of the OECD-hosted “Global Project on Measuring the Progress of Societies”, in Busan (South Korea) in 2009, and in New Delhi (India) in 2012. The ultimate goal of these improvements in well-being measurement techniques is to contribute to evidence-approach policy making. Stiglitz et al. (2009) refers to well-being as a multidimensional concept that includes several dimensions such as material living standards (income, consumption and wealth), health, education, personal activities (including work), political voice and governance, social connections and relationships, environment (present and future conditions), security (physical and economic). “Better measures of well-being can improve our understanding of the factors driving societal progress. Better assessments of countries’ comparative performance in various fields can lead to better strategies to tackle deficiencies.” The OECD’s Better Life Initiative, presented in OECD (2011), identifies three pillars for understanding and measuring people’s well-being (see Table 1): Material living conditions (or economic wellbeing), which determine people’s consumption possibilities and their command over resources (e.g. income and wealth, jobs and earnings, housing). Quality of life, which is defined as the set of nonmonetary attributes of individuals that shapes their opportunities and life chances, and has intrinsic value under different cultures and contexts (e.g. health status, work and life balance, education and skills, social connections, civic engagement and gover nance, environmental quality, personal security, subjective wellbeing). The sustainability of the socio-economic and natural systems where people live and work, which is important for well-being to last over time. Sustainability depends on how current human activities impact on the stocks of different types of capital (natural, economic, human and social) that underpin well-being. The OECD’s Better Life Initiative identifies three pillars for understanding and measuring people’s well-being Table 1. Compendium of OECD well-being indicators Source: Compendium of OECD Well-Being Indicators (2011) 1
- 2. POSITIONPAPER january 2014 We would like to highlight the relevance of including indicators such as social connections and civic engagement. Both are relevant for children, particularly from a human rights perspective that considers their participation and strong socio-cultural relations as relevant for a stable and consistent development. There are strong similarities between the definition of wellbeing given by Stiglitz et al. (2009) and the one proposed by the OECD and previous work (Hall et al., 2010). These definitions have been given considering both children and adults. However, we aim to focus on children’s wellbeing. In following that purpose, we would highlight the importance of adding to that list, as Stiglitz et al. (2009) outlined, the context of socialization in which children grow up (e.g. family as the first socializing agent and its structure, and peers), the socio-cultural context (norms, belief systems, customs, traditions and freedom of thinking and action) and the institutional development (accessibility to services, transparency and corruption, government stability, press and association freedom). Another important indicator that has been ignored is children’s participation in decisions regarded aspects of their growth as free and democratic citizens of their communities (Lundy & Stalford, 2013). In fact, other proposals have wisely included these indicators proposed in this paper as we show in this table 2 (Millennium Ecosystem Assessment, 2005), and the indicators provided by UNICEF (2007) which includes to somehow children’s participation by asking them how they rate their well-being (subjective well-being). Once we have discussed well-being concept, we will use its dimensions to make a first analysis on the current situation of children, particularly in Europe. Save the Children (2012), working with children’s well-being as the interrelation of five sectors (health, nutrition, water and sanitation, education, and child protection) has remarked the steps that have been reached to the date: • 12,000 fewer children under five died every day in 2010 than in 1990. • Stunting –damage to children’s physical and cognitive development caused by malnutrition– declined in developing countries from 45% to 28% between 1990 and 2008, while the prevalence of underweight children also fell. • The number of children enrolled in pre-primary education worldwide increased from 112 million to 157 million between 1999 and 2009. • From 1999 to 2009 an additional 56 million children enrolled in primary school and the number of out-of-school primary-age children decreased by 38 million. • Globally, girls now make up 53% of out-of-school primaryage children, compared with 58% in 1990. • The proportion of adolescents of lower secondary age who were out of school worldwide fell by 21% from 1999 to 2009. Although we recognize the relevance of all these improvements, much more has to be done for children and their future as we show below in detail. 2 Alcu Constituents of well-being Security, Basic material for good life, Health, Good social relations and Freedom of choice and action Constituents of well-being Security - Personal safety - Secure resource access - Security from disasters Basic material for good life - Adequate livelihoods - Sufficient nutritious food - Shelter - Acces to goods Health - Strength - Feeling weel - Acces to clean air and water Freedom of choice and action Opportunity to be able to achieve what an individual values doing and being Good social relations - Social cohesion - Mutual respect - Ability to help others Table 2. Constituents of well-being Source: Millennium Ecosystem Assessment (2005)
- 3. POSITIONPAPER january 2014 What do we know about children’s well-being in Europe? Methodoloy Indicator We follow an evidence-based approach in order to account for all the key indicators in children’s well-being. Work and life balance In Table 3, we propose a list of indicators that have been normally used in measuring children’s well-being and the differences between United States and Europe in these key indicators. Housing Focusing our attention on Europe, we realize there are clear differences inside the Union in terms of well-being. Graph 1 shows the overall situation of 6 dimensions in Europe, dividing the Member States in their rank-position, depending on material well-being (monetary deprivation, material deprivation), health and safety (health birth, childhood mortality, and preventive health services), educational well-being (achievement, participation), behaviour and risks (exposure to violence, health behaviours, risk behaviours), family and peer relationships (family structure, family relationships, and peer relationships), and subjective well-being (health, school life, and personal well-being). In order of overall well-being on the ranking, the Member States are Netherlands, Sweeden, Denmark, Finland, Luxembourg, Spain, Switzerland, Norway, Italy, Ireland, Belgium, Germany, Greece, Poland, Czech Republic, France, Portugal, Austria, Hungary, and United Kingdom. Europe USA Health status Education and skills Civic engagement and governance Environmental quality Personal Security Subjective well-being Social connections Rights Participation Peer relationships Family relationships Law, Norms, and Political context Customs and traditions Tax and Fiscal situation Institutional development Graph 1. Overall children’s well-being in European States Parties by rank-position (2007) Table 3. List of indicators to measure children’s well-being Source: Europe indicators from “An overview of child well-being in rich countries” (UNICEF, 2007); USA indicators from “America’s children: key national indicators of well-being” (FIFCFS, 2013). Why do we consider well-being a central topic for constructing children’s social policies? Evidence clearly points out the importance of investing in children’s well-being. For instance, World leaders of 192 states have made commitments to children through the UN Convention on the Rights of the Child (UNCRC), and the Millennium Declaration. Investing in child-sensitive development is key to empowering children’s rights and reaching the Millennium Development Goals (MDGs). Investing in children’s well-being also has significant potential payoffs for economic growth which, in turn, translates to greater productivity, sustainable growth and lower child and infant mortality. Thus, it is crucial in breaking the cycle of intergenerational poverty. Good infant and child nutrition leads to an estimated 2–3% growth annually in the economic wealth of developing countries (UNSCN, 2010). Source: UNICEF (2007) Tackling malnutrition in early life can increase lifetime earnings by 20% (Grantham-Macregor et al., 2007, in Save the Children, 2011). Finally, investing in children means that countries are at a better position to receive the crop that they have seed in the form of qualified and better adults who contribute to society and economy, and help build social cohesion. 3
- 4. POSITIONPAPER january 2014 Government spending and children well-being Next, we show how several countries invest their resources on children and how that affects to their general well-being. In doing so, we first introduce the general case by presenting public expenditure on different children’s age group (i.e. early, middle, and late childhood). Then, we focus on the differential expenditure of the countries for different indicators, and how this is related to effectiveness of resources allocation by giving a specific example of an area of well-being: children’s education (the PISA report). Graph 2. shows public expenditure per child in 27 OECD countries in 2007. Most of them show an increase in spending as children get older, with most spending in late childhood. We point this out as a problem since evidence claims that governments and policy makers would be better locate their resources and public expenditure in early childhood more than they do in late childhood (Oberkleid et al., 2013). The Organization for Economic Cooperation and Development (OECD) defines early childhood education and care (ECEC) as services that include “all arrangements providing care and education for children under compulsory school age, regardless of setting, funding, opening hours, or programme content.” For instance, Oberkleid et al. (2013) noticed that many children arrived at school with serious developmental problems related to many areas affecting their behavior. They pointed out family and parent risk factors linked to social disadvantage such as poor relationships and developmental vulnerability. This developmental vulnerability could be reduced by using several strategies including family support, high-quality early education, care programmes in the preschool years, and early detection of emerging problems and risk factors. This only could be achieved if policy makers realize that the public expenditure is ineffectively allocated for the different range ages as evidence marks that should be taken into account. We choose Iceland as a paradigm of a country in which social expenditure decreases by children’s age. If we compare Graph 1 and Graph 2, we can see that differences in expenditure lead to different overall well-being levels. If there was a linear relation between expenditure and well-being, those who ranked higher in Graph 1 had to be the countries that spent more in resources in Graph 2, and as we see below, that does not necessarily be the case. Graph 2. Proportion of total public social expenditure by age group (2007) Source: OECD Social Expenditure Database and OECD Education database. We want to make clear that one relevant reason for the mismatch between expenditure (antecedent) and overall well-being (outcome) could be the ineffectiveness on public expenditure. In order to illustrate this point we use the case of education as a specific indicator and a key one for children’s well-being. Although the null correlation between public expenditure on education and performance on PISA could be disingenuous since contextual relevant variables for education are not taking into account such as parent’s monitoring, parent’s education level, parent’s dialogue and knowledge co-construction, we can use it as a sufficient sign for making clear that resources are not effectively allocated. In graph 3, countries that spend more money on education do not necessarily be the countries which better scores on PISA. For instance, there are some countries that invest a great amount of their GDP on education and obtain a poor performance on PISA, such as Portugal or Austria, compared to those countries that invest the same amount of money and obtain better scores, such as Finland (see the red ellipse on the graph 3). How can we explain this 4
- 5. POSITIONPAPER january 2014 difference in performance? We argue that this may be explained not only by non-monetary factors that influences education scores but also by how countries efficiently invest their resources. OECD (2006) concluded that the efficiency of resources invested in secondary education are also related to family background, measured by GDP per capita, and education of parents. Other important finding by OECD (2006) points out that technical efficiency could be improved when controlling for the effects of socio-economic background on educational attainment. Other relevant factors, including institutional factors have been investigated by the OECD (2007). However, some characteristics within the education system seem to affect efficiency such as the teachers/students ratio or school size (OECD, 2007). Regarded those factors outside the education system, Alfonso and St. Aubyn (2006) show, and OECD ratifies, that efficiency indices significantly changes when environmental factors such as GDP per capita or education of parents are included into the equation. For instance, Hungary, Portugal and Spain improve their relative position, whereas Sweeden, Denmark and Germany worsen their relative positions with respect the former approach that only measures technical efficiency. Graph 3. Correlation between PISA scores and money spend on education Source: OECD (2003) 5
- 6. POSITIONPAPER january 2014 Conclusions Evidence suggests that well-being is an important factor and should be measured properly. On one hand, countries that invest a large amount of their GDP in children’s well-being are at a better position to receive from them in the long-term back benefits such as qualified human resources which, in turn, lead to economic growth. On the other hand, this investment usually is not efficiently displayed as demonstrates the not always linear relationship between expenditure and children’s well-being. This implies that there is a gap that should be filled out by improving the resource allocation and how this is measured in many ways: 1) detection and inclusion of children well-being indicators that permit to measure the concept as a whole including all the important dimensions, 2) statistics techniques and other refinements regarding data collection should be met, 3) specific guidelines should be provided to policy-makers in order to facilitate them the linkage between what evidence clearly shows and the way this can be implemented in the real-world. Finally, the major policy implication that emerges from the results showed in this report is the recommendation and the actual need to move the focus on public expending on care towards prevention. Governments are working out in order to incorporate well-being and its great emphasis on prevention into standard policy making. This is not surprising given the need for intervention due to the risks to children’s well-being. For instance, consider the case of long-term unemployment. This causes misery, and that misery is in addition to the strains that high unemployment puts on private income and public sector budgets. If we get people back to work, this leads to those people start paying taxes. In doing so, changing the way we look at prevention instead of care means that we put more effort and resources on coping with obstacles to getting people back to work. One possible intervention that stems from this example could be devoting resources to increase potential workers’ self-esteem. What follows is another example collected in a recent report on World Happiness about the need to reorient health budgets to include well-being on their priorities: Mental illness is a great cause of misery, and of unemployment and low productivity. Social networks are also tremendously important – lack of human contact and loneliness can have clear physiological effects and negative consequences for our health. A focus on well-being would shift resources from physical to mental health and would make more use of “social” prescriptions. Regarding this report (World Happiness Report, 2013), they conclude that if governments spend public money upfront, for example by improving education, resilience and emotional intelligence, this can allow people to live healthier, more fulfilled and more productive lives. Well-being clearly leads you to focus on asset-based approaches to policy rather than deficits. 6
- 7. POSITIONPAPER january 2014 Bibliography European Commission (2013). Scientific evidence for policy making: Research insights from socio-economic and sciences and humanities. Luxembourg: Publications Office of the European. doi:10.2777/45029 Federal Interagency Forum on Child and Family Statistics (2013). America’s Children: Key National Indicators of WellBeing. Washington, DC: U.S. Government Printing Office. http://childstats.gov Helliwell, J., Layard, R., & Sachs, O. (2013). World Happines Report. New York: UN Sustainable Development Solutions Network. Mandl, U., Dierx, A., & Ilzkovitz, F. (2008).The effectiveness and efficiency of public spending. Economic Papers: European Commission. doi: 10.2765/22776. Millennium Ecosystem Assessment (2005). Living Beyond Our Means: Natural Assets and Human Well-being. Edited independently from the Board. OECD (2010). PISA 2009 Results: What Students Know and Can Do – Student Performance in Reading, Mathematics and Science (Volume I) http://dx.doi.org/10.1787/9789264091450-en OECD (2011). Compendium of OECD Well-Being Indicators. OECD Publishing OECD (2012). Education at a Glance 2012: OECD Indicators, OECD Publishing. http://dx.doi.org/10.1787/eag-2012en OECD (2013). Economic Well-being (p. 25-38). In Framework for Statistics on the Distribution of Household Income, Consumption and Wealth. OECD Publishing Stiglitz, J. E., Sen, A., Fitoussi, J. (---).Report by the Commission on the Measurement of Economic Performance and Social Progress- www.stiglitz-sen-fitoussi.fr UNICEF (2007). Child poverty in perspective: An overview of child well-being in rich countries, Innocenti Report Card 7, UNICEF Innocenti Research Centre, Florence.