The document provides guidance on developing metadata in Oracle Business Intelligence Enterprise Edition (OBIEE). It discusses best practices for importing data, defining physical, business and presentation layers, creating hierarchies, applying formatting changes through analytic applications, and more. Repository documentation utilities are also described that can generate metadata dictionaries and documentation of repository mappings.

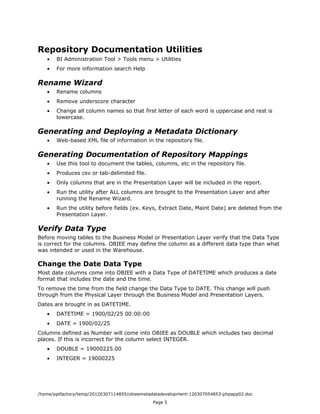
![Business Layer
• Use Complex Joins to join new items created in the Business Layer, if any
• Aggregate items that can be summed
• Use Rename Wizard to rename fields and tables
o One table at a time (in on-line mode)
o Rules must be ordered, or perform one rule at a time
• Group columns with dummy columns, e.g.
--- Program Plan Begin ---
--- Program Plan End ---
o Check "Use existing logical column as the source"
o Enter the number 1 in the formula box
Presentation Layer
• Group columns with subfolders
o Create new Presentation Table as "– [Name]" (that's hyphen space name)
o Creates a subfolder under the parent folder
It is also possible to do this with "->" in the Description, but this is
less desirable because it is not visible in Administrator unless you are
looking at the column's Properties
• For Administrator convenience, use icons to relate items in Presentation and
Business Model layers
Denormalized tables
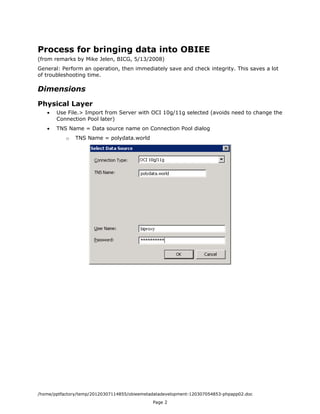
• Physical layer
o Several subject-related denormalized tables may be pulled in together
o Create an alias of each denormalized table
o In the Physical Diagram, use a simple join from the original table to the alias
o The alias becomes the "fact" table
• Business Layer
o Delete columns from the "fact" table that are not used for measures (all but
the join column in most cases)
• Presentation Layer
o Delete alias table (assuming it does not contain measures)
o Create different folders (subject areas) for different denormalized tables so
that people don't try using them together. (While this would not be allowed in
Answers, trying to do so returns an error message that is confusing for the
user.)
/home/pptfactory/temp/20120307114855/obieemetadatadevelopment-120307054853-phpapp02.doc
Page 4](https://image.slidesharecdn.com/obieemetadatadevelopment-120307054853-phpapp02/85/Obiee-metadata-development-4-320.jpg)
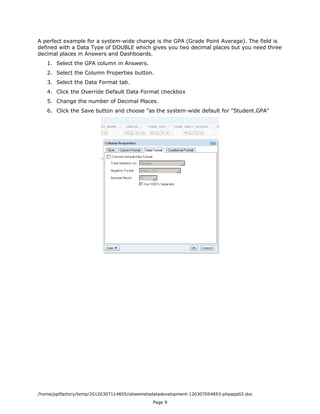
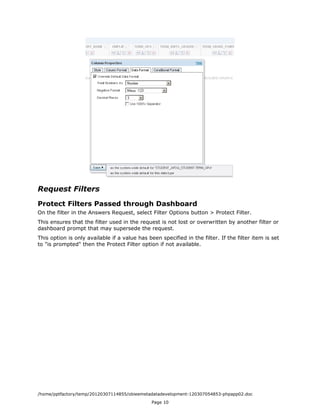
![Note: Column Properties which include Style, Column Format, Data Format and Conditional
Format are applied in Answers.
Where are system-wide changes stored?
System-wide changes are stored in the Web Catalog and must be moved from development
to production servers along with requests and dashboards. These files are stored in folders
separate from requests and dashboards.
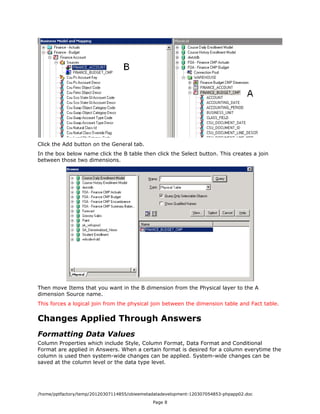
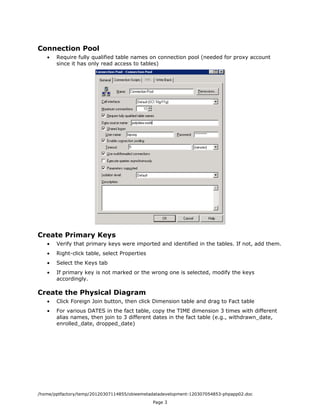
Create Hierarchies
1. Right-click dimension table and select Create Dimension at the bottom of the shortcut
menu.
2. A Hierarchy is created using the name of the dimension table followed by the word Dim.
3. A Grand Total level and Detail level will be created. The Detail level will contain all of the
columns of the dimension.
4. Create child levels using names that match your hierarchy. Right-click the Detail level,
select New Object, Child level.
5. Create a child level below the lowest child level (this will contain the dimension key.)
Move the dimension key to this level. Right-click this key column and remove the
checkmark next to Use for drilldown.
6. Move other columns to their respective levels.
7. Delete any unneeded columns from any level.
8. Select columns within each level, right-click and select New Logical Level Key. Select all
columns as keys if you want to see them in drilldown.
9. For any levels that should be skipped in the drill-down, select all columns in the level,
right-click and remove the checkmark next to Use for drilldown.
10. At level two check for a Detail key that was automatically created. (Right-click level two,
Properties, click the Keys tab). Highlight and delete Detail Key.
Hierarchy Aggregation
In the hierarchy, starting from the top and moving down. At each level below the Grand
Total level, double-click the level. In the field Number of elements at this level: enter 10
and increase in increments of 10 through all levels in the hierarchy.
Hierarchy Errors
OBI Tool Metadata Errors and Solutions
[nQSError: 15001] Could not load navigation space for subject area Student Enrollment.
[nQSError: 15019] Table Student Class Section is functionally dependent upon level
Institution Code, but a more detailed child level has associated columns from that same
table or a more detailed table.
This message occurs when either a key is in the Total level or when the first child level
below the Total level contains two keys. Right-click on the Total level and select Properties.
The Keys tab should be grayed out. If it is selectable, check to see what is there and delete
it. Go to the next level down, right-click, select the Keys tab. Only one Key should appear.
Delete the key that does not belong.
/home/pptfactory/temp/20120307114855/obieemetadatadevelopment-120307054853-phpapp02.doc
Page 6](https://image.slidesharecdn.com/obieemetadatadevelopment-120307054853-phpapp02/85/Obiee-metadata-development-6-320.jpg)