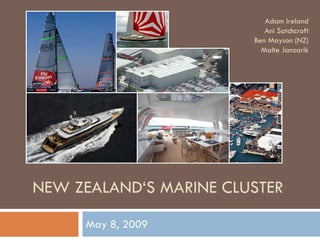
The document provides an overview of New Zealand's marine cluster. It summarizes that the cluster generates NZ$1.9 billion in annual sales, with growth across most segments from 2003-2008. The largest segments are superyachts, launches, and trailer boats. The cluster is growing but faces challenges such as a lack of cluster strategy and collaboration that recommendations hope to address through a new cluster program, investment incentives, trade improvements, and infrastructure development.
Tourism's economic importance to the Transylvania Co. & Brevard North Carolina's economy. Tourist spending, jobs & taxes generated. Includes counties in Western North Carolina. Presentation to Transylvania Co. Brevard Chamber of Commerce and Brevard College.
Tourism's economic importance to the Transylvania Co. & Brevard North Carolina's economy. Tourist spending, jobs & taxes generated. Includes counties in Western North Carolina. Presentation to Transylvania Co. Brevard Chamber of Commerce and Brevard College.
By Kathleen Flaherty.
Presented at the ASTI-FARA conference Agricultural R&D: Investing in Africa's Future: Analyzing Trends, Challenges, and Opportunities - Accra, Ghana on December 5-7, 2011. http://www.asti.cgiar.org/2011conf
Day 1- Session 1: What is the new 'normal' for mining?
Objective Capital Global Mining Investment Conference 2010
Stationers' Hall, City of London
28-29 September 2010
Speakers:
David Humphreys - DaiEcon
Richard Chase - Ambrian Partners
Want to know if your start-up is in a sector set to boom – or bust? Or are you wondering which sector is best for start-ups?
For start-ups, good ideas will remain good ideas regardless of economic conditions, but it’s advisable to see which way the wind is blowing before launching your business.
Business information analyst IBISWorld has researched 500 industries, forecasting which sectors are expecting exceptional growth, as well as identifying those that are facing troubled times ahead.
Tom Bowden
HealthLink
(Friday, 10.30, General 2)
See video at http://www.slideshare.net/secret/7EmESReifPHGa8
Provision of immediate access to accurate, pertinent, satisfactorily comprehensive clinical information in a dependable and cost-effective manner has long been an elusive goal. Attempts to implement shared record systems (both summary record systems and comprehensive record systems) have proved extraordinarily challenging. However, the Virtual Health Record (VHR) is an entirely new approach to patient information sharing. It is based upon linked regional implementations of a new technology. The methodology commences with a consensus building process amongst providers to determine what information is shared and how it is to be shared? VHR lends itself to an incremental approach to implementation.
Now being implemented in its second and third regions, the Virtual Health Record system is gradually being expanded as the technology and support systems are bedded in and the clinicians across each region learn to trust one another and work closely together to deliver a highly functional and reliable method of communication.
The Virtual Health Record is proving to be a viable method for sharing information across the healthcare ecosystem.
Presentation built in the context of a real estate class taken at Brandeis International Business School.
In the perspective of a meeting with investors, the presentation was created to help gather investments of $100M split between three projects in China.
Falcon stands out as a top-tier P2P Invoice Discounting platform in India, bridging esteemed blue-chip companies and eager investors. Our goal is to transform the investment landscape in India by establishing a comprehensive destination for borrowers and investors with diverse profiles and needs, all while minimizing risk. What sets Falcon apart is the elimination of intermediaries such as commercial banks and depository institutions, allowing investors to enjoy higher yields.
RMD24 | Retail media: hoe zet je dit in als je geen AH of Unilever bent? Heid...BBPMedia1
Grote partijen zijn al een tijdje onderweg met retail media. Ondertussen worden in dit domein ook de kansen zichtbaar voor andere spelers in de markt. Maar met die kansen ontstaan ook vragen: Zelf retail media worden of erop adverteren? In welke fase van de funnel past het en hoe integreer je het in een mediaplan? Wat is nu precies het verschil met marketplaces en Programmatic ads? In dit half uur beslechten we de dilemma's en krijg je antwoorden op wanneer het voor jou tijd is om de volgende stap te zetten.
Digital Transformation and IT Strategy Toolkit and TemplatesAurelien Domont, MBA
This Digital Transformation and IT Strategy Toolkit was created by ex-McKinsey, Deloitte and BCG Management Consultants, after more than 5,000 hours of work. It is considered the world's best & most comprehensive Digital Transformation and IT Strategy Toolkit. It includes all the Frameworks, Best Practices & Templates required to successfully undertake the Digital Transformation of your organization and define a robust IT Strategy.
Editable Toolkit to help you reuse our content: 700 Powerpoint slides | 35 Excel sheets | 84 minutes of Video training
This PowerPoint presentation is only a small preview of our Toolkits. For more details, visit www.domontconsulting.com
Tata Group Dials Taiwan for Its Chipmaking Ambition in Gujarat’s DholeraAvirahi City Dholera
The Tata Group, a titan of Indian industry, is making waves with its advanced talks with Taiwanese chipmakers Powerchip Semiconductor Manufacturing Corporation (PSMC) and UMC Group. The goal? Establishing a cutting-edge semiconductor fabrication unit (fab) in Dholera, Gujarat. This isn’t just any project; it’s a potential game changer for India’s chipmaking aspirations and a boon for investors seeking promising residential projects in dholera sir.
Visit : https://www.avirahi.com/blog/tata-group-dials-taiwan-for-its-chipmaking-ambition-in-gujarats-dholera/
"𝑩𝑬𝑮𝑼𝑵 𝑾𝑰𝑻𝑯 𝑻𝑱 𝑰𝑺 𝑯𝑨𝑳𝑭 𝑫𝑶𝑵𝑬"
𝐓𝐉 𝐂𝐨𝐦𝐬 (𝐓𝐉 𝐂𝐨𝐦𝐦𝐮𝐧𝐢𝐜𝐚𝐭𝐢𝐨𝐧𝐬) is a professional event agency that includes experts in the event-organizing market in Vietnam, Korea, and ASEAN countries. We provide unlimited types of events from Music concerts, Fan meetings, and Culture festivals to Corporate events, Internal company events, Golf tournaments, MICE events, and Exhibitions.
𝐓𝐉 𝐂𝐨𝐦𝐬 provides unlimited package services including such as Event organizing, Event planning, Event production, Manpower, PR marketing, Design 2D/3D, VIP protocols, Interpreter agency, etc.
Sports events - Golf competitions/billiards competitions/company sports events: dynamic and challenging
⭐ 𝐅𝐞𝐚𝐭𝐮𝐫𝐞𝐝 𝐩𝐫𝐨𝐣𝐞𝐜𝐭𝐬:
➢ 2024 BAEKHYUN [Lonsdaleite] IN HO CHI MINH
➢ SUPER JUNIOR-L.S.S. THE SHOW : Th3ee Guys in HO CHI MINH
➢FreenBecky 1st Fan Meeting in Vietnam
➢CHILDREN ART EXHIBITION 2024: BEYOND BARRIERS
➢ WOW K-Music Festival 2023
➢ Winner [CROSS] Tour in HCM
➢ Super Show 9 in HCM with Super Junior
➢ HCMC - Gyeongsangbuk-do Culture and Tourism Festival
➢ Korean Vietnam Partnership - Fair with LG
➢ Korean President visits Samsung Electronics R&D Center
➢ Vietnam Food Expo with Lotte Wellfood
"𝐄𝐯𝐞𝐫𝐲 𝐞𝐯𝐞𝐧𝐭 𝐢𝐬 𝐚 𝐬𝐭𝐨𝐫𝐲, 𝐚 𝐬𝐩𝐞𝐜𝐢𝐚𝐥 𝐣𝐨𝐮𝐫𝐧𝐞𝐲. 𝐖𝐞 𝐚𝐥𝐰𝐚𝐲𝐬 𝐛𝐞𝐥𝐢𝐞𝐯𝐞 𝐭𝐡𝐚𝐭 𝐬𝐡𝐨𝐫𝐭𝐥𝐲 𝐲𝐨𝐮 𝐰𝐢𝐥𝐥 𝐛𝐞 𝐚 𝐩𝐚𝐫𝐭 𝐨𝐟 𝐨𝐮𝐫 𝐬𝐭𝐨𝐫𝐢𝐞𝐬."
Improving profitability for small businessBen Wann
In this comprehensive presentation, we will explore strategies and practical tips for enhancing profitability in small businesses. Tailored to meet the unique challenges faced by small enterprises, this session covers various aspects that directly impact the bottom line. Attendees will learn how to optimize operational efficiency, manage expenses, and increase revenue through innovative marketing and customer engagement techniques.
[Note: This is a partial preview. To download this presentation, visit:
https://www.oeconsulting.com.sg/training-presentations]
Sustainability has become an increasingly critical topic as the world recognizes the need to protect our planet and its resources for future generations. Sustainability means meeting our current needs without compromising the ability of future generations to meet theirs. It involves long-term planning and consideration of the consequences of our actions. The goal is to create strategies that ensure the long-term viability of People, Planet, and Profit.
Leading companies such as Nike, Toyota, and Siemens are prioritizing sustainable innovation in their business models, setting an example for others to follow. In this Sustainability training presentation, you will learn key concepts, principles, and practices of sustainability applicable across industries. This training aims to create awareness and educate employees, senior executives, consultants, and other key stakeholders, including investors, policymakers, and supply chain partners, on the importance and implementation of sustainability.
LEARNING OBJECTIVES
1. Develop a comprehensive understanding of the fundamental principles and concepts that form the foundation of sustainability within corporate environments.
2. Explore the sustainability implementation model, focusing on effective measures and reporting strategies to track and communicate sustainability efforts.
3. Identify and define best practices and critical success factors essential for achieving sustainability goals within organizations.
CONTENTS
1. Introduction and Key Concepts of Sustainability
2. Principles and Practices of Sustainability
3. Measures and Reporting in Sustainability
4. Sustainability Implementation & Best Practices
To download the complete presentation, visit: https://www.oeconsulting.com.sg/training-presentations
Discover the innovative and creative projects that highlight my journey throu...dylandmeas
Discover the innovative and creative projects that highlight my journey through Full Sail University. Below, you’ll find a collection of my work showcasing my skills and expertise in digital marketing, event planning, and media production.
Premium MEAN Stack Development Solutions for Modern BusinessesSynapseIndia
Stay ahead of the curve with our premium MEAN Stack Development Solutions. Our expert developers utilize MongoDB, Express.js, AngularJS, and Node.js to create modern and responsive web applications. Trust us for cutting-edge solutions that drive your business growth and success.
Know more: https://www.synapseindia.com/technology/mean-stack-development-company.html
Unveiling the Secrets How Does Generative AI Work.pdfSam H
At its core, generative artificial intelligence relies on the concept of generative models, which serve as engines that churn out entirely new data resembling their training data. It is like a sculptor who has studied so many forms found in nature and then uses this knowledge to create sculptures from his imagination that have never been seen before anywhere else. If taken to cyberspace, gans work almost the same way.
Affordable Stationery Printing Services in Jaipur | Navpack n PrintNavpack & Print
Looking for professional printing services in Jaipur? Navpack n Print offers high-quality and affordable stationery printing for all your business needs. Stand out with custom stationery designs and fast turnaround times. Contact us today for a quote!
3. NZ… a small, isolated island where sheep outnumber people
Located… nowhere (Fun) Facts…
Population
China
• Human: 4.2m
Auckland
• Sheep: 40.1m
(pop: 1.3m)
Australia
Prosperity
• Think: S. Korea or Israel
• GDP per capita: $29,220
Economic Drivers
Distance (by air) from:
• Dairy, Meat, Forestry, Fishing
• Sydney – 3 hrs Wellington
(capital, pop: 400k)
• Singapore – 10 hrs
National ‘icons’
• Los Angeles – 13 hrs
Christchurch
• London – 23 hrs (pop: 400k)
4. Moderate historical prosperity growth driven by increases in
workforce participation and employment
Economic Performance: Drivers of Real GDP per capita Participation Rate (%)
70%
68%
66%
Average p.a. growth 64%
Employment Growth (%) 62%
• ‘86-96: 1.0% 1986 1992 1998 2004
4
• ‘97-07: 2.1%
- 2
Real GDP (% chg) 0
-21986 1992 1998 2004 Unemployment Rate (%)
8%
-4
6%
12%
- 4%
10%
Real GDP p/c (% chg) 2%
x 8%
6%
0% 4%
Labour Productivity (% chg)
-2%1986 1992 1998 2004 2%
6
0%
4
1986 1992 1998 2004
2 % 4
0
2
-21986 1992 1998 2004
Population Growth (%)
-4
0
1986 1992 1998 2004
3
-2
2
1
0
1986 1992 1998 2004
Employment gains are positive, however, little progress has been made
on the more important driver of economic progress: labour productivity
Source: OECD; EIU
5. Labour productivity low by international standards
Low Labour Productivity… …With No Sign NZ Is Closing The Gap
Labour Productivity Labour Productivity
vs. GDP per capita (PPP): 2007 Growth: 1983-2007
(US$’000, PPP)
GDP per capita
60
Period 83-87 88-92 93-97 98-02 03-07
Average 1.2% 1.8% 1.1% 1.8% 1.0%
Norway
50 US
Change in labour productivity (% p.a.)
4.0%
Ireland
Canada
40 Average
Australia 3.0%
(83-07)
UK Germany
Japan France G7
OECD average 2.0%
NZ
30
Australia
($32,664)
Greece
Korea NZ
1.0%
20
Poland 0.0%
Turkey
Mexico
10
-1.0%
0 -2.0%
10 30 50 70 90 1983 1987 1991 1995 1999 2003 2007
$40.30/hour GDP per hour worked
(US$/hour)
NZ is lagging its OECD peers in terms of
prosperity due its low labour productivity
Source: OECD
6. NZ has a number of unique and valuable endowments…
isolation coupled with a tiny population are the major negatives
New Zealand: National Endowments
x
Favorable… Not so Favorable…
• Huge distance to markets, particularly
• ‘Clean and green’ image
the most attractive (Europe, US)
(perception and reality)
• Tiny population, low density
• Good climate for agriculture
• Unlike Australia, for example, NZ has
• Southern Hemisphere location
few significant natural resource
provides off-season growing
deposits (minerals, oil etc)
opportunities in serving Northern
Hemisphere markets
• High rainfall, and Southern Alps
snowmelt provide good conditions
for inexpensive Hydro-power (70%
of electricity supply)
• Large ocean territory: 7th largest
exclusive economic zone (EEZ) in
the world
Note: Marine specific endowments addressed elsewhere
7. A mixed macroeconomic report card
Macroeconomic Performance Overview
CPI (% change p.a.) Current Account (% of GDP) x
15% 1983 1987 1991 1995 1999 2003 2007
0%
Low inflation since mid 1980s
10%
-5%
5%
-10%
0%
Persistent current account deficits
1983 1987 1991 1995 1999 2003 2007 -15%
x x
Long-Term Bond Yield (%) Exchange rate (NZD/USD, mthly avg)
25%
2.5
High versus OECD peers
20% Volatile Currency
2.0
15%
10%
1.5
5%
1.0
0%
1983 1988 1993 1998 2003 2008
1987 1991 1995 1999 2003 2007
Imports and Exports (% GDP) FDI (% of GDP) x
40% 8%
Decreasing over time
Exports 6%
Imports
30% 4%
Internationalisation of economy 2%
20% 0%
1983 1987 1991 1995 1999 2003 2007 1983 1987 1991 1995 1999 2003 2007
Source: OECD; EIU
8. Strong, business-friendly national institutions
Internationally Ranked(1) Institutional Highlights
Stable Politics Universities
Sensible Trade
• Multi-party, • 5 universities in
• Low Tariffs (2.7%)
moderate top 500 (global)
• FTA: China,
Singapore,
Thailand, Chile,
Independent Central
Health Care
Australia, ASEAN
Bank
(coming) • Cost-effective
• Pure Inflation
mandate • Ban on litigation
for personal injury
Non-distortive
Export Support
Efficient Legal
System
• NZTE
Weak Spots(?)
Robust Anti-Trust
Low Corruption • High Taxes, Big Govt
• Com Commission
• Ranked #1 • 30% corporate, 39% top
income bracket
• Govt: 40% of GDP
Labour Policy
• Underdeveloped/shallow capital
• Weak unions, markets
good flexibility
• Prevalence of SOEs
• Restrictions on Foreign Capital
(land, telco, airline)
Free Capital Flows
(1) Heritage Foundation, 2009 Index of Economic Freedom; this is another source in addition to the GCR, which tells a similar story
(highlights can be found in the backup section of the presentation)
9. High quality human capital, but not enough of it
…Partial Offset
Strong HDI But People Leave… From Immigration
% of College Educated • 87,000 permanent
Population Living O/Seas migrants in 2007
• 10,100 in net migration
(Select Countries, Rank)
• 24% on work
permits
1. US 0.7
2. Japan 1.0 • Government Policy
• Focus on certain
9. Spain 2.5
categories - skilled
16. Australia 3.7 Migrant Policy and
Active Investor
27. Italy 5.7
Migrant category
42. Singapore 8.0
• Source countries:
55. UK 12.2
• UK (26%)
• NZ is 19th in the world in … … • China (12%)
human development • India (9%)
65. NZ 17.0
• Citizens enjoy long • South Africa (8%)
healthy lives, excellent 78. Ireland 26.7
education access, and
high standards of living
Human capital is a strength, although retention seems to be an issue
Source: Human Development Index (UNDP), OECD
10. Poor prosperity, given relatively strong competitiveness metrics
Overall: GCI vs GDP p/c Macro (MP) vs …
GDP p/c, GDP p/c,
log scale log scale US
US
Ireland
S. Korea
NZ
NZ
Estonia
Low GCI High GCI Low MP High MP
Institutions (SIPI) vs … Micro (MICRO) vs …
GDP p/c, GDP p/c,
US US
log scale log scale
NZ
NZ
Estonia
Low SIPI High SIPI Low MICRO High MICRO
NZ’s prosperity lags peers with comparable GCIs. Is NZ’s
microeconomic environment the reason for this disparity?
GCI Ranking
Note: GCI = (Overall) Global Competitiveness Index; SIPI = Social and Political Infrastructure; MP = Competitiveness of Macroeconomic
Policy; MICRO = Microeconomic competitiveness; Source: Institute for Strategy and Competitiveness
11. NZ’s national diamond characterised by extremes… some areas
world-class, while others are more… emerging economy
New Zealand: National Diamond
+ Low trade barriers
+ Brand NZ: clean and green
+ Flexible labour policies
+ Low levels of bureaucracy
+ Strong antitrust
+ Strong prim/sec education
+ Good investor protection
+ Easy to start a business
- Lack of rivalry/intensity
- Brain drain
- “Kiwi” lifestyle = leisure-focused
- Low foreign language skills Context for Firm
x x - Job security/safety net valued
- Lack of scientists/engineers
Strategy and - Low foreign ownership and
- Weak R&D/innovation
Rivalry international tech transfer
- Infra gaps (roads, rail, telco)
- Weak capital markets
Factor (Input) Demand
Conditions Conditions
+ Awareness of the need for + National passions have driven key
Related and
cluster development international successes e.g. sport
+ Efforts to push cluster policy Supporting
- Historic trade relationship with UK
to a regional level
Industries
x led to a focus on primary products
- Weak clusters - Demand seldom drives innovation
x - Few specialized input or anticipates trends
suppliers, high reliance on - Govt procurement not advanced
imported inputs
12. Relatively undiversified economy… dominated by agriculture
NZ, Exports Portfolio By Cluster: 1997-2007
Share Of World
2.5
Exports, 2007 (%)
Processed Food (Dairy)
2.0
1.5
Agri Product (Meat)
Fishing
Marine(1)
Tourism
Forestry
Furniture
0.5
Communications
-0.5 -0.3 -0.1 0.1 0.3 Change in Nation’s Share
Of Exports (%, 1997-2007)
Two of NZ’s key clusters, dairy and tourism, are doing well,
however, majority of other clusters are losing ground
(1) Relative position of the marine cluster estimated based on data we have collected and interviews conducted; the International Cluster Analysis
definition includes commercial shipbuilding, which distorts the true position of NZ’s marine cluster, which focuses on boats for private use.
13. Four main recommendations to address NZ’s key challenges
Issues Being Addressed
Recommendations More Detail On Actions
1 • Lack of successful clusters • New cluster policy
Institute a
• Lack of strategy at a cluster level • More $$, more focused
New Cluster
• Lack of collaboration • Private sector driven
Programme
• Lack of effective cluster policy • Collaborative, Decentralized
• Low labour productivity • Kiwisaver compulsory
2
Encourage • Lack of capital intensity • Tax reform: property
Investment • Lack of investment (domestic/FDI) • FDI policy reform
• Low savings rates
3 • Barriers to ‘easy’ trade • Privatize all ports
Mitigate • Inefficiencies at NZ’s ports • Streamline customs
Distance • Inability of NZ firms to • Open skies
internationalize • Focused help from NZTE
4 • Weak infrastructure: electricity, • Infrastructure spend
Alleviate
roads, rail, telco • Skilled immigration
Factor
• Human capital gaps • Graduate retention
Bottlenecks
• Tertiary education reform
For a more comprehensive understanding of all the major
issues and recommendations please see the full written report
15. NZ’s marine cluster generates NZ$1.9B(1) in sales annually…
Major Segments In The Cluster Recent Cluster Performance
CAGR
(03-08)
Superyachts Racing Yachts Total Sales (NZ$m)
Total 7
1,905
• >25m • Sail
Other 15
1,641
1,548
• Sail or • For Racing 5
1,366 Inflatables
Motor competition 2
Refit 10
Trailer Boats (3)
Launches 17
Launches Trailer Boats Superyachts 4
• 8-25m • 3-8m Equipment 6
• Sail or • Motor
Motor 2003 2005 2006 2008
Exports
Imp/Exp (% of Sales)
(%)
Inflatables/RHIBs Equipment
100% Superyachts
• Sails, masts, Most internationally
• Inflatable
Racing
winches, competitive segments
Yachts
• Motor
electronics,
interiors…
Equipment
Refit/Maintenance Other Services
50%
Inflatables
• Repair • Fuel, marinas, Refit
Launches
facilities insurance, Trailer Boats
charters,
Other
retailing… Imports (%)
50%
(1) Segmentation and data as per the New Zealand Marine Industry Association; NZ$1.9B equivalent to US$1.1B
Size: total sales (NZ$m)
at current exchange rate of 0.567US$ per NZ$
16. 75% of marine activity is located in Auckland or nearby regions
NZ Marine Industry Activity Auckland Cluster (examples)
Northland
4%
Gulf Harbour
Bay of Plenty
58% Marina
Auckland 6% (#2 in Auckland)
5%
Waikato
Hobsonville
3%
Taranaki
West Park Marina
4% (#3 in Auckland)
Wellington
Westhaven Marina Wynyard Point
(#1 in Auckland)
Alloy
Yachts
9%
Christchurch
3% Otago
SuperYacht Mfg Evidence of other Marine Activity Marinas
x% % of NZ Marine Industry Activity (2005)(1) Evidence of agglomeration
even within parts of Auckland
(1) Remaining 8% of activity not marked occurs across a variety of smaller regions
Source: New Zealand Marine Industry Survey, 2005; Googlemaps
17. The cluster competes in a global market that has
recorded solid growth… strongest gains at the top-end
Global Market: Size and Growth Global Market: Key Features
• The global pleasure craft market = • US and Europe are largest end-markets
US$18B (an estimated 90% of end-market
demand), US market more penetrated
and lower growth
• Growth of around 5% per annum on a
value basis between 1997 and 2007
• Market is fragmented, largest player
– Superyachts fastest growing (Brunswick, US) has 14% global share in
boat building
• Volume growth has been steady since
• Bifurcated market: cost / price
1970 with some cyclicality. Real value
increasingly important for lower/mid
growth driven by increasing average boat
segment (increased standardization), but
size
less so for higher end (custom yachts)
Long-term outlook looks good… although current economic
conditions obviously taking a toll (‘09 forecast to be down 50%)
18. Largest firms located in Italy, France and US
Global Recreational Boat Building Firms –market shares
France
Beneteau 6% Sweden
Rodriguez 3% Hallberg Rassy <1%
Couach <1%
Dufour <1%
Denmark
Danish Yacht <1%
Netherlands
Royal Huisman <1%
Turkey
Feadship <1%
Aegean <1%
Slovenia
Germany
Elan Marine <1%
Bavaria 2%
Hanse 1%
Luerssen <1%
China
US Holland Custom
UK
Brunswick 14% Yachts <1%
Sunseeker 3%
Genmar 5% Taiwan
Princess 2%
Catalina 1% Horizon Yacht <1%
Fairline 2%
Hunter 1%
Croatia
Elan <1% New Zealand
Lagoon <1%
Italy Alloy Yachts <1%
Ferretti 7% Cookson <1%
Australia
Azimt Benetti 6% Fitzroy Yachts <1%
Azzura Yachts <1%
Cantiere 1% Yachting Dev <1%
Seawind <1%
Aicon 1% Jarkan <1%
FIPA <1%
Perini Navi <1%
NZ is very much a niche player on the global stage
Source: ODDO Equity Research, June 2008; MoC team estimates
19. NZ highly ranked within lucrative superyacht segment
The Global Superyacht Market Superyacht Market Data
CAGR
(03-08)
14
• Superyacht orders have grown each year for last # of Orders By Size
10 years – although for 2009, global order intake 916
76m+ 14
down about 50% 61-76m 16
777
• Largest categories (61m+) have seen the rapid 688 46-61m 9
652
growth (>US$1m per meter to build) 37-46m 16
507
480
• Italy dominates the sector 30-37m 12
• Growing share for Taiwan, Turkey, China 27-30m 26
24-27m 18
2003 2004 2005 2006 2007 2008
New Zealand’s Position
% of Orders By Location(1)
NZ is 10th largest superyacht builder
• New Zealand (1.6%)
11 Other
• #3 in sailing superyachts (estimate: 15% global UK
6
market share) Taiwan
9
Germany
– Particularly strong in racing yachts 10
Netherlands
• NZ focuses almost exclusively on custom-built 12
US
yachts; very little activity in ‘production yachts’
• World-renowned for quality
Italy
46
– NZ’s largest superyacht manufacturer, Alloy
Yachts, has won 19 international awards
since 1991
(1) Of orders made in top 10 manufacturing countries; Note: of the 916 superyachts ordered in 2008, 60 were sailing yachts
Source: Showboats International
20. The NZ cluster centres on boat building
Upstream Related Clusters
The New Zealand Marine Cluster
Other Services
Tourism
(e.g. Finance)
• Industry Assoc (MIA)
Institutions for Fishing/
• Export Group (NZ Marine) Commercial
Other Equipment collaboration
• Training Org (BITO) Boats
Downstream
Design
Marine Events
Launches
Boat Building & Yachts
Composites
Boating
Consumables &
Racing Yachts
Inflatables Other Services
Electronics
Marinas
Super Yachts
Trailer Boats
Interiors
Refit &
Maintenance
Masts &
• Trade Promotion (NZTE)
Winches
Government • Local Government (ARC) Yacht
Institutions • Universities (Auckland) Management
• Industrial Research Ltd
Sails &
Rigging
Limited Exports Significant Exports
21. Support provided by public and private
institutions for collaboration
Key Institutions : NZ Marine Cluster
Institutions For Collaboration Government Institutions
• 500+ members; 50% of industry
• Support for NZ Exporters
Marine
• Fees: $400-$1200 per firm NZ Trade & • Global network of offices
Industry
• Data collection on industry Enterprise • Formerly responsible for
Association
• Newsletter on industry
overseeing NZ cluster policy
• Fosters collaboration at sub-
cluster (e.g. CPC standards
• Local government authority
scheme for trailer boats) Auckland
Closely • Regional development strategy
• Provides ‘business’ workshops Regional
linked(1) • Infrastructure/zoning issues
Council Two cluster specific initiatives(2)
•
• Represents Exporters
• 100 members; 85% of exports
• Yacht Research Unit
Runs “Yacht vision”: 1st int
•
• Centre for Advanced Composite
conference for yacht designers Auckland
NZ Marine Materials (CACM)
• Assists at global boat shows,
University
other exporter opportunities (e.g.
Millennium Cup)
• Administers Marine • Government funded R&D entity
Boating Industrial
Apprenticeship scheme (600 • collaboration with Marine firms
Industry Research
currently, ~100 graduates p.a.) (e.g. in composites)
Training Org Ltd
• 75% government funded
(1) BITO is a division of the Marine Industry Association; NZ Marine is a separate organization but shares facilities with the MIA
(2) AucklandPlus, the economic development arm of the ARC is overseeing the Hobsonville marine precinct and the marine sector feasibility study
22. History of cluster closely aligned with competitive sailing
achievements and major yachting events
Competitive Sailing Milestones
1987 1995 2000
1990, 1993 2003
1984
• NZ launches 1st • Team New • America’s Cup held in • Auckland again hosts
• NZ wins
• NZ wins 2 gold and
Americas Cup bid Zealand win Auckland, Team New
Whitbread Round America’s Cup. Team
1 bronze medal at
when event is hosted America’s Cup Zealand successfully
the World race New Zealand loses to
Los Angeles
in Australia after defend title
(and wins again Alinghi, skippered by a
Olympics – first
Australia’s win in ‘83 in 1993) New Zealander
medals for 20 years
Industry Milestones
1992 1994 1996
1991 2003
1986 2000
1979 2006
1987
• Southern • Alloy Yachts • Inaugural ‘Yacht • MIA (est 1965) • Millennium • 8 out of 10 • Southern
• High Modulus • Alloy
• High
wins New Vision’ run by NZ takes out office Cup launched America’s
Spars
instrumental in
Modulus Spars merge
Yachts
Zealand’s first Marine space and
founded produce in Auckland to Cup
founded as developing with largest
employs 1st
Show Boats
their first showcase New syndicates NZ
composites for
surfboard
professional
International
carbon Zealand Super use
New Zealand’s first
mnfcturer competitor –
officers
Award for
fiber spar Southern
America’s Cup Yachts Marten
Super Yachts Spars rigs
challenge Spars
23. All parts of the diamond contributing to success…
however, key fragilities also evident
The New Zealand Marine Cluster
+ Many firms (>1,000)
+ Significant differentiation
+ IFCs present
+ Skilled workforce + Govt support for cluster
- Brain drain - Small # of well-known firms
Context for Firm
x - Skills shortages - Highly fragmented, sub-scale
Strategy and
- Infrastructure/zoning issues
x - Lack of ambition/risk-taking
Rivalry - Reluctance to invest
- Lack of business acumen
Factor (Input) Demand
Conditions Conditions
+ Skilled sailors
+ Commercial boats/fishing
+ Competitive sailing success
Related and
+ Tourism
+ Highest boat ownership in world
Supporting + Safety / quality standards
- Weak capital markets Industries
x - Cluster gaps (e.g. engines,
- Tiny local market overall
advanced raw materials)
x - Negligible local mkt at high end
- Loss of global marine events
Endowments
+ High quality harbors - Distance from major European markets
x
+ Friendly climate for boating
+ S. Hemisphere (counter cyclical for refit)
24. Four main recommendations to help upgrade the cluster
Issues Being Addressed
Recommendations More Detail On Actions
1 • Gains to be made by sharing • Govt support to upgrade demand
existing expertise
Expand on • Broader scope/mandate/ ambition for MIA
Strengths • Success stories that can be • Increase MIA membership
replicated • Focus expansion on high value:freight areas
• Consolidate the industry (fewer, larger firms)
• Extreme fragmentation
2
• ‘Step-change’ in collaboration championed
Consolidate & • Sub-scale manufacturing
by MIA and industry leaders
Collaborate • Lack of business skills
• Address availability of financing
• Lack of investment, duplication
• Actively seek out FDI
• Leading firms encouraged to diversify
3 • Capabilities exist that could have
activities (including offshore investments)
Expand into applications outside of marine
• Govt matching of investments that broaden
New Areas cluster
scope of cluster into ‘related’ industries
• Actively seek out FDI / JVs
• ‘Open minds’ to the possibility of production
• Cluster is relatively narrow in scope
4
manufacturing out of NZ
• Long-run potential of custom niche is
Move Beyond
• Leading firms to leverage custom
capped (small market)
Custom Boats
capabilities into production manufacturing
• Custom capabilities (e.g. brand) can
translate into production market
For a more comprehensive understanding of all the major
issues and recommendations please see the full written report
25. Main Conclusions
• The New Zealand marine cluster has
overcome geographic distance from key
markets to become world-class within some
niche, high value-add sectors
• These successes need to be leveraged to
build competitiveness across the entire
cluster, and further develop supporting /
supplier industries
However….
• Key macro weaknesses, and major
deficiencies within the national diamond,
are inhibiting the growth of New
Zealand’s marine cluster and the wider
economy – many of these problems are
too large for individual actors… strong
leadership and collaboration will be
necessary if they are to be overcome
27. Extensive consultation with the industry
Interviews Conducted Data Collected
• Seventeen interviews • NZ Macro Data (‘85-’09)
conducted
• Marine Industry Data (‘03-’08)
• To promote free and frank
• Global Data (various)
dialogue we opted to keep the
identity of our interviewees • Other various…
anonymous
27
28. Backup
Issues we observed: New Zealand
Potential Solutions
Key Challenges Facing New Zealand
• More aggressive, creative efforts to
Geographic isolation
1
Endowment
bridge the gap
• Focus on diversifying economy
Currency (NZ$) volatility
Macro 2
• More vocational training; linked to
3 Lagging labour productivity cluster policies
• Launch a new cluster policy,
4 Underdeveloped private sector; cluster policy correcting for previous failures
• Bolster Kiwisaver scheme
5 Underdeveloped capital markets
• Eliminate tax distortions: property
• Remove tax disincentives
Micro Attracting FDI; promoting outward investment
6
• Lift managerial talent
• Link with cluster policy
• Lift skilled immigration
Brain drain
7
• Leverage skilled diaspora
Weak basic infrastructure
8 • Upgrade roads, rail, telco
29. Backup
Strengths we observed: Marine cluster
Core Strengths Of The Cluster Opportunities
Open economy, flexible labour policy
1
Macro • Resources focused on genuinely competitive niches,
firms can more easily hire and fire as needed
Competitive sailing expertise and success • Continued support for competitive
2
sailing; leverage this for the cluster
• Brand champions for NZ
• Actively seek out marine events
• Lift competitiveness of sectors that
3 Local demand conditions
serve local demand; step-change in
• Boat ownership supports cluster’s critical mass even if
consolidation or cooperation
product is imported and high-end demand is absent
• Best practice sharing
A few world-class firms
4
• Encourage more foreign leaders in
Micro • Alloy Yachts, Southern Spars and a few other
the industry to relocate to NZ, and
world-class firms (superyachts, equip/components)
local firms to grow international
connections
• Coordinated effort to leverage
5 Pockets of real innovation
these capabilities beyond marine
e.g. wind farms, aerospace
6 • Bolster apprenticeship training
Skilled (and relatively cheap) labour force
schemes (#’s, quality, consistency)
30. Backup
Issues we observed: Marine cluster
Key Challenges Facing The Cluster Potential Solutions
• Satellite sales offices; web tech
Geographic isolation
1
Endowment • Offshore manufacturing
• Links with tourism
Industry fragmentation • More aggressive collaboration push
2
among smaller firms; expand scope
• Sub-scale manufacturing, capital access, lack of
• Consolidation
business skills, R&D, vulnerability to business cycle
• Supplement custom with production
Limited to custom boats, low volume production
3 manufacturing; e.g. utilize
superyacht capabilities to enter
yachts/launches market
Micro
Skills shortages, skills retention
4 • Step-change in apprenticeship #’s
• Management and commercial skills particularly lacking • ‘A call home’ to NZers overseas
• Dialogue with local banks
Underdeveloped/shallow supporting industries
5
• Seek FDI from foreign clusters
• Capital markets
Infrastructure uncertainties
6 • Develop plan beyond Hobsonville;
strong leadership and clear vision
• Debates about zoning and competing land use have
delayed development in key industry locations
Coordinated response required, led by industry and
strongest firms, supported by government at all levels
31. Factor conditions not bad… some notable
gaps in human capital, infrastructure and finance Overall
Ranking = 19
Factor (Input) Conditions: NZ’s Position 2009
Competitive Disadvantages
Competitive Advantages
Relative to GDP per Capita
Relative to GDP per Capita
1 66
(Low) Brain drain
(Low) Number of procedures required to start a business
1 50
Availability of scientists and engineers
Protection of minority shareholders’ interests
3 44
Quality of electricity supply
Doing Business , Getting Credit Legal rights index (WB )
4 39
Quality of domestic transport network: business
Internet users per 100 population
6 39
Quality of telephone infrastructure
Ease of starting a new business
7 35
Quality of railroad infrastructure
(Low) Burden of customs procedures
7 33
Quality of roads
Doing Business, Paying Taxes (Low) Payments number (WB)
7 31
Mobile telephone subscribers per 100 population
Soundness of banks
8 27
Financial market sophistication
Tertiary enrollment
13 26
Financing through local equity market
Regulation of securities exchanges
13
Domestic credit to private sector
15
Quality of math and science education
17
(Low) Time required to start a business
18
Quality of air transport infrastructure
18
Personal computers per 100 population
19
Quality of port infrastructure
19
Internet access in schools
19
Ease of access to loans
19
Quality of the educational system
22
Change up/down of more
Venture capital availability
23
(Low) Burden of government regulation than 5/10 ranks since 2001
23
Quality of scientific research institutions 31
Note: Rank versus 74 countries overall. New Zealand ranks 25th in 2008 PPP adjusted GDP per capita and 15th in Global Competitiveness
Source: Institute For Strategy and Competitiveness, Harvard University (2009)
32. Some big problems when you look at industry…
x
shallow or non-existent clustering a particular issue Overall
Ranking = 40,26
Supporting/Related & Demand Conditions NZ’s Position 2009
Competitive Disadvantages
Competitive Advantages
Relative to GDP per Capita
Relative to GDP per Capita
Supporting and Related Industry Conditions
Supporting and Related Industry Conditions
65
Local supplier quantity
21
Local supplier quality
56
Extent of cluster policy
Local availability of specialized research and training services 22
51
State of cluster development
44
Local availability of process machinery
42
Extent of collaboration in clusters
28
Availability of latest technologies
Demand Conditions
Demand Conditions
45
7 Government procurement of advanced
Stringency of environmental regulations
20 technology products
Laws relating to ICT
55
20 Government success in ICT promotion
Presence of demanding regulatory standards
27
Buyer sophistication
Change up/down of more
than 5/10 ranks since 2001
32
Note: Rank versus 74 countries overall. New Zealand ranks 25th in 2008 PPP adjusted GDP per capita and 15th in Global Competitiveness
Source: Institute For Strategy and Competitiveness, Harvard University (2009)
33. Overall, good context for rivalry… things to work on:
competitive intensity, FDI, investment incentives Overall
Ranking = 13
Context for Strategy and Rivalry Conditions NZ’s Position 2009
Competitive Disadvantages
Competitive Advantages
Relative to GDP per Capita
Relative to GDP per Capita
64
Quality of competition in the ISP sector
1
Strength of investor protection
56
(Low) Impact of taxation on incentives to work and invest
3
Prevalence of trade barriers
53
Business impact of rules on FDI
5
Strength of auditing and reporting standards
50
Intensity of local competition
6
(Low) Distortive effect of taxes and subsidies on competition
43
FDI and technology transfer
7
(Low) Rigidity of employment
34
(Low) Extent of market dominance (by business groups)
7
Regulatory quality
34
(Low) Tariff rate
8
Effectiveness of antitrust policy
32
Prevalence of foreign ownership
8
Efficacy of corporate boards
26
Pay and productivity
12
Low market disruption from state-owned enterprises
13
Intellectual property protection
13
Restrictions on capital flows
22
Cooperation in labour-employer relations
Change up/down of more
than 5/10 ranks since 2001
33
Note: Rank versus 74 countries overall. New Zealand ranks 25th in 2008 PPP adjusted GDP per capita and 15th in Global Competitiveness
Source: Institute For Strategy and Competitiveness, Harvard University (2009)
34. Context for rivalry may be fine…
-
NZ firms coming up short in practice, however Overall
Ranking = 25
Company Operations and Strategy Conditions NZs Position 2009
Competitive Disadvantages
Competitive Advantages
Relative to GDP per Capita
Relative to GDP per Capita
4 61
Value chain breadth
Reliance on professional management
11 49
Extent of incentive compensation
Willingness to delegate authority
16 41
Nature of competitive advantage
Prevalence of foreign technology licensing
24 33
Company spending on R&D
Extent of marketing
32
Control of international distribution
29
Firm-level technology absorption
29
Breadth of international markets
27
Capacity for innovation
27
Production process sophistication
26
Extent of staff training
26
Extent of regional sales
Change up/down of more
than 5/10 ranks since 2001
34
Note: Rank versus 74 countries overall. New Zealand ranks 25th in 2008 PPP adjusted GDP per capita and 15th in Global Competitiveness
Source: Institute For Strategy and Competitiveness, Harvard University (2009)
35. Impressive macroeconomic policy… spoilt by
worsening interest rate spread Overall
Ranking = 8
Macroeconomic Policy (MP) NZs Position 2009
Competitive Disadvantages
Competitive Advantages
Relative to GDP per Capita
Relative to GDP per Capita
1 45
Interest rate spread
Government surplus/deficit
1
Inflation
9
Government debt
Change up/down of more
than 5/10 ranks since 2001
35
Note: Rank versus 74 countries overall. New Zealand ranks 25th in 2008 PPP adjusted GDP per capita and 15th in Global Competitiveness
Source: Institute For Strategy and Competitiveness, Harvard University (2009)
36. Majority of SIPI world-class… centralization of
Overall
economic policymaking has to be addressed Ranking = 11
Social Infrastructure and Political Institutions NZs Position 2009
Competitive Advantages Competitive Disadvantages
Relative to GDP per Capita Relative to GDP per Capita
(Low) Malaria incidence Decentralization of economic policymaking
1 56
Secondary enrollment (Low) Wastefulness of government spending
1 30
Judicial independence 2
2
(Low occurrence of) Diversion of public funds
2
(Low occurrence of) Irregular payments by firms
2
Ethical behavior of firms
4
(Low impact of) Organized crime
4
(Low) Business costs of corruption Control of Corruption (WB)
5
Rule of Law (WB)
5
Voice and Accountability (WB)
6
Primary enrollment
8
Freedom of the press 9
(Low) Favoritism in decisions of government officials 10
Public trust of politicians 11
Life expectancy 12
Transparency of government policymaking 12
Efficiency of legal framework 13
Property rights 13
Effectiveness of law-making bodies 14
15
Quality of primary education
16
Health expenditure
17
(Low) Tuberculosis incidence Change up/down of more
18
Government effectiveness in reducing poverty and inequality
than 5/10 ranks since 2001
20
Reliability of police services
21
Accessibility of healthcare services
21
(Low) Business costs of crime and violence
22
Quality of healthcare services
22
(Low) Infant mortality
36
Note: Rank versus 74 countries overall. New Zealand ranks 25th in 2008 PPP adjusted GDP per capita and 15th in Global Competitiveness
Source: Institute For Strategy and Competitiveness, Harvard University (2009)