Download to read offline


![6 | Global Insight Weekly
August 24, 2017 | RBC Wealth Management
Authors
Analyst Certification
All of the views expressed in this report accurately reflect the
personal views of the responsible analyst(s) about any and all
of the subject securities or issuers. No part of the compensation
of the responsible analyst(s) named herein is, or will be, directly
or indirectly, related to the specific recommendations or views
expressed by the responsible analyst(s) in this report.
Important Disclosures
In the U.S., RBC Wealth Management operates as a division of RBC
Capital Markets, LLC. In Canada, RBC Wealth Management includes,
without limitation, RBC Dominion Securities Inc., which is a foreign
affiliate of RBC Capital Markets, LLC. This report has been prepared
by RBC Capital Markets, LLC. which is an indirect wholly-owned
subsidiary of the Royal Bank of Canada and, as such, is a related
issuer of Royal Bank of Canada.
Non-U.S. Analyst Disclosure: Diana Di Luca and Yufei Yang, employees
of RBC Wealth Management USA’s foreign affiliate RBC Dominion
Securities Inc.; and Frédérique Carrier and Thomas McGarrity,
employees of RBC Wealth Management USA’s foreign affiliate Royal
Bank of Canada Investment Management (U.K.) Limited; contributed
to the preparation of this publication. These individuals are not
registered with or qualified as research analysts with the U.S.
Financial Industry Regulatory Authority (“FINRA”) and, since they are
not associated persons of RBC Wealth Management, they may not be
subject to FINRA Rule 2241 governing communications with subject
companies, the making of public appearances, and the trading of
securities in accounts held by research analysts.
In the event that this is a compendium report (covers six or more
companies), RBC Wealth Management may choose to provide
important disclosure information by reference. To access current
disclosures, clients should refer to http://www.rbccm.com/
Tom Garretson, CFA – New York, United States
tom.garretson@rbc.com; RBCCapital Markets, LLC
Bill Kuehn – Minneapolis, United States
william.kuehn@rbc.com; RBCCapital Markets, LLC
Sam Renikoff – Minneapolis, United States
sam.renikoff@rbc.com; RBCCapital Markets, LLC
Diana Di Luca – Toronto, Canada
diana.diluca@rbc.com; RBC Dominion Securities Inc.
Frédérique Carrier – London, United Kingdom
frederique.carrier@rbc.com; Royal Bank of Canada Investment Management (U.K.) Ltd.
Thomas McGarrity, CFA – London, United Kingdom
thomas.mcgarrity@rbc.com; Royal Bank of Canada Investment Management (U.K.) Ltd.
Yufei Yang – Hong Kong, China
yufei.yang@rbc.com; RBC Dominion Securities Inc.
D isclosures and Disclaimer
GLDisclosure/PublicWeb/DisclosureLookup.aspx?EntityID=2 to view
disclosures regarding RBC Wealth Management and its affiliated
firms. Such information is also available upon request to RBC Wealth
Management Publishing, 60 South Sixth St, Minneapolis, MN 55402.
References to a Recommended List in the recommendation history
chart may include one or more recommended lists or model
portfolios maintained by RBC Wealth Management or one of its
affiliates. RBC Wealth Management recommended lists include the
Guided Portfolio: Prime Income (RL 6), the Guided Portfolio: Dividend
Growth (RL 8), the Guided Portfolio: ADR (RL 10), and the Guided
Portfolio: All Cap Growth (RL 12), and former lists called the Guided
Portfolio: Large Cap (RL 7), the Guided Portfolio: Midcap 111 (RL 9),
and the Guided Portfolio: Global Equity (U.S.) (RL 11). RBC Capital
Markets recommended lists include the Strategy Focus List and the
Fundamental Equity Weightings (FEW) portfolios. The abbreviation
‘RL On’ means the date a security was placed on a Recommended
List. The abbreviation ‘RL Off’ means the date a security was removed
from a Recommended List.
Distribution of Ratings
For the purpose of ratings distributions, regulatory rules require
member firms to assign ratings to one of three rating categories
- Buy, Hold/Neutral, or Sell - regardless of a firm’s own rating
categories. Although RBC Capital Markets, LLC ratings of Top Pick
(TP)/Outperform (O), Sector Perform (SP) and Underperform (U) most
closely correspond to Buy, Hold/Neutral and Sell, respectively, the
meanings are not the same because our ratings are determined on a
relative basis (as described below).
Explanation of RBC Capital Markets, LLC Equity Rating System
An analyst’s “sector” is the universe of companies for which the
analyst provides research coverage. Accordingly, the rating assigned
to a particular stock represents solely the analyst’s view of how that
stock will perform over the next 12 months relative to the analyst’s
sector average. Although RBC Capital Markets, LLC ratings of Top Pick
(TP)/Outperform (O), Sector Perform (SP), and Underperform (U) most
closely correspond to Buy, Hold/Neutral and Sell, respectively, the
meanings are not the same because our ratings are determined on a
relative basis (as described below).
Ratings:
Top Pick (TP): Represents analyst’s best idea in the sector; expected
to provide significant absolute total return over 12 months with a
favorable risk-reward ratio. Outperform (O): Expected to materially
outperform sector average over 12 months. Sector Perform (SP):
Returns expected to be in line with sector average over 12 months.
Underperform (U): Returns expected to be materially below sector
average over 12 months.
As of June 30, 2017
Rating Count Percent Count Percent
Buy [Top Pick & Outperform] 826 52.01 293 35.47
Hold [Sector Perform] 657 41.37 144 21.92
Sell [Underperform] 105 6.61 7 6.67
Investment Banking Services
Provided During Past 12 Months
Distribution of Ratings - RBC Capital Markets, LLC Equity Research](https://image.slidesharecdn.com/gi-wake8-24-170828153221/75/Global-Insight-Wake-Me-Up-When-September-Begins-6-2048.jpg)


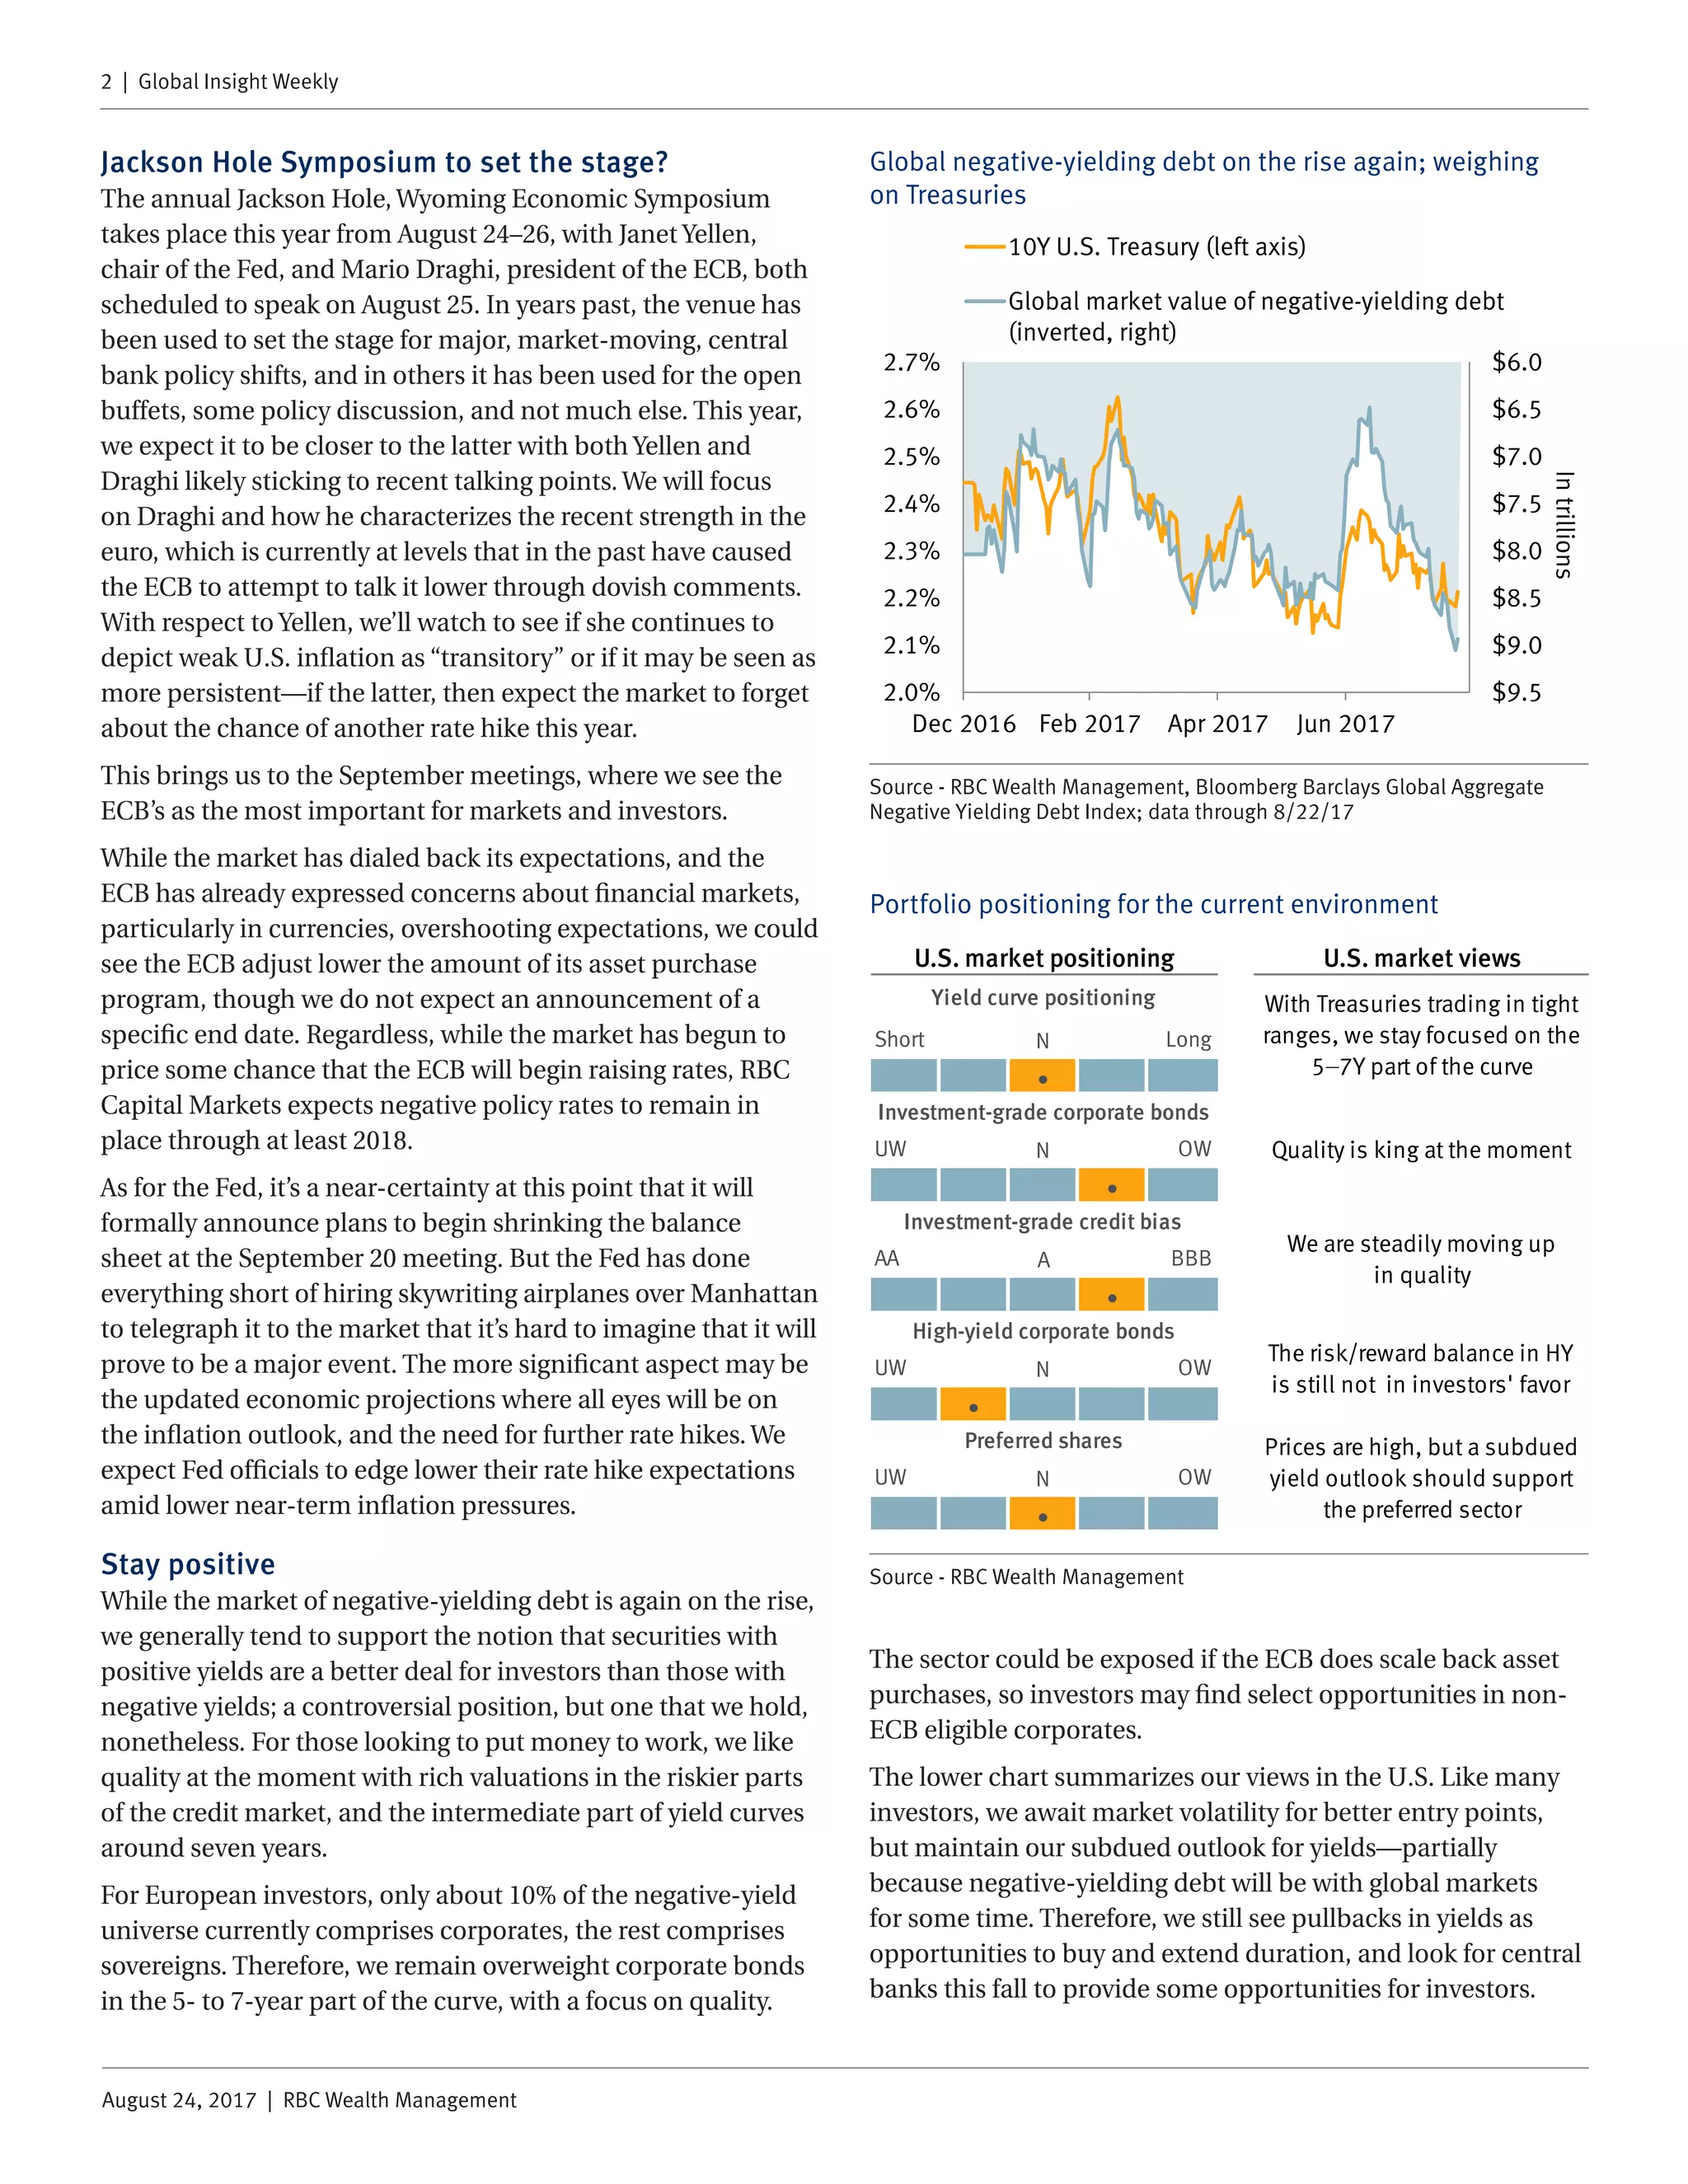
The document provides an overview and analysis of recent developments in global fixed income markets from an investment perspective. It discusses: 1) Low volatility in US Treasury markets with yields holding in a tight range, and the rise in negative-yielding global debt nearing $9 trillion, weighing on Treasuries. 2) Upcoming central bank meetings at Jackson Hole, the ECB, and Fed which may provide opportunities for investors if they cause yields to move. 3) The document recommends a focus on quality corporate bonds in the 5-7 year part of the yield curve for European investors.


