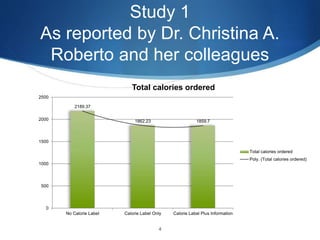
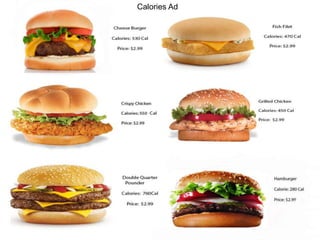
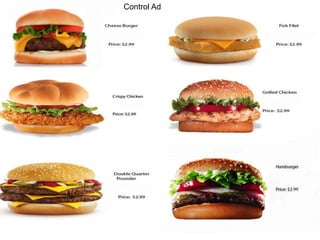
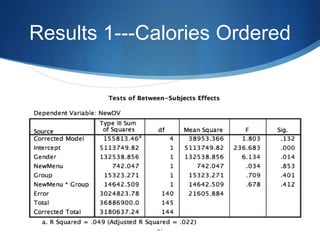
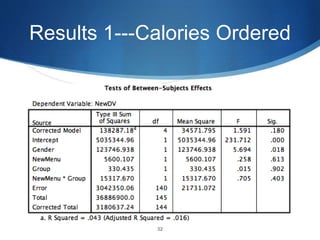
1) A study assessed the impact of calorie labels on menus on food choices and intake, finding that labels led to fewer calories ordered and consumed, and adding a recommended daily calorie amount increased this effect.
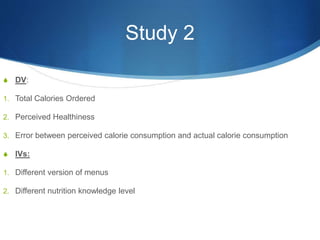
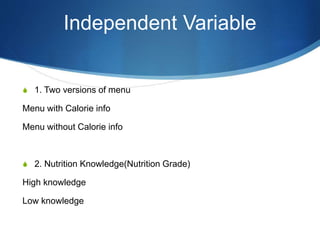
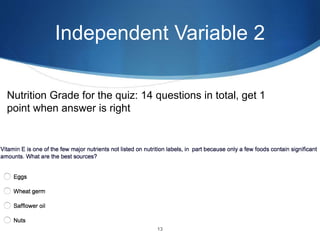
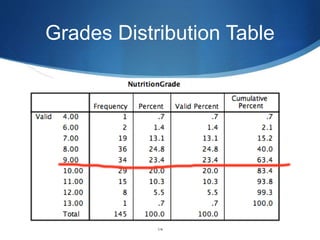
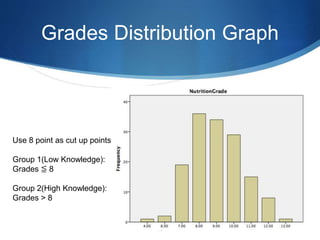
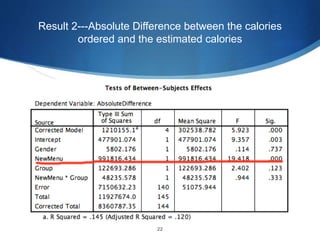
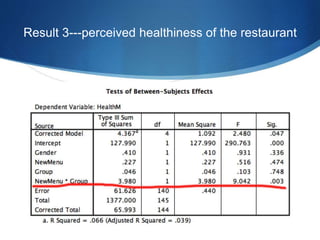
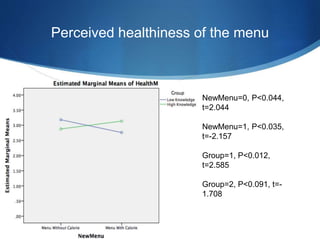
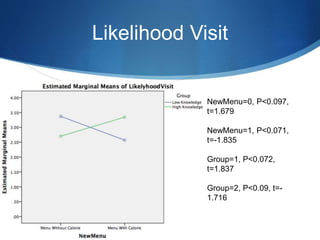
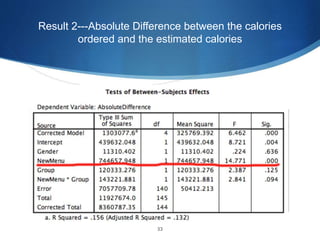
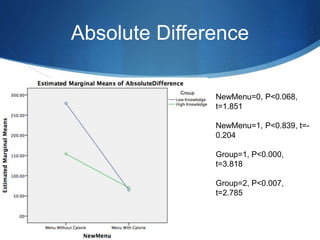
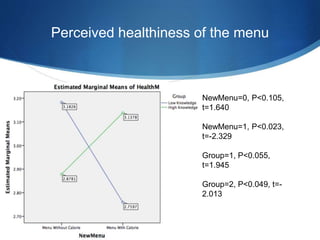
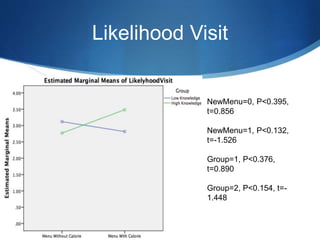
2) A follow up study examined whether the effect varied by nutrition knowledge, hypothesizing high knowledge individuals would be less influenced by calorie labels. It found low knowledge consumers had a larger absolute difference between calories ordered and estimated, perceived menus as less healthy, and were less likely to visit compared to high knowledge consumers.
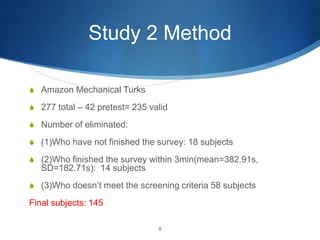
3) Limitations included not tracking actual behavior and potential inattention from online participants.