The document is an overview of the fourth edition of 'Nursing Research: Reading, Using, and Creating Evidence' by Janet Houser, aimed at providing nursing students and professionals with a comprehensive understanding of how to utilize research in clinical practice. It discusses various aspects of nursing research, including the importance of evidence-based practice, ethical considerations, and different types of research methodologies, while also addressing contemporary issues in the field. The text is structured to facilitate understanding for beginners and enhance the research skills of experienced nurses, encouraging active participation in research processes.
![NURSING RESEARCH
READING, USING, AND CREATING EVIDENCE
FOURTH EDITION
JANET HOUSER, PHD, RN
Provost and Professor
Rueckert-Hartman College for Health Professions
Regis University
Denver, Colorado
JONES & BARTLETT
LEARNING
2
World Headquarters
Jones & Bartlett Learning
5 Wall Street
Burlington, MA 01803
978-443-5000
[email protected]
www.jblearning.com
Jones & Bartlett Learning books and products are available
through most
bookstores and online booksellers. To contact Jones & Bartlett
Learning](https://image.slidesharecdn.com/nursingresearchreadingusingandcreatingevidence-221201194343-37b865eb/85/NURSING-RESEARCHREADING-USING-AND-CREATING-EVIDENCE-docx-1-320.jpg)
![NURSING RESEARCH
READING, USING, AND CREATING EVIDENCE
FOURTH EDITION
JANET HOUSER, PHD, RN
Provost and Professor
Rueckert-Hartman College for Health Professions
Regis University
Denver, Colorado
JONES & BARTLETT
LEARNING
2
World Headquarters
Jones & Bartlett Learning
5 Wall Street
Burlington, MA 01803
978-443-5000
[email protected]
www.jblearning.com
Jones & Bartlett Learning books and products are available
through most
bookstores and online booksellers. To contact Jones & Bartlett
Learning](https://image.slidesharecdn.com/nursingresearchreadingusingandcreatingevidence-221201194343-37b865eb/75/NURSING-RESEARCHREADING-USING-AND-CREATING-EVIDENCE-docx-1-2048.jpg)
![directly, call 800-832-0034, fax 978-443-8000, or visit our
website,
www.jblearning.com.
Substantial discounts on bulk quantities of Jones & Bartlett
Learning
publications are available to corporations, professional
associations, and
other qualified organizations. For details and specific discount
information,
contact the special sales department at Jones & Bartlett
Learning via the
above contact information or send an email to
[email protected]
Copyright © 2018 by Jones & Bartlett Learning, LLC, an
Ascend Learning
Company
All rights reserved. No part of the material protected by this
copyright may be
reproduced or utilized in any form, electronic or mechanical,
including
photocopying, recording, or by any information storage and
retrieval system,
without written permission from the copyright owner.
The content, statements, views, and opinions herein are the sole
expression of
the respective authors and not that of Jones & Bartlett Learning,
LLC.
Reference herein to any specific commercial product, process,
or service by
trade name, trademark, manufacturer, or otherwise does not
constitute or
imply its endorsement or recommendation by Jones & Bartlett
Learning, LLC](https://image.slidesharecdn.com/nursingresearchreadingusingandcreatingevidence-221201194343-37b865eb/85/NURSING-RESEARCHREADING-USING-AND-CREATING-EVIDENCE-docx-2-320.jpg)
![Cover Design: Scott Moden
Rights & Media Specialist: Wes DeShano
Media Development Editor: Troy Liston
Cover Image: © Valentina Razumova/Shutterstock
Printing and Binding: LSC Communications
Cover Printing: LSC Communications
Library of Congress Cataloging-in-Publication Data
Names: Houser, Janet, 1954- author.
Title: Nursing research : reading, using, and creating evidence /
Janet Houser.
Description: Fourth edition. | Burlington, Massachusetts : Jones
& Bartlett
Learning, [2018] | Includes bibliographical references and
index.
Identifiers: LCCN 2016038194 | ISBN 9781284110043
Subjects: | MESH: Clinical Nursing Research--methods |
Evidence-Based
4
Nursing | Research Design
Classification: LCC RT81.5 | NLM WY 20.5 | DDC 610.73072--
dc23
LC record available at https://lccn.loc.gov/2016038194
6048
Printed in the United States of America
20 19 18 17 16 10 9 8 7 6 5 4 3 2 1
5](https://image.slidesharecdn.com/nursingresearchreadingusingandcreatingevidence-221201194343-37b865eb/85/NURSING-RESEARCHREADING-USING-AND-CREATING-EVIDENCE-docx-5-320.jpg)
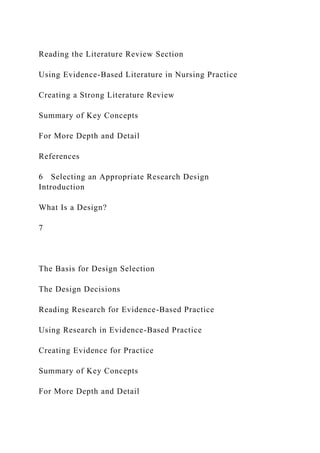
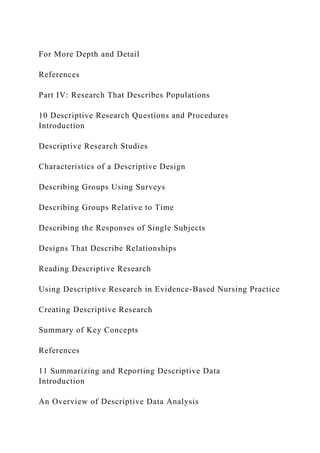
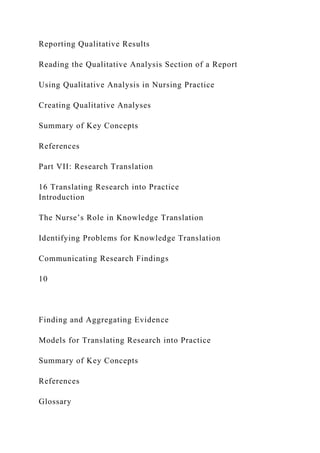
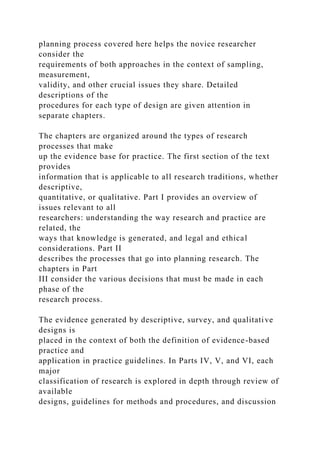
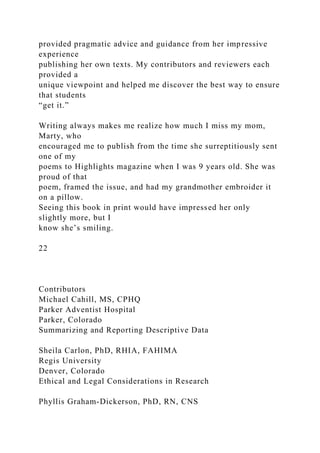
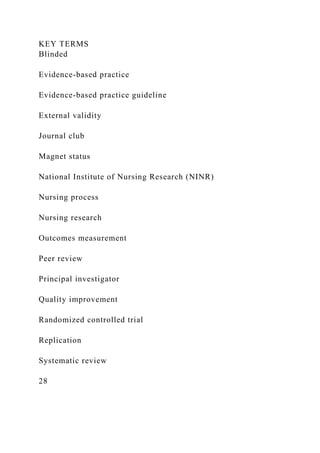
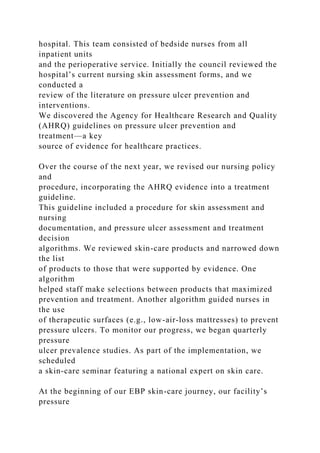
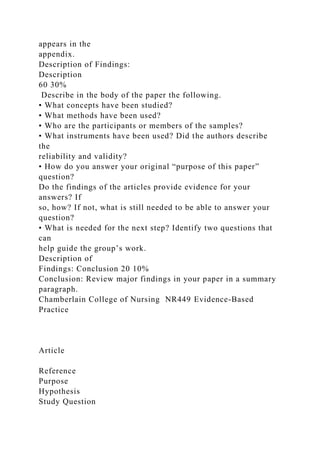
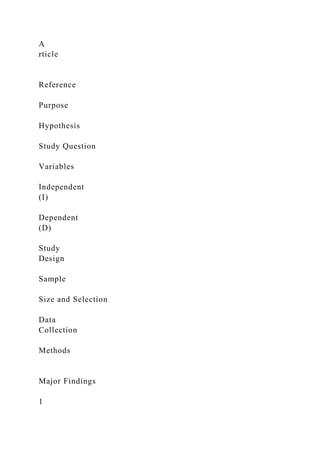
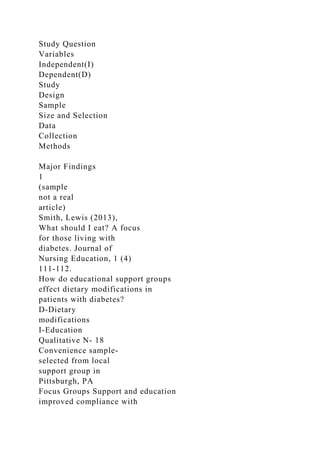
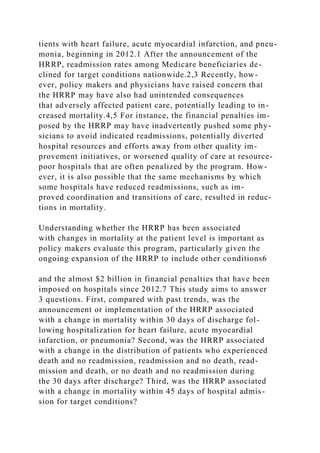
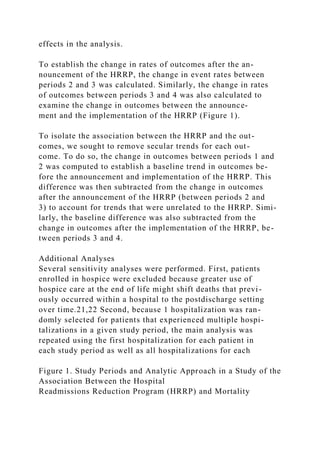
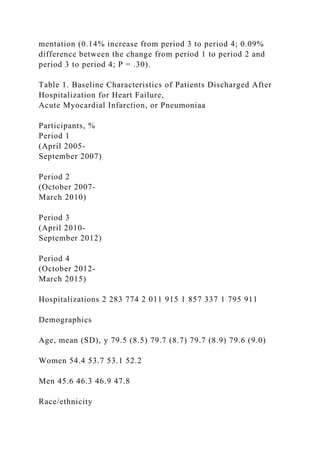
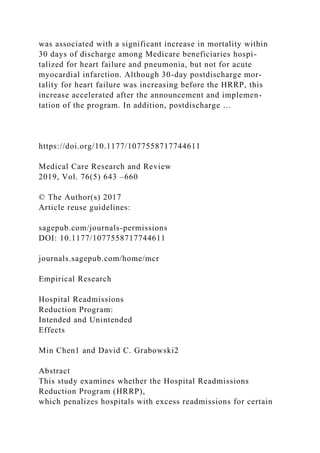
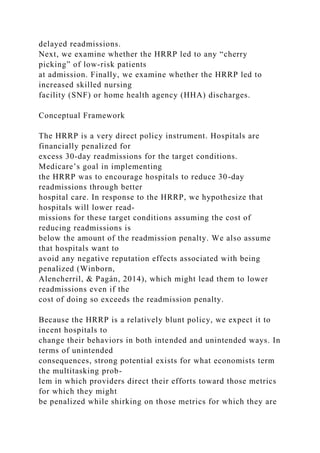
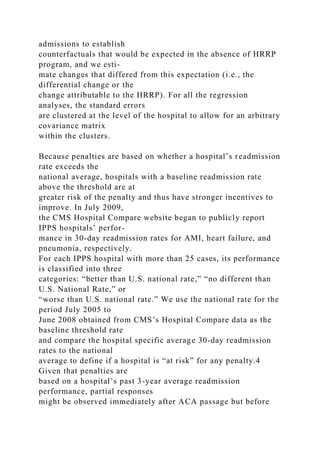
![EXPOSURES Announcement and implementation of the HRRP.
MAIN OUTCOMES AND MEASURES Inverse probability–
weighted mortality within 30 days of
discharge following hospitalization for HF, AMI, and
pneumonia, and stratified by whether
there was an associated readmission. An additional end point
was mortality within 45 days of
initial hospital admission for target conditions.
RESULTS The study cohort included 8.3 million
hospitalizations for HF, AMI, and pneumonia,
among which 7.9 million (mean age, 79.6 [8.7] years; 53.4%
women) were alive at discharge.
There were 3.2 million hospitalizations for HF, 1.8 million for
AMI, and 3.0 million for pneumonia.
There were 270 517 deaths within 30 days of discharge for HF,
128 088 for AMI, and 246 154 for
pneumonia. Among patients with HF, 30-day postdischarge
mortality increased before the
announcement of the HRRP (0.27% increase from period 1 to
period 2). Compared with this
baseline trend, HRRP announcement (0.49% increase from
period 2 to period 3; difference in
change, 0.22%, P = .01) and implementation (0.52% increase
from period 3 to period 4;
difference in change, 0.25%, P = .001) were significantly
associated with an increase in
postdischarge mortality. Among patients with AMI, HRRP
announcement was associated with a
decline in postdischarge mortality (0.18% pre-HRRP increase vs
0.08% post-HRRP
announcement decrease; difference in change, −0.26%; P = .01)
and did not significantly change
after HRRP implementation. Among patients with pneumonia,](https://image.slidesharecdn.com/nursingresearchreadingusingandcreatingevidence-221201194343-37b865eb/85/NURSING-RESEARCHREADING-USING-AND-CREATING-EVIDENCE-docx-36-320.jpg)
![Corresponding Authors: Robert W.
Yeh, MD, MSc, and Changyu Shen,
PhD, Smith Center for Outcomes
Research in Cardiology, Beth Israel
Deaconess Medical Center, 375
Longwood Ave, Boston, MA 02215
([email protected]).
Research
JAMA | Original Investigation
2542 (Reprinted) jama.com
© 2018 American Medical Association. All rights reserved.
https://jama.jamanetwork.com/article.aspx?doi=10.1001/jama.2
018.19232&utm_campaign=articlePDF%26utm_medium=article
PDFlink%26utm_source=articlePDF%26utm_content=jama.2018
.19232
https://jama.jamanetwork.com/article.aspx?doi=10.1001/jama.2
018.19325&utm_campaign=articlePDF%26utm_medium=article
PDFlink%26utm_source=articlePDF%26utm_content=jama.2018
.19232
mailto:[email protected]
http://www.jama.com/?utm_campaign=articlePDF%26utm_medi
um=articlePDFlink%26utm_source=articlePDF%26utm_content
=jama.2018.19232
T he Hospital Readmissions Reduction Program (HRRP)was
established under the Affordable Care Act (ACA) in2010 and
required that the Centers for Medicare & Med-
icaid Services (CMS) impose financial penalties on hospitals
with higher-than-expected 30-day readmission rates for pa-](https://image.slidesharecdn.com/nursingresearchreadingusingandcreatingevidence-221201194343-37b865eb/85/NURSING-RESEARCHREADING-USING-AND-CREATING-EVIDENCE-docx-38-320.jpg)
![Min Chen, College of Business, Florida International
University, 11200 SW 8th Street,
Miami, FL 33199, USA.
Email: [email protected]
744611MCRXXX10.1177/1077558717744611Medical Care
Research and ReviewChen and Grabowski
research-article2017
https://us.sagepub.com/en-us/journals-permissions
https://journals.sagepub.com/home/mcr
mailto:[email protected]
http://crossmark.crossref.org/dialog/?doi=10.1177%2F10775587
17744611&domain=pdf&date_stamp=2017-12-03
644 Medical Care Research and Review 76(5)
Introduction
Hospital readmissions are common and costly. In 2011, the U.S.
Medicare program
paid for 1.8 million 30-day readmissions with a total cost of $24
billion (Hines, Barrett,
Marguerit, Jiang, Joanna, & Steiner, 2014). Some readmissions
could be prevented
with better quality of care (Axon & Williams, 2011), and the
Medicare Payment
Advisory Commission (MedPAC) estimates that a 10%
reduction in avoidable read-
missions would save the Medicare program at least $1 billion
(MedPAC, 2013). To
achieve both better outcomes for patients and greater savings
for Medicare, the
Affordable Care Act (ACA) created the Hospital Readmissions
Reduction Program](https://image.slidesharecdn.com/nursingresearchreadingusingandcreatingevidence-221201194343-37b865eb/85/NURSING-RESEARCHREADING-USING-AND-CREATING-EVIDENCE-docx-58-320.jpg)
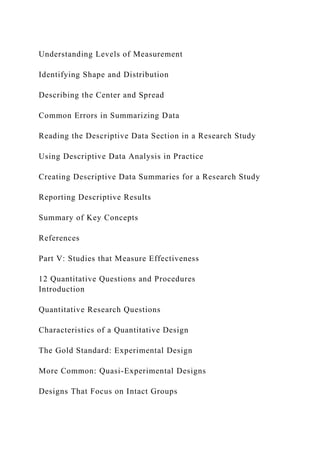
![n
30
d
ay
s
0.
16
[
0.
37
]
0.
18
[
0.
38
]
0.
23
[
0.
42
]
0.](https://image.slidesharecdn.com/nursingresearchreadingusingandcreatingevidence-221201194343-37b865eb/85/NURSING-RESEARCHREADING-USING-AND-CREATING-EVIDENCE-docx-75-320.jpg)
![16
[
0.
37
]
0.
19
[
0.
39
]
0.
05
[
0.
25
]
0.
13
[
0.
34
]](https://image.slidesharecdn.com/nursingresearchreadingusingandcreatingevidence-221201194343-37b865eb/85/NURSING-RESEARCHREADING-USING-AND-CREATING-EVIDENCE-docx-76-320.jpg)
![R
ea
dm
it
te
d
w
it
hi
n
31
-4
5
da
ys
0.
03
[
0.
17
]
0.
03
[
0.](https://image.slidesharecdn.com/nursingresearchreadingusingandcreatingevidence-221201194343-37b865eb/85/NURSING-RESEARCHREADING-USING-AND-CREATING-EVIDENCE-docx-77-320.jpg)
![17
]
0.
05
[
0.
21
]
0.
03
[
0.
17
]
0.
04
[
0.
20
]
0.
01
[
0.](https://image.slidesharecdn.com/nursingresearchreadingusingandcreatingevidence-221201194343-37b865eb/85/NURSING-RESEARCHREADING-USING-AND-CREATING-EVIDENCE-docx-78-320.jpg)
![12
]
0.
03
[
0.
16
]
R
ea
dm
it
te
d
w
it
hi
n
31
-6
0
da
ys](https://image.slidesharecdn.com/nursingresearchreadingusingandcreatingevidence-221201194343-37b865eb/85/NURSING-RESEARCHREADING-USING-AND-CREATING-EVIDENCE-docx-79-320.jpg)
![0.
05
[
0.
22
]
0.
05
[
0.
21
]
0.
08
[
0.
27
]
0.
05
[
0.
22
]](https://image.slidesharecdn.com/nursingresearchreadingusingandcreatingevidence-221201194343-37b865eb/85/NURSING-RESEARCHREADING-USING-AND-CREATING-EVIDENCE-docx-80-320.jpg)
![0.
07
[
0.
25
]
0.
02
[
0.
15
]
0.
05
[
0.
21
]
D
is
ch
ar
ge](https://image.slidesharecdn.com/nursingresearchreadingusingandcreatingevidence-221201194343-37b865eb/85/NURSING-RESEARCHREADING-USING-AND-CREATING-EVIDENCE-docx-81-320.jpg)
![d
to
S
N
F
0.
17
[
0.
37
]
0.
13
[
0.
33
]
0.
17
[
0.
37
]
0.](https://image.slidesharecdn.com/nursingresearchreadingusingandcreatingevidence-221201194343-37b865eb/85/NURSING-RESEARCHREADING-USING-AND-CREATING-EVIDENCE-docx-82-320.jpg)
![17
[
0.
38
]
0.
12
[
0.
32
]
0.
39
[
0.
49
]
0.
09
[
0.
29
]](https://image.slidesharecdn.com/nursingresearchreadingusingandcreatingevidence-221201194343-37b865eb/85/NURSING-RESEARCHREADING-USING-AND-CREATING-EVIDENCE-docx-83-320.jpg)
![D
is
ch
ar
ge
d
to
H
H
A
0.
22
[
0.
41
]
0.
16
[
0.
37
]
0.
25](https://image.slidesharecdn.com/nursingresearchreadingusingandcreatingevidence-221201194343-37b865eb/85/NURSING-RESEARCHREADING-USING-AND-CREATING-EVIDENCE-docx-84-320.jpg)
![[
0.
43
]
0.
18
[
0.
38
]
0.
20
[
0.
40
]
0.
45
[
0.
50
]
0.
13](https://image.slidesharecdn.com/nursingresearchreadingusingandcreatingevidence-221201194343-37b865eb/85/NURSING-RESEARCHREADING-USING-AND-CREATING-EVIDENCE-docx-85-320.jpg)
![[
0.
33
]
Pa
ti
en
t
ch
ar
ac
te
ri
st
ic
s
A
ge
(
65
-7
4](https://image.slidesharecdn.com/nursingresearchreadingusingandcreatingevidence-221201194343-37b865eb/85/NURSING-RESEARCHREADING-USING-AND-CREATING-EVIDENCE-docx-86-320.jpg)
![ye
ar
s)
0.
29
[
0.
45
]
0.
29
[
0.
46
]
0.
24
[
0.
43
]
0.
25
[](https://image.slidesharecdn.com/nursingresearchreadingusingandcreatingevidence-221201194343-37b865eb/85/NURSING-RESEARCHREADING-USING-AND-CREATING-EVIDENCE-docx-87-320.jpg)
![0.
43
]
0.
38
[
0.
49
]
0.
39
[
0.
49
]
0.
26
[
0.
44
]
A
ge](https://image.slidesharecdn.com/nursingresearchreadingusingandcreatingevidence-221201194343-37b865eb/85/NURSING-RESEARCHREADING-USING-AND-CREATING-EVIDENCE-docx-88-320.jpg)
![(
75
-8
5
ye
ar
s)
0.
30
[
0.
46
]
0.
28
[
0.
45
]
0.
36
[
0.
48](https://image.slidesharecdn.com/nursingresearchreadingusingandcreatingevidence-221201194343-37b865eb/85/NURSING-RESEARCHREADING-USING-AND-CREATING-EVIDENCE-docx-89-320.jpg)
![]
0.
31
[
0.
46
]
0.
35
[
0.
48
]
0.
28
[
0.
45
]
0.
27
[
0.
44](https://image.slidesharecdn.com/nursingresearchreadingusingandcreatingevidence-221201194343-37b865eb/85/NURSING-RESEARCHREADING-USING-AND-CREATING-EVIDENCE-docx-90-320.jpg)
![]
A
ge
(
≥8
5
ye
ar
s)
0.
20
[
0.
40
]
0.
19
[
0.
39
]
0.
33](https://image.slidesharecdn.com/nursingresearchreadingusingandcreatingevidence-221201194343-37b865eb/85/NURSING-RESEARCHREADING-USING-AND-CREATING-EVIDENCE-docx-91-320.jpg)
![[
0.
47
]
0.
25
[
0.
43
]
0.
17
[
0.
38
]
0.
09
[
0.
29
]
0.
16](https://image.slidesharecdn.com/nursingresearchreadingusingandcreatingevidence-221201194343-37b865eb/85/NURSING-RESEARCHREADING-USING-AND-CREATING-EVIDENCE-docx-92-320.jpg)
![[
0.
37
]
Fe
m
al
e
0.
55
[
0.
50
]
0.
41
[
0.
49
]
0.
49
[](https://image.slidesharecdn.com/nursingresearchreadingusingandcreatingevidence-221201194343-37b865eb/85/NURSING-RESEARCHREADING-USING-AND-CREATING-EVIDENCE-docx-93-320.jpg)
![0.
50
]
0.
53
[
0.
50
]
0.
57
[
0.
49
]
0.
61
[
0.
49
]
0.
60
[](https://image.slidesharecdn.com/nursingresearchreadingusingandcreatingevidence-221201194343-37b865eb/85/NURSING-RESEARCHREADING-USING-AND-CREATING-EVIDENCE-docx-94-320.jpg)
![0.
49
]
R
ac
e
W
hi
te
0.
78
[
0.
41
]
0.
78
[
0.
42
]
0.](https://image.slidesharecdn.com/nursingresearchreadingusingandcreatingevidence-221201194343-37b865eb/85/NURSING-RESEARCHREADING-USING-AND-CREATING-EVIDENCE-docx-95-320.jpg)
![74
[
0.
44
]
0.
77
[
0.
42
]
0.
81
[
0.
39
]
0.
86
[
0.
35
]
0.](https://image.slidesharecdn.com/nursingresearchreadingusingandcreatingevidence-221201194343-37b865eb/85/NURSING-RESEARCHREADING-USING-AND-CREATING-EVIDENCE-docx-96-320.jpg)
![76
[
0.
43
]
B
la
ck
0.
09
[
0.
28
]
0.
07
[
0.
26
]
0.
12](https://image.slidesharecdn.com/nursingresearchreadingusingandcreatingevidence-221201194343-37b865eb/85/NURSING-RESEARCHREADING-USING-AND-CREATING-EVIDENCE-docx-97-320.jpg)
![[
0.
33
]
0.
09
[
0.
29
]
0.
07
[
0.
25
]
0.
06
[
0.
23
]
0.
10](https://image.slidesharecdn.com/nursingresearchreadingusingandcreatingevidence-221201194343-37b865eb/85/NURSING-RESEARCHREADING-USING-AND-CREATING-EVIDENCE-docx-98-320.jpg)
![[
0.
30
]
H
is
pa
ni
c
0.
10
[
0.
30
]
0.
10
[
0.
30
]
0.
10](https://image.slidesharecdn.com/nursingresearchreadingusingandcreatingevidence-221201194343-37b865eb/85/NURSING-RESEARCHREADING-USING-AND-CREATING-EVIDENCE-docx-99-320.jpg)
![[
0.
30
]
0.
11
[
0.
31
]
0.
11
[
0.
31
]
0.
06
[
0.
24
]
0.
11](https://image.slidesharecdn.com/nursingresearchreadingusingandcreatingevidence-221201194343-37b865eb/85/NURSING-RESEARCHREADING-USING-AND-CREATING-EVIDENCE-docx-100-320.jpg)
![[
0.
31
]
O
th
er
r
ac
e
0.
03
[
0.
18
]
0.
04
[
0.
21
]](https://image.slidesharecdn.com/nursingresearchreadingusingandcreatingevidence-221201194343-37b865eb/85/NURSING-RESEARCHREADING-USING-AND-CREATING-EVIDENCE-docx-101-320.jpg)
![0.
03
[
0.
17
]
0.
03
[
0.
18
]
0.
01
[
0.
12
]
0.
03
[
0.
16
]](https://image.slidesharecdn.com/nursingresearchreadingusingandcreatingevidence-221201194343-37b865eb/85/NURSING-RESEARCHREADING-USING-AND-CREATING-EVIDENCE-docx-102-320.jpg)
![0.
04
[
0.
19
]
M
ed
ia
n
ho
us
eh
o
ld
in
co
m
e
Q
ua
rt](https://image.slidesharecdn.com/nursingresearchreadingusingandcreatingevidence-221201194343-37b865eb/85/NURSING-RESEARCHREADING-USING-AND-CREATING-EVIDENCE-docx-103-320.jpg)
![ile
1
0.
34
[
0.
47
]
0.
34
[
0.
47
]
0.
37
[
0.
48
]
0.
35
[
0.](https://image.slidesharecdn.com/nursingresearchreadingusingandcreatingevidence-221201194343-37b865eb/85/NURSING-RESEARCHREADING-USING-AND-CREATING-EVIDENCE-docx-104-320.jpg)
![48
]
0.
40
[
0.
49
]
0.
28
[
0.
45
]
0.
33
[
0.
47
]
Q
ua
rt](https://image.slidesharecdn.com/nursingresearchreadingusingandcreatingevidence-221201194343-37b865eb/85/NURSING-RESEARCHREADING-USING-AND-CREATING-EVIDENCE-docx-105-320.jpg)
![ile
2
0.
33
[
0.
47
]
0.
33
[
0.
47
]
0.
33
[
0.
47
]
0.
33
[
0.](https://image.slidesharecdn.com/nursingresearchreadingusingandcreatingevidence-221201194343-37b865eb/85/NURSING-RESEARCHREADING-USING-AND-CREATING-EVIDENCE-docx-106-320.jpg)
![47
]
0.
33
[
0.
47
]
0.
34
[
0.
47
]
0.
33
[
0.
47
]
Q
ua](https://image.slidesharecdn.com/nursingresearchreadingusingandcreatingevidence-221201194343-37b865eb/85/NURSING-RESEARCHREADING-USING-AND-CREATING-EVIDENCE-docx-107-320.jpg)
![rt
ile
3
0.
24
[
0.
42
]
0.
23
[
0.
42
]
0.
22
[
0.
41
]
0.
23
[](https://image.slidesharecdn.com/nursingresearchreadingusingandcreatingevidence-221201194343-37b865eb/85/NURSING-RESEARCHREADING-USING-AND-CREATING-EVIDENCE-docx-108-320.jpg)
![0.
42
]
0.
21
[
0.
41
]
0.
27
[
0.
44
]
0.
24
[
0.
43
]
Q
ua](https://image.slidesharecdn.com/nursingresearchreadingusingandcreatingevidence-221201194343-37b865eb/85/NURSING-RESEARCHREADING-USING-AND-CREATING-EVIDENCE-docx-109-320.jpg)
![rt
ile
4
0.
09
[
0.
29
]
0.
09
[
0.
29
]
0.
08
[
0.
26
]
0.
09
[](https://image.slidesharecdn.com/nursingresearchreadingusingandcreatingevidence-221201194343-37b865eb/85/NURSING-RESEARCHREADING-USING-AND-CREATING-EVIDENCE-docx-110-320.jpg)
![0.
28
]
0.
06
[
0.
24
]
0.
11
[
0.
32
]
0.
09
[
0.
29
]
Li
vi](https://image.slidesharecdn.com/nursingresearchreadingusingandcreatingevidence-221201194343-37b865eb/85/NURSING-RESEARCHREADING-USING-AND-CREATING-EVIDENCE-docx-111-320.jpg)
![ng
lo
ca
ti
o
n
R
ur
al
a
re
a
0.
06
[
0.
23
]
0.
06
[
0.
24](https://image.slidesharecdn.com/nursingresearchreadingusingandcreatingevidence-221201194343-37b865eb/85/NURSING-RESEARCHREADING-USING-AND-CREATING-EVIDENCE-docx-112-320.jpg)
![]
0.
06
[
0.
23
]
0.
06
[
0.
23
]
0.
08
[
0.
28
]
0.
06
[
0.
24](https://image.slidesharecdn.com/nursingresearchreadingusingandcreatingevidence-221201194343-37b865eb/85/NURSING-RESEARCHREADING-USING-AND-CREATING-EVIDENCE-docx-113-320.jpg)
![]
0.
05
[
0.
22
]
U
rb
an
a
re
a
0.
94
[
0.
23
]
0.
94
[](https://image.slidesharecdn.com/nursingresearchreadingusingandcreatingevidence-221201194343-37b865eb/85/NURSING-RESEARCHREADING-USING-AND-CREATING-EVIDENCE-docx-114-320.jpg)
![0.
24
]
0.
94
[
0.
23
]
0.
94
[
0.
23
]
0.
92
[
0.
28
]
0.
94
[](https://image.slidesharecdn.com/nursingresearchreadingusingandcreatingevidence-221201194343-37b865eb/85/NURSING-RESEARCHREADING-USING-AND-CREATING-EVIDENCE-docx-115-320.jpg)
![0.
24
]
0.
95
[
0.
22
]
Pr
im
ar
y
pa
ye
r
Fe
e
fo
r
se
rv](https://image.slidesharecdn.com/nursingresearchreadingusingandcreatingevidence-221201194343-37b865eb/85/NURSING-RESEARCHREADING-USING-AND-CREATING-EVIDENCE-docx-116-320.jpg)
![ic
e
0.
54
[
0.
50
]
0.
49
[
0.
50
]
0.
66
[
0.
47
]
0.
59
[
0.](https://image.slidesharecdn.com/nursingresearchreadingusingandcreatingevidence-221201194343-37b865eb/85/NURSING-RESEARCHREADING-USING-AND-CREATING-EVIDENCE-docx-117-320.jpg)
![49
]
0.
62
[
0.
49
]
0.
52
[
0.
50
]
0.
46
[
0.
50
]
M
ed
ic](https://image.slidesharecdn.com/nursingresearchreadingusingandcreatingevidence-221201194343-37b865eb/85/NURSING-RESEARCHREADING-USING-AND-CREATING-EVIDENCE-docx-118-320.jpg)
![ar
e
A
dv
an
ta
ge
0.
22
[
0.
41
]
0.
24
[
0.
43
]
0.
25
[
0.
43](https://image.slidesharecdn.com/nursingresearchreadingusingandcreatingevidence-221201194343-37b865eb/85/NURSING-RESEARCHREADING-USING-AND-CREATING-EVIDENCE-docx-119-320.jpg)
![]
0.
19
[
0.
39
]
0.
26
[
0.
44
]
0.
20
[
0.
40
]
0.
21
[
0.
41](https://image.slidesharecdn.com/nursingresearchreadingusingandcreatingevidence-221201194343-37b865eb/85/NURSING-RESEARCHREADING-USING-AND-CREATING-EVIDENCE-docx-120-320.jpg)
![]
Pr
iv
at
e
in
su
ra
nc
e
0.
24
[
0.
43
]
0.
27
[
0.
44
]
0.](https://image.slidesharecdn.com/nursingresearchreadingusingandcreatingevidence-221201194343-37b865eb/85/NURSING-RESEARCHREADING-USING-AND-CREATING-EVIDENCE-docx-121-320.jpg)
![09
[
0.
29
]
0.
22
[
0.
41
]
0.
12
[
0.
32
]
0.
28
[
0.
45
]
0.](https://image.slidesharecdn.com/nursingresearchreadingusingandcreatingevidence-221201194343-37b865eb/85/NURSING-RESEARCHREADING-USING-AND-CREATING-EVIDENCE-docx-122-320.jpg)
![33
[
0.
47
]
T
o
ta
l n
um
be
r
o
f
co
m
o
rb
id
it
ie
s
2.
92
[](https://image.slidesharecdn.com/nursingresearchreadingusingandcreatingevidence-221201194343-37b865eb/85/NURSING-RESEARCHREADING-USING-AND-CREATING-EVIDENCE-docx-123-320.jpg)
![1.
89
]
2.
77
[
1.
78
]
3.
56
[
1.
79
]
3.
55
[
2.
04
]
2.
83
[](https://image.slidesharecdn.com/nursingresearchreadingusingandcreatingevidence-221201194343-37b865eb/85/NURSING-RESEARCHREADING-USING-AND-CREATING-EVIDENCE-docx-124-320.jpg)
![1.
77
]
2.
22
[
1.
58
]
2.
72
[
1.
90
]
H
ig
h
se
ve
ri
ty
(](https://image.slidesharecdn.com/nursingresearchreadingusingandcreatingevidence-221201194343-37b865eb/85/NURSING-RESEARCHREADING-USING-AND-CREATING-EVIDENCE-docx-125-320.jpg)
![19
[
0.
39
]
0.
17
[
0.
38
]
0.
30
[
0.
46
]
0.
26
[
0.
44
]
0.](https://image.slidesharecdn.com/nursingresearchreadingusingandcreatingevidence-221201194343-37b865eb/85/NURSING-RESEARCHREADING-USING-AND-CREATING-EVIDENCE-docx-127-320.jpg)
![32
[
0.
47
]
0.
05
[
0.
22
]
0.
15
[
0.
36
]
N
95
1,
21
5
10](https://image.slidesharecdn.com/nursingresearchreadingusingandcreatingevidence-221201194343-37b865eb/85/NURSING-RESEARCHREADING-USING-AND-CREATING-EVIDENCE-docx-128-320.jpg)