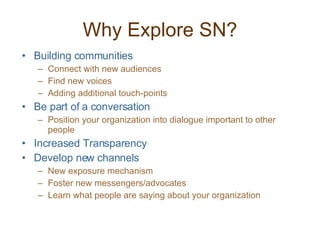
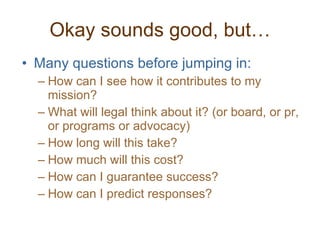
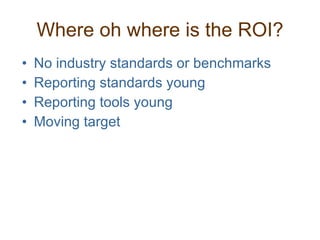
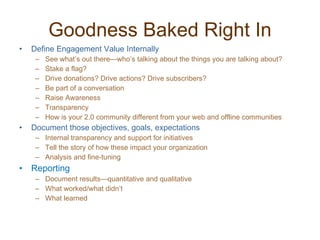
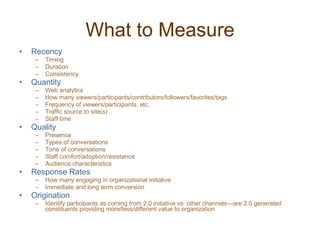
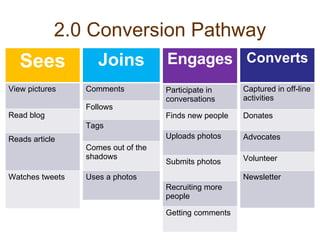
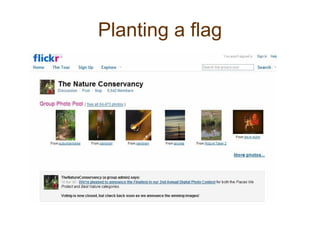
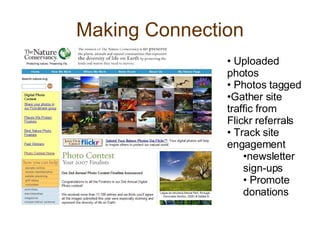
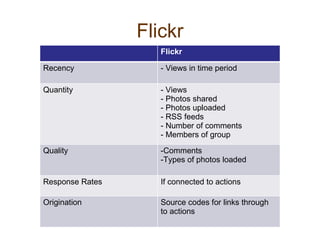
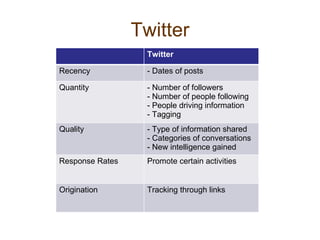
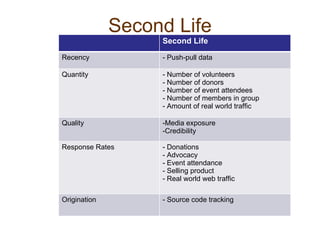
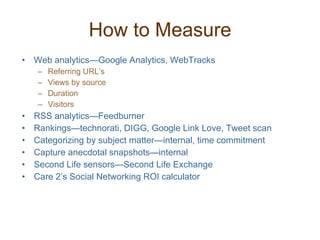
Abby Sandlin, Charity Dynamics On the hunt for shiny objects
Why Explore SN? Building communities Connect with new audiences Find new voices Adding additional touch-points Be part of a conversation Position your organization into dialogue important to other people Increased Transparency Develop new channels New exposure mechanism Foster new messengers/advocates Learn what people are saying about your organization
Okay sounds good, but… Many questions before jumping in: How can I see how it contributes to my mission? What will legal think about it? (or board, or pr, or programs or advocacy) How long will this take? How much will this cost? How can I guarantee success?  How can I predict responses?
Where oh where is the ROI? No industry standards or benchmarks Reporting standards young Reporting tools young Moving target
Goodness Baked Right In Define Engagement Value Internally See what’s out there—who’s talking about the things you are talking about? Stake a flag? Drive donations? Drive actions? Drive subscribers? Be part of a conversation Raise Awareness Transparency How is your 2.0 community different from your web and offline communities Document those objectives, goals, expectations Internal transparency and support for initiatives Tell the story of how these impact your organization Analysis and fine-tuning Reporting Document results—quantitative and qualitative What worked/what didn’t What learned
What to Measure Recency Timing Duration Consistency Quantity Web analytics How many viewers/participants/contributors/followers/favorites/tags Frequency of viewers/participants, etc. Traffic source to site(s) Staff time Quality Presence Types of conversations Tone of conversations Staff comfort/adoption/resistance Audience characteristics Response Rates How many engaging in organizational initiative Immediate and long term conversion Origination Identify participants as coming from 2.0 initiative vs. other channels—are 2.0 generated constituents providing more/less/different value to organization
2.0 Conversion Pathway Joins Sees View pictures Read blog Reads article Watches tweets Joins Comments Follows Tags Comes out of the shadows Uses a photos Engages Participate in conversations Finds new people Uploads photos Submits photos Recruiting more people Getting comments Converts Captured in off-line activities Donates Advocates Volunteer Newsletter
Planting a flag
Making Connection Uploaded photos Photos tagged Gather site traffic from Flickr referrals Track site engagement newsletter sign-ups Promote donations
Flickr Flickr Recency - Views in time period Quantity - Views - Photos shared Photos uploaded RSS feeds Number of comments Members of group Quality Comments Types of photos loaded Response Rates If connected to actions Origination Source codes for links through to actions
Twitter Twitter Recency - Dates of posts Quantity Number of followers Number of people following People driving information Tagging Quality Type of information shared Categories of conversations New intelligence gained Response Rates Promote certain activities Origination Tracking through links
Second Life Second Life Recency - Push-pull data Quantity Number of volunteers Number of donors Number of event attendees Number of members in group Amount of real world traffic Quality Media exposure Credibility Response Rates Donations Advocacy Event attendance Selling product Real world web traffic Origination - Source code tracking
How to Measure Web analytics—Google Analytics, WebTracks Referring URL’s Views by source Duration Visitors RSS analytics—Feedburner Rankings—technorati, DIGG, Google Link Love, Tweet scan Categorizing by subject matter—internal, time commitment Capture anecdotal snapshots—internal Second Life sensors—Second Life Exchange Care 2’s Social Networking ROI calculator
Big Picture Try particular initiative, document and learn from it to make future decisions Start Benchmarking: Internal benchmarks for SN Comparison to other benchmarks Immediate v. Long-term

Nten3

  • 1.
    Abby Sandlin, CharityDynamics On the hunt for shiny objects
  • 2.
    Why Explore SN?Building communities Connect with new audiences Find new voices Adding additional touch-points Be part of a conversation Position your organization into dialogue important to other people Increased Transparency Develop new channels New exposure mechanism Foster new messengers/advocates Learn what people are saying about your organization
  • 3.
    Okay sounds good,but… Many questions before jumping in: How can I see how it contributes to my mission? What will legal think about it? (or board, or pr, or programs or advocacy) How long will this take? How much will this cost? How can I guarantee success? How can I predict responses?
  • 4.
    Where oh whereis the ROI? No industry standards or benchmarks Reporting standards young Reporting tools young Moving target
  • 5.
    Goodness Baked RightIn Define Engagement Value Internally See what’s out there—who’s talking about the things you are talking about? Stake a flag? Drive donations? Drive actions? Drive subscribers? Be part of a conversation Raise Awareness Transparency How is your 2.0 community different from your web and offline communities Document those objectives, goals, expectations Internal transparency and support for initiatives Tell the story of how these impact your organization Analysis and fine-tuning Reporting Document results—quantitative and qualitative What worked/what didn’t What learned
  • 6.
    What to MeasureRecency Timing Duration Consistency Quantity Web analytics How many viewers/participants/contributors/followers/favorites/tags Frequency of viewers/participants, etc. Traffic source to site(s) Staff time Quality Presence Types of conversations Tone of conversations Staff comfort/adoption/resistance Audience characteristics Response Rates How many engaging in organizational initiative Immediate and long term conversion Origination Identify participants as coming from 2.0 initiative vs. other channels—are 2.0 generated constituents providing more/less/different value to organization
  • 7.
    2.0 Conversion PathwayJoins Sees View pictures Read blog Reads article Watches tweets Joins Comments Follows Tags Comes out of the shadows Uses a photos Engages Participate in conversations Finds new people Uploads photos Submits photos Recruiting more people Getting comments Converts Captured in off-line activities Donates Advocates Volunteer Newsletter
  • 8.
  • 9.
    Making Connection Uploadedphotos Photos tagged Gather site traffic from Flickr referrals Track site engagement newsletter sign-ups Promote donations
  • 10.
    Flickr Flickr Recency- Views in time period Quantity - Views - Photos shared Photos uploaded RSS feeds Number of comments Members of group Quality Comments Types of photos loaded Response Rates If connected to actions Origination Source codes for links through to actions
  • 11.
    Twitter Twitter Recency- Dates of posts Quantity Number of followers Number of people following People driving information Tagging Quality Type of information shared Categories of conversations New intelligence gained Response Rates Promote certain activities Origination Tracking through links
  • 12.
    Second Life SecondLife Recency - Push-pull data Quantity Number of volunteers Number of donors Number of event attendees Number of members in group Amount of real world traffic Quality Media exposure Credibility Response Rates Donations Advocacy Event attendance Selling product Real world web traffic Origination - Source code tracking
  • 13.
    How to MeasureWeb analytics—Google Analytics, WebTracks Referring URL’s Views by source Duration Visitors RSS analytics—Feedburner Rankings—technorati, DIGG, Google Link Love, Tweet scan Categorizing by subject matter—internal, time commitment Capture anecdotal snapshots—internal Second Life sensors—Second Life Exchange Care 2’s Social Networking ROI calculator
  • 14.
    Big Picture Tryparticular initiative, document and learn from it to make future decisions Start Benchmarking: Internal benchmarks for SN Comparison to other benchmarks Immediate v. Long-term