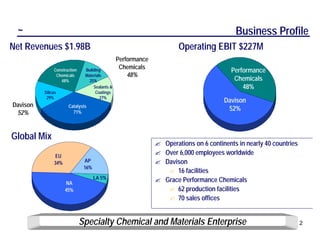
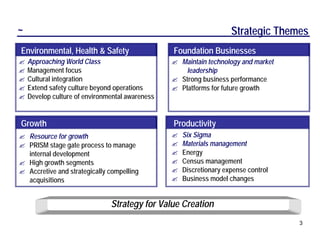
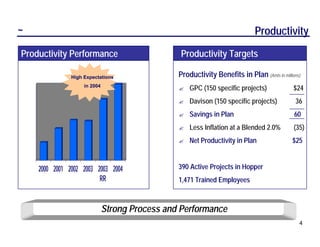
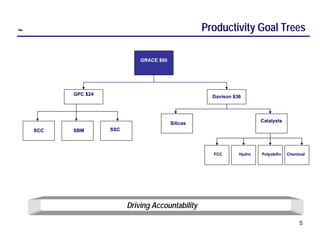
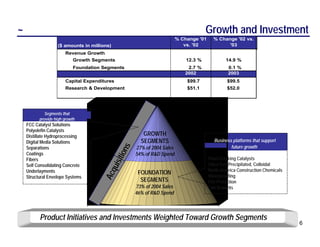
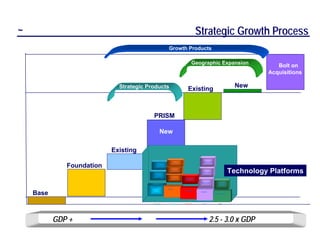
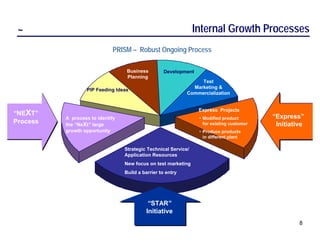
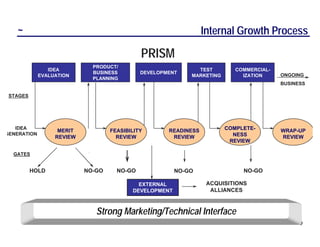
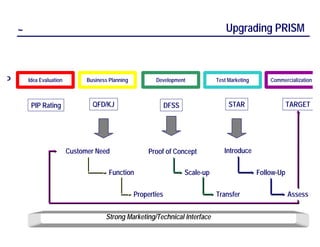
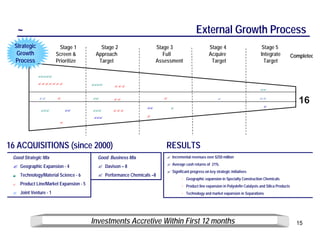
W. R. Grace & Co.
Balancing Growth and Profitability:
  Managing Today for Tomorrow

     CDMA 2004 Spring Meeting
         March 16, 2004
                                      ~
~                                                                                        Business Profile
Net Revenues $1.98B                                                   Operating EBIT $227M
                                                Performance
                                                 Chemicals
               Construction    Building                                                  Performance
                Chemicals      Materials            48%
                  48%            25%                                                      Chemicals
                                   Sealants &                                                48%
          Silicas                   Coatings
           29%                         27%
                                                                                      Davison
Davison               Catalysts
                                                                                       52%
 52%                    71%


Global Mix
                                                              ? Operations on 6 continents in nearly 40 countries
               EU
                                                              ? Over 6,000 employees worldwide
               34%             AP                             ? Davison
                               16%
                                                                 ? 16 facilities
                                     LA 5%                    ? Grace Performance Chemicals
                     NA
                     45%                                         ? 62 production facilities
                                                                 ? 70 sales offices


                              Specialty Chemical and Materials Enterprise                                           2
~                                                                    Strategic Themes
Environmental, Health & Safety                   Foundation Businesses
?   Approaching World Class                      ? Maintain technology and market
?   Management focus                                 leadership
?   Cultural integration                         ? Strong business performance
?   Extend safety culture beyond operations      ? Platforms for future growth
?   Develop culture of environmental awareness


Growth                                           Productivity
? Resource for growth                            ?   Six Sigma
? PRISM stage gate process to manage             ?   Materials management
  internal development                           ?   Energy
? High growth segments                           ?   Census management
? Accretive and strategically compelling         ?   Discretionary expense control
  acquisitions                                   ?   Business model changes


                               Strategy for Value Creation
                                                                                     3
~                                                                             Productivity
Productivity Performance                         Productivity Targets

               High Expectations                Productivity Benefits in Plan (Amts in millions)
                    in 2004
                                                ?   GPC (150 specific projects)              $24
                                                ?   Davison (150 specific projects)           36
                                                ?   Savings in Plan                          60
                                                ?   Less Inflation at a Blended 2.0%         (35)
                                                ?   Net Productivity in Plan                $25


    2000 2001 2002 2003 2003 2004               390 Active Projects in Hopper
                         RR                     1,471 Trained Employees


                              Strong Process and Performance
                                                                                               4
~                                                   Productivity Goal Trees

                              GRACE $60


          GPC $24                                     Davison $36


                                                                        Catalysts
                                          Silicas
    SCC   SBM       SSC


                                                      FCC       Hydro   Polyolefin   Chemical


                          Driving Accountability

                                                                                          5
~                                                                                      Growth and Investment
                                                                          % Change '01     % Change '02 vs.
                    ($ amounts in millions)                                  vs. '02             '03
                        Revenue Growth
                            Growth Segments                                   12.3 %             14.9 %
                            Foundation Segments                               2.7 %               0.1 %
                                                                             2002                 2003
                        Capital Expenditures                                  $99.7               $99.5
                        Research & Development                                $51.1               $52.0


             Segments that
          provide high growth
    FCC Catalyst Solutions
    Polyolefin Catalysts
    Distillate Hydroprocessing                           GROWTH
    Digital Media Solutions                             SEGMENTS                           Business platforms that support
                                                      27% of 2004 Sales                            future growth
                                                 ns

    Separations
    Coatings                                          54% of R&D Spend
                                             itio


    Fibers                                                                               Fluid Cracking Catalysts
                                          uis


    Self Consolidating Concrete                                                          Silica Gel, Precipitated, Colloidal
    Underlayments                                                                        North America Construction Chemicals
                                       Acq


                                                       FOUNDATION
    Structural Envelope Systems                                                          Waterproofing
                                                        SEGMENTS                         Fire Protection
                                                      73% of 2004 Sales                  Can Sealants
                                                      46% of R&D Spend


          Product Initiatives and Investments Weighted Toward Growth Segments
                                                                                                                                6
~                                                                                             Strategic Growth Process
                                                         Growth Products

                                                                                     Geographic Expansion
                                                                                                                                                        Bolt on
                                                                                                                                                     Acquisitions

                             Strategic Products                                                                                             New
                                                                                Existing


                                          PRISM

                                                  New

                           Existing
                                                                                                Customer Service
                                                               Tunneling


              Foundation                         EO/PO


                                           SEAGULL
                                                            Elevated Deck
                                                                                                 Base Custom                               Technology Platforms
                                                              Flooring      High-Solids TDA
                                                                               for Cement

                                                                                               Base Optimize             Architectural
                                                                                                                         cast-in-place

                                        ORIOLE
                                                         Precast
                                                                            Liquid Fiber


    Base                                                                                       Avantium
                                                                                                                   Architectural precast


                                         Dispersants         STRUX           STEALTH             HTEM                      Pieri


           GDP +                                                                                          2.5 - 3.0 x GDP                                       7
~                                                               Internal Growth Processes
                             PRISM – Robust Ongoing Process

                                   Business         Development
                                   Planning
                                                                  Test
                                                               Marketing &
                  PIP Feeding Ideas
                                                             Commercialization


                                                                  Express Projects
“NEXT”                                                                                      “Express”
          A process to identify                                   • Modified product
Process   the “NeXt” large                                          for existing customer    Initiative
          growth opportunity                                      • Produce products
                                                                    in different plant

                                  Strategic Technical Service/
                                  Application Resources
                                  New focus on test marketing
                                  Build a barrier to entry


                                             “STAR”
                                            Initiative
                                                                                                     8
~                                                            Internal Growth Process

                                             PRISM
                             PRODUCT/
                             PRODUCT/
                IDEA                                          TEST
                                                               TEST        COMMERCIAL-
                                                                           COMMERCIAL-
                 IDEA        BUSINESS
                             BUSINESS        DEVELOPMENT
                                             DEVELOPMENT
             EVALUATION                                     MARKETING
                                                            MARKETING        IZATION
                                                                              IZATION    ONGOING
              EVALUATION     PLANNING
                             PLANNING
                                                                                         BUSINESS

 STAGES


   IDEA                                                                 COMPLETE-
                   MERIT           FEASIBILITY       READINESS                           WRAP-UP
GENERATION                                                                NESS
                  REVIEW             REVIEW           REVIEW                             REVIEW
                                                                         REVIEW

  GATES


          HOLD             NO-GO     NO-GO              NO-GO                NO-GO

                                            EXTERNAL
                                            EXTERNAL              ACQUISITIONS
                                          DEVELOPMENT
                                          DEVELOPMENT              ALLIANCES


                              Strong Marketing/Technical Interface
                                                                                               9
~                                                                                  Upgrading PRISM


PIP       Idea Evaluation         Business Planning          Development             Test Marketing       Commercialization


           PIP Rating               QFD/KJ                         DFSS                   STAR                    TARGET


                            Customer Need                  Proof of Concept             Introduce


                                           Function                       Scale-up                    Follow-Up


                                                      Properties                     Transfer                     Assess


                                         Strong Marketing/Technical Interface
                                                                                                                    10
~                              Average Time (mos) for PRISM Projects per Stage
                                                                                  08/2002   05/2003   10/2003
                     01/2001    07/2001   11/2001   03/2002   04/2002   08/2002   MEDIAN    MEDIAN    MEDIAN
       Stage 1
                      4.5         3         3         3        1.5       1.4        0         0         0
      Idea Eval.

       Stage 2
                       6          6         7         6         6         5         6         5         5
      Bus. Plan

      Stage 3
                      10          8        12         11       11        10         7         7         11
      Develop.


      SUBTOTAL        21         17        22         20       19       16.5        13        12        16


       Stage 4
                      11          9        12         12       12        12         10        7          3
    Test Marketing

       Stage 5
                       8          8         7         7         7        10         7         7         12
     Commercial


       TOTAL          40         34        41         39        38        38        30        26        33


                                          Faster – But Not Fast Enough
                                                                                                                11
~                                                                                                           STAR
               A process to provide Grace with a more differentiated, proactive, and customized service offering

                             Optimization of PRISM     Six Sigma and Other         Utilization of
   Annual Sessions
                                    Process             Technical Training         Technology
                                                                                                                 Goals


• Survey given at annual                                                                            • Six Sigma training and
  roundtable                                                                                          participation on project
• Brainstorming at annual                                                 Technical                   teams
  roundtable
                                     Structured
                                                                          Training                  • Information available
• Online satisfaction
                                      Feedback                                                        from more sources
  survey
                                                                        & Information


                                                                                                    • Opportunity to provide
• Annual roundtable                                                                                   input to Grace product
  discussions on                                                                                      development efforts
                                     Annual                             Real Influence
  technology and business                                                                           • Opportunity to receive
  developments                      Roundtable                                on                      new Grace products
• Forum for complex issue                                               New Products                  before market
  resolution                                                                                          introduction


                                            Driving Commercialization Faster!
                                                                                                                         12
~                                                                                                                                    Project Overview
      Tech Building    Idea Eval.           Prod/Bus Plan.          Development
      Test Marketing   Commercial           Plant Relo              Outside PRISM


                                                                                                            ity


                                                                                                                          04
                                                                                                    '06 rtun


                                                                                                                        n'
                                                                                             er


                                                                                                                     Pla


                                                                                                                                 TD
                                                                                  tus


                                                                                                       po
                                                                                           ad
                                                                               Sta


                                                                                                                               $Y
                                                                                                    Op


                                                                                                                  Op
                                                                                         Le
                            2003                             2004
              J   F M A M   J   J   A   S    O N D       J   F M A M       J                        ($MM)         ($MM)        ($MM)                      Comments

                                                                                                                                       Project charter complete & approved.
Project A                                                                      G         Leader 1     $0.3         $0.0        $0.0
                                                                                                                                       Resources assigned.

Project B                                                                      G
                                                                                         Leader 2    $12.0        $1.94        $0.1    North America Sales training completed.


Project C                                                                      Y         Leader 1     $2.0        $0.21        $0.06 Feedback pending.

Project D                                                                      G         Leader 1     $3.0        $0.12        $0.01 Technical approval, goal: line trial this year.

Project E                                                                      G         Leader 3    $35.0         $0.0        $0.0    New project.

Project F                                                                      G         Leader 2   undefined      $0.0        $0.0    New project initiated at Martech.

Project G                                                                       Y        Leader 4     $7.8        $0.45        $0.04 Plans more trials.

Project H                                                                      G         Leader 4      $5            $0         $0     Test marketing has started.

              J   F M A M   J   J   A   S    O N D       J   F M A M       J            Totals      $102.8         $2.7        $0.16
                            2003                              2004


                                                                           Disciplined Process
                                                                                                                                                                           13
~                                                                                                           Express Projects

                 Short Projects which leverage existing know-how


                                                                                             er
                                                                                 tus

                                                                                           ad
                                                                              Sta

                                                                                         Le
                                                                                                    ? Reach sales run rate in less
Product A                                                                      G         Leader 1
                                                                                                      than 1 year
Product B
                                                                               G       Leader 2
                                                                                                    ? Target opportunities greater
                                                                                                      than $500M
                                                                                                    ? Typically existing customers
Product C                                                                      G         Leader 3


Product D                                                                      G         Leader 1   ? Know requirements for
            J    F M A M J          J   A S O N D          J      F M A M J            Totals
                                                                                                      process change
                                 2003                             2004

                Tech Building      Idea Evaluation   Prod/Bus Planning   Development


                Test Marketing     Commercial        Plant Relo          Outside PRISM


                    Work With Selected Customers To Achieve Revenue Quickly
                                                                                                                               14
~                                                                                      External Growth Process
  Strategic              Stage 1            Stage 2                   Stage 3                       Stage 4                          Stage 5
   Growth              Screen &           Approach                       Full                       Acquire                         Integrate             Completed
  Process              Prioritize          Target                     Assessment                     Target                           Target

              ?????
              ???????                    ????     ???
                                                                                                                                    ??

              ??        ?                ??                              ?                                                          ??
                                                  ??                                                      ?

                                                                                                                                      ?
                                                                                                                                                             16
                                                                 ??          ?
               ???           ??          ???     ???
                                         ???                     ?
                         ?


16 ACQUISITIONS (since 2000)                                             RESULTS
 Good Strategic Mix                        Good Business Mix              ? Incremental revenues over $250 million
                                                                          ? Average cash returns of 21%.
 ? Geographic Expansion - 4                ? Davison – 8
                                                                          ? Significant progress on key strategic initiatives
 ?   Technology/Material Science - 6       ? Performance Chemicals –8
                                                                                   • Geographic expansion in Specialty Construction Chemicals
 ?   Product Line/Market Expansion - 5                                             • Product line expansion in Polyolefin Catalysts and Silica Products
 ? Joint Venture - 1                                                               • Technology and market expansion in Separations


                                         Investments Accretive Within First 12 months                                                                       15
~                                                Summary


? Maintain Strong Position in Foundation Businesses
? Balance Resources Between Growth and Productivity
? Strengthen Contemporary Processes
? Drive Accountability through Performance Metrics


                People, Processes, Performance
                                                      16

Norris presentation

  • 1.
    W. R. Grace& Co. Balancing Growth and Profitability: Managing Today for Tomorrow CDMA 2004 Spring Meeting March 16, 2004 ~
  • 2.
    ~ Business Profile Net Revenues $1.98B Operating EBIT $227M Performance Chemicals Construction Building Performance Chemicals Materials 48% 48% 25% Chemicals Sealants & 48% Silicas Coatings 29% 27% Davison Davison Catalysts 52% 52% 71% Global Mix ? Operations on 6 continents in nearly 40 countries EU ? Over 6,000 employees worldwide 34% AP ? Davison 16% ? 16 facilities LA 5% ? Grace Performance Chemicals NA 45% ? 62 production facilities ? 70 sales offices Specialty Chemical and Materials Enterprise 2
  • 3.
    ~ Strategic Themes Environmental, Health & Safety Foundation Businesses ? Approaching World Class ? Maintain technology and market ? Management focus leadership ? Cultural integration ? Strong business performance ? Extend safety culture beyond operations ? Platforms for future growth ? Develop culture of environmental awareness Growth Productivity ? Resource for growth ? Six Sigma ? PRISM stage gate process to manage ? Materials management internal development ? Energy ? High growth segments ? Census management ? Accretive and strategically compelling ? Discretionary expense control acquisitions ? Business model changes Strategy for Value Creation 3
  • 4.
    ~ Productivity Productivity Performance Productivity Targets High Expectations Productivity Benefits in Plan (Amts in millions) in 2004 ? GPC (150 specific projects) $24 ? Davison (150 specific projects) 36 ? Savings in Plan 60 ? Less Inflation at a Blended 2.0% (35) ? Net Productivity in Plan $25 2000 2001 2002 2003 2003 2004 390 Active Projects in Hopper RR 1,471 Trained Employees Strong Process and Performance 4
  • 5.
    ~ Productivity Goal Trees GRACE $60 GPC $24 Davison $36 Catalysts Silicas SCC SBM SSC FCC Hydro Polyolefin Chemical Driving Accountability 5
  • 6.
    ~ Growth and Investment % Change '01 % Change '02 vs. ($ amounts in millions) vs. '02 '03 Revenue Growth Growth Segments 12.3 % 14.9 % Foundation Segments 2.7 % 0.1 % 2002 2003 Capital Expenditures $99.7 $99.5 Research & Development $51.1 $52.0 Segments that provide high growth FCC Catalyst Solutions Polyolefin Catalysts Distillate Hydroprocessing GROWTH Digital Media Solutions SEGMENTS Business platforms that support 27% of 2004 Sales future growth ns Separations Coatings 54% of R&D Spend itio Fibers Fluid Cracking Catalysts uis Self Consolidating Concrete Silica Gel, Precipitated, Colloidal Underlayments North America Construction Chemicals Acq FOUNDATION Structural Envelope Systems Waterproofing SEGMENTS Fire Protection 73% of 2004 Sales Can Sealants 46% of R&D Spend Product Initiatives and Investments Weighted Toward Growth Segments 6
  • 7.
    ~ Strategic Growth Process Growth Products Geographic Expansion Bolt on Acquisitions Strategic Products New Existing PRISM New Existing Customer Service Tunneling Foundation EO/PO SEAGULL Elevated Deck Base Custom Technology Platforms Flooring High-Solids TDA for Cement Base Optimize Architectural cast-in-place ORIOLE Precast Liquid Fiber Base Avantium Architectural precast Dispersants STRUX STEALTH HTEM Pieri GDP + 2.5 - 3.0 x GDP 7
  • 8.
    ~ Internal Growth Processes PRISM – Robust Ongoing Process Business Development Planning Test Marketing & PIP Feeding Ideas Commercialization Express Projects “NEXT” “Express” A process to identify • Modified product Process the “NeXt” large for existing customer Initiative growth opportunity • Produce products in different plant Strategic Technical Service/ Application Resources New focus on test marketing Build a barrier to entry “STAR” Initiative 8
  • 9.
    ~ Internal Growth Process PRISM PRODUCT/ PRODUCT/ IDEA TEST TEST COMMERCIAL- COMMERCIAL- IDEA BUSINESS BUSINESS DEVELOPMENT DEVELOPMENT EVALUATION MARKETING MARKETING IZATION IZATION ONGOING EVALUATION PLANNING PLANNING BUSINESS STAGES IDEA COMPLETE- MERIT FEASIBILITY READINESS WRAP-UP GENERATION NESS REVIEW REVIEW REVIEW REVIEW REVIEW GATES HOLD NO-GO NO-GO NO-GO NO-GO EXTERNAL EXTERNAL ACQUISITIONS DEVELOPMENT DEVELOPMENT ALLIANCES Strong Marketing/Technical Interface 9
  • 10.
    ~ Upgrading PRISM PIP Idea Evaluation Business Planning Development Test Marketing Commercialization PIP Rating QFD/KJ DFSS STAR TARGET Customer Need Proof of Concept Introduce Function Scale-up Follow-Up Properties Transfer Assess Strong Marketing/Technical Interface 10
  • 11.
    ~ Average Time (mos) for PRISM Projects per Stage 08/2002 05/2003 10/2003 01/2001 07/2001 11/2001 03/2002 04/2002 08/2002 MEDIAN MEDIAN MEDIAN Stage 1 4.5 3 3 3 1.5 1.4 0 0 0 Idea Eval. Stage 2 6 6 7 6 6 5 6 5 5 Bus. Plan Stage 3 10 8 12 11 11 10 7 7 11 Develop. SUBTOTAL 21 17 22 20 19 16.5 13 12 16 Stage 4 11 9 12 12 12 12 10 7 3 Test Marketing Stage 5 8 8 7 7 7 10 7 7 12 Commercial TOTAL 40 34 41 39 38 38 30 26 33 Faster – But Not Fast Enough 11
  • 12.
    ~ STAR A process to provide Grace with a more differentiated, proactive, and customized service offering Optimization of PRISM Six Sigma and Other Utilization of Annual Sessions Process Technical Training Technology Goals • Survey given at annual • Six Sigma training and roundtable participation on project • Brainstorming at annual Technical teams roundtable Structured Training • Information available • Online satisfaction Feedback from more sources survey & Information • Opportunity to provide • Annual roundtable input to Grace product discussions on development efforts Annual Real Influence technology and business • Opportunity to receive developments Roundtable on new Grace products • Forum for complex issue New Products before market resolution introduction Driving Commercialization Faster! 12
  • 13.
    ~ Project Overview Tech Building Idea Eval. Prod/Bus Plan. Development Test Marketing Commercial Plant Relo Outside PRISM ity 04 '06 rtun n' er Pla TD tus po ad Sta $Y Op Op Le 2003 2004 J F M A M J J A S O N D J F M A M J ($MM) ($MM) ($MM) Comments Project charter complete & approved. Project A G Leader 1 $0.3 $0.0 $0.0 Resources assigned. Project B G Leader 2 $12.0 $1.94 $0.1 North America Sales training completed. Project C Y Leader 1 $2.0 $0.21 $0.06 Feedback pending. Project D G Leader 1 $3.0 $0.12 $0.01 Technical approval, goal: line trial this year. Project E G Leader 3 $35.0 $0.0 $0.0 New project. Project F G Leader 2 undefined $0.0 $0.0 New project initiated at Martech. Project G Y Leader 4 $7.8 $0.45 $0.04 Plans more trials. Project H G Leader 4 $5 $0 $0 Test marketing has started. J F M A M J J A S O N D J F M A M J Totals $102.8 $2.7 $0.16 2003 2004 Disciplined Process 13
  • 14.
    ~ Express Projects Short Projects which leverage existing know-how er tus ad Sta Le ? Reach sales run rate in less Product A G Leader 1 than 1 year Product B G Leader 2 ? Target opportunities greater than $500M ? Typically existing customers Product C G Leader 3 Product D G Leader 1 ? Know requirements for J F M A M J J A S O N D J F M A M J Totals process change 2003 2004 Tech Building Idea Evaluation Prod/Bus Planning Development Test Marketing Commercial Plant Relo Outside PRISM Work With Selected Customers To Achieve Revenue Quickly 14
  • 15.
    ~ External Growth Process Strategic Stage 1 Stage 2 Stage 3 Stage 4 Stage 5 Growth Screen & Approach Full Acquire Integrate Completed Process Prioritize Target Assessment Target Target ????? ??????? ???? ??? ?? ?? ? ?? ? ?? ?? ? ? 16 ?? ? ??? ?? ??? ??? ??? ? ? 16 ACQUISITIONS (since 2000) RESULTS Good Strategic Mix Good Business Mix ? Incremental revenues over $250 million ? Average cash returns of 21%. ? Geographic Expansion - 4 ? Davison – 8 ? Significant progress on key strategic initiatives ? Technology/Material Science - 6 ? Performance Chemicals –8 • Geographic expansion in Specialty Construction Chemicals ? Product Line/Market Expansion - 5 • Product line expansion in Polyolefin Catalysts and Silica Products ? Joint Venture - 1 • Technology and market expansion in Separations Investments Accretive Within First 12 months 15
  • 16.
    ~ Summary ? Maintain Strong Position in Foundation Businesses ? Balance Resources Between Growth and Productivity ? Strengthen Contemporary Processes ? Drive Accountability through Performance Metrics People, Processes, Performance 16