SlideShare a Scribd company logo
1 of 19
Normative Model Project - Replenishment Processes
11/23/2009     11/23/2009

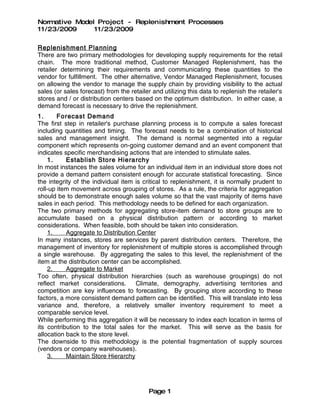
Replenishment Planning
There are two primary methodologies for developing supply requirements for the retail
chain. The more traditional method, Customer Managed Replenishment, has the
retailer determining their requirements and communicating these quantities to the
vendor for fulfillment. The other alternative, Vendor Managed Replenishment, focuses
on allowing the vendor to manage the supply chain by providing visibility to the actual
sales (or sales forecast) from the retailer and utilizing this data to replenish the retailer's
stores and / or distribution centers based on the optimum distribution. In either case, a
demand forecast is necessary to drive the replenishment.
1.      Forecast Demand
The first step in retailer's purchase planning process is to compute a sales forecast
including quantities and timing. The forecast needs to be a combination of historical
sales and management insight. The demand is normal segmented into a regular
component which represents on-going customer demand and an event component that
indicates specific merchandising actions that are intended to stimulate sales.
    1.     Establish Store Hierarchy
In most instances the sales volume for an individual item in an individual store does not
provide a demand pattern consistent enough for accurate statistical forecasting. Since
the integrity of the individual item is critical to replenishment, it is normally prudent to
roll-up item movement across grouping of stores. As a rule, the criteria for aggregation
should be to demonstrate enough sales volume so that the vast majority of items have
sales in each period. This methodology needs to be defined for each organization.
The two primary methods for aggregating store-item demand to store groups are to
accumulate based on a physical distribution pattern or according to market
considerations. When feasible, both should be taken into consideration.
    1.     Aggregate to Distribution Center
In many instances, stores are services by parent distribution centers. Therefore, the
management of inventory for replenishment of multiple stores is accomplished through
a single warehouse. By aggregating the sales to this level, the replenishment of the
item at the distribution center can be accomplished.
    2.     Aggregate to Market
Too often, physical distribution hierarchies (such as warehouse groupings) do not
reflect market considerations.       Climate, demography, advertising territories and
competition are key influences to forecasting. By grouping store according to these
factors, a more consistent demand pattern can be identified. This will translate into less
variance and, therefore, a relatively smaller inventory requirement to meet a
comparable service level.
While performing this aggregation it will be necessary to index each location in terms of
its contribution to the total sales for the market. This will serve as the basis for
allocation back to the store level.
The downside to this methodology is the potential fragmentation of supply sources
(vendors or company warehouses).
    3.     Maintain Store Hierarchy


                                           Page 1
Normative Model Project - Replenishment Processes
11/23/2009     11/23/2009
In either scenario,. a relationship must be established and maintained linking a store to
a forecast grouping. As new stores are added, their assignment to a group is
mandatory.
When new stores are added, the history for the store should be cloned for an existing
store with comparable market factors. The new store sales will then be multiplied by a
constant that will reflect its anticipated sales. (New stores typically operate at a lower
sales level than mature stores while they establish a customer base.)
When stores are closed, their demand should be removed from the data as well.
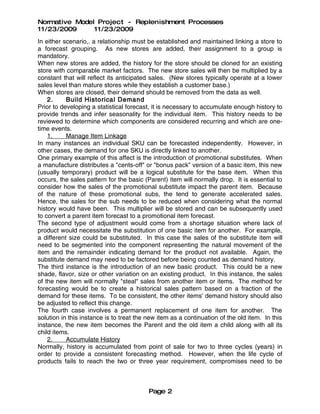
    2.     Build Historical Demand
Prior to developing a statistical forecast, it is necessary to accumulate enough history to
provide trends and infer seasonality for the individual item. This history needs to be
reviewed to determine which components are considered recurring and which are one-
time events.
    1.     Manage Item Linkage
In many instances an individual SKU can be forecasted independently. However, in
other cases, the demand for one SKU is directly linked to another.
One primary example of this affect is the introduction of promotional substitutes. When
a manufacture distributes a "cents-off" or "bonus pack" version of a basic item, this new
(usually temporary) product will be a logical substitute for the base item. When this
occurs, the sales pattern for the basic (Parent) item will normally drop. It is essential to
consider how the sales of the promotional substitute impact the parent item. Because
of the nature of these promotional subs, the tend to generate accelerated sales.
Hence, the sales for the sub needs to be reduced when considering what the normal
history would have been. This multiplier will be stored and can be subsequently used
to convert a parent item forecast to a promotional item forecast.
The second type of adjustment would come from a shortage situation where lack of
product would necessitate the substitution of one basic item for another. For example,
a different size could be substituted. In this case the sales of the substitute item will
need to be segmented into the component representing the natural movement of the
item and the remainder indicating demand for the product not available. Again, the
substitute demand may need to be factored before being counted as demand history.
The third instance is the introduction of an new basic product. This could be a new
shade, flavor, size or other variation on an existing product. In this instance, the sales
of the new item will normally "steal" sales from another item or items. The method for
forecasting would be to create a historical sales pattern based on a fraction of the
demand for these items. To be consistent, the other items' demand history should also
be adjusted to reflect this change.
The fourth case involves a permanent replacement of one item for another. The
solution in this instance is to treat the new item as a continuation of the old item. In this
instance, the new item becomes the Parent and the old item a child along with all its
child items.
    2.     Accumulate History
Normally, history is accumulated from point of sale for two to three cycles (years) in
order to provide a consistent forecasting method. However, when the life cycle of
products fails to reach the two or three year requirement, compromises need to be


                                          Page 2
Normative Model Project - Replenishment Processes
11/23/2009     11/23/2009
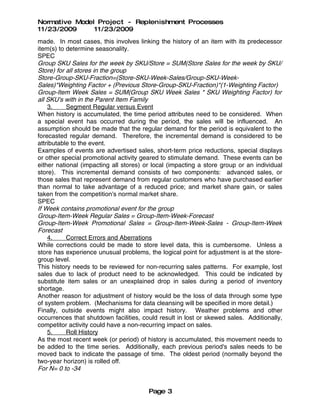
made. In most cases, this involves linking the history of an item with its predecessor
item(s) to determine seasonality.
SPEC
Group SKU Sales for the week by SKU/Store = SUM(Store Sales for the week by SKU/
Store) for all stores in the group
Store-Group-SKU-Fraction=(Store-SKU-Week-Sales/Group-SKU-Week-
Sales)*Weighting Factor + (Previous Store-Group-SKU-Fraction)*(1-Weighting Factor)
Group-Item Week Sales = SUM(Group SKU Week Sales * SKU Weighting Factor) for
all SKU's with in the Parent Item Family
    3.     Segment Regular versus Event
When history is accumulated, the time period attributes need to be considered. When
a special event has occurred during the period, the sales will be influenced. An
assumption should be made that the regular demand for the period is equivalent to the
forecasted regular demand. Therefore, the incremental demand is considered to be
attributable to the event.
Examples of events are advertised sales, short-term price reductions, special displays
or other special promotional activity geared to stimulate demand. These events can be
either national (impacting all stores) or local (impacting a store group or an individual
store). This incremental demand consists of two components: advanced sales, or
those sales that represent demand from regular customers who have purchased earlier
than normal to take advantage of a reduced price; and market share gain, or sales
taken from the competition's normal market share.
SPEC
If Week contains promotional event for the group
Group-Item-Week Regular Sales = Group-Item-Week-Forecast
Group-Item-Week Promotional Sales = Group-Item-Week-Sales - Group-Item-Week
Forecast
    4.     Correct Errors and Aberrations
While corrections could be made to store level data, this is cumbersome. Unless a
store has experience unusual problems, the logical point for adjustment is at the store-
group level.
This history needs to be reviewed for non-recurring sales patterns. For example, lost
sales due to lack of product need to be acknowledged. This could be indicated by
substitute item sales or an unexplained drop in sales during a period of inventory
shortage.
Another reason for adjustment of history would be the loss of data through some type
of system problem. (Mechanisms for data cleansing will be specified in more detail.)
Finally, outside events might also impact history. Weather problems and other
occurrences that shutdown facilities, could result in lost or skewed sales. Additionally,
competitor activity could have a non-recurring impact on sales.
    5.     Roll History
As the most recent week (or period) of history is accumulated, this movement needs to
be added to the time series. Additionally, each previous period's sales needs to be
moved back to indicate the passage of time. The oldest period (normally beyond the
two-year horizon) is rolled off.
For N= 0 to -34


                                        Page 3
Normative Model Project - Replenishment Processes
11/23/2009     11/23/2009
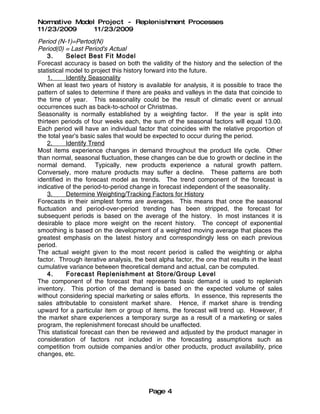
Period (N-1)=Pertod(N)
Period(0) = Last Period's Actual
    3.      Select Best Fit Model
Forecast accuracy is based on both the validity of the history and the selection of the
statistical model to project this history forward into the future.
    1.      Identify Seasonality
When at least two years of history is available for analysis, it is possible to trace the
pattern of sales to determine if there are peaks and valleys in the data that coincide to
the time of year. This seasonality could be the result of climatic event or annual
occurrences such as back-to-school or Christmas.
Seasonality is normally established by a weighting factor. If the year is split into
thirteen periods of four weeks each, the sum of the seasonal factors will equal 13.00.
Each period will have an individual factor that coincides with the relative proportion of
the total year's basic sales that would be expected to occur during the period.
    2.      Identify Trend
Most items experience changes in demand throughout the product life cycle. Other
than normal, seasonal fluctuation, these changes can be due to growth or decline in the
normal demand. Typically, new products experience a natural growth pattern.
Conversely, more mature products may suffer a decline. These patterns are both
identified in the forecast model as trends. The trend component of the forecast is
indicative of the period-to-period change in forecast independent of the seasonality.
    3.      Determine Weighting/Tracking Factors for History
Forecasts in their simplest forms are averages. This means that once the seasonal
fluctuation and period-over-period trending has been stripped, the forecast for
subsequent periods is based on the average of the history. In most instances it is
desirable to place more weight on the recent history. The concept of exponential
smoothing is based on the development of a weighted moving average that places the
greatest emphasis on the latest history and correspondingly less on each previous
period.
The actual weight given to the most recent period is called the weighting or alpha
factor. Through iterative analysis, the best alpha factor, the one that results in the least
cumulative variance between theoretical demand and actual, can be computed.
    4.      Forecast Replenishment at Store/Group Level
The component of the forecast that represents basic demand is used to replenish
inventory. This portion of the demand is based on the expected volume of sales
without considering special marketing or sales efforts. In essence, this represents the
sales attributable to consistent market share. Hence, if market share is trending
upward for a particular item or group of items, the forecast will trend up. However, if
the market share experiences a temporary surge as a result of a marketing or sales
program, the replenishment forecast should be unaffected.
This statistical forecast can then be reviewed and adjusted by the product manager in
consideration of factors not included in the forecasting assumptions such as
competition from outside companies and/or other products, product availability, price
changes, etc.


                                         Page 4
Normative Model Project - Replenishment Processes
11/23/2009     11/23/2009
Current Week's Forecast = (1-A) * [Seasonality Factor * (Last Week's Forecast / Last
Period's Seasonality Factor)] + A * (Last Week's Actual / Last Period's Seasonality
Factor)
     5.     Forecast Events at Store Group Level
While events are isolated from normal demand, events need to be forecasted in
addition to regular replenishment. Future events can be forecasted based on previous
events. The incremental quantity associated with the planned event is derived from
utilizing a previous event or events, considering the impact of the seasonality and trend
on the base sales for the planned period and generating a preliminary target forecast.
This initial forecast is equivalent to a system generated statistical forecast that must
then be reviewed and adjusted by the product manager.
Event forecasts are not driven by history, but by predictive factors that influence the
generation of incremental demand. A merchant cannot create demand. By stimulating
consumer awareness and the attractiveness of the products, a sales organization can
generate incremental sales as a result of either increasing market share or through
accelerating sales. The first represents real growth; the second is strictly an improved
cash flow.
The basis for determine an event forecast is to utilize the predictive analysis based on
those factors that drive demand. While these can vary for different products and
organizations, the key factors will include sensitivity to pricing, impact of display
advertising, telemarketing, sales force incentives and retail display. In addition, key
non-predictive factors that will strongly influence demand are competitor promotions
and substitute item promotions.
SPEC
Promo-Group-Item-Forecast = (Comparable-Event-Promo-Group-Item-Sales * Event-
Comparison-Weight) * (Group-Item-Week-Forecast [for the week of the planned
event] / Group-Item-Week-Sales [for the period of the Comparable Event])
     1.     Determine Promotional Event Attributes
There are several types of promotional events:
a) National Advertising
b) Local / Regional Advertising
c) Retail Display
d) Aggregate Events
The attributes for advertising include the position and size of the ad, the use of a
coupon and the pricing
The attributes for display include the use of a preset stand-alone display, positioning of
the end-cap, speed table, counter space, etc. and the size of the display as well as the
pricing.
     2. Select and Weight Comparable Event History
Based on the attributes, one or more comparable events are selected to serve as input
to the computation. If more than one event is chosen, and the forecaster does not
believe these events should be equally weighted, a mechanism for entering weights to
be applied to the promotional history increments needs to be developed.
     3. Compute Initial Item-Event Forecasts
The weighted average of the event increments is computed at the store market level.
Then the incremental values are factored based on the ratios of the base forecast in


                                        Page 5
Normative Model Project - Replenishment Processes
11/23/2009     11/23/2009
the planning period against the base forecasts (regular history) in the selected
comparable event periods.
    4. Review, Adjust and Approve Promotional Forecasts
Once the initial incremental forecast is computed, the forecaster will need to approve
the quanitities. The preferred method would be to review the combined regular and
promotional forecasts and make the necessary adjustments. Subsequently, the
quantities will be approved prior to inclusion in requirements planning.
    6.     Review and Adjust Forecasts
The system generated forecasts are to be considered initial estimates. Since the
computation of a forecast based on history is driven by a series of assumption, the
forecast is only as valid as those assumptions. In addition, there are marketing and
merchandising considerations that are normally not tracked with the history. As a
result, forecast inaccuracies can occur. It is the responsibility of the individual charged
with sales planning for the item (normally a buyer or product manager) to review the
history and the forecast and apply whatever adjustments are necessary to compensate
for the lack of sophistication.
Newer forecasting techniques are better able to take more of these factors into
consideration. Expert systems are just beginning to be applied successfully to this
area. Future forecasting should benefit greatly from these enhanced tools.
    7.     Manage Forecasts
In addition to the review and adjustment of the forecasts for individual items, it is
normally necessary for the system to monitor and report forecast error. This is the
cumulative deviation of the forecasted demand to actual sales. When this "tracking
signal" exceeds a preestablished cutoff, it is necessary to reevaluate the forecast
model. This can be done manually, by a forecasting analyst or the system can be
asked to refit the model to the most recent history.
2.      Customer Managed Replenishment
This section considers the processes associated with developing customer purchase
requirements. The forecast is used to determine the Just-in-Time requirements for
purchasing. The purchase planning process then modifies the requirement based on
economic incentives.
    1.     Replenish Customer Distribution Facility
There are two options in order fulfillment for most retailers. Product can either be sent
directly to stores or to a distribution center. The benefits of Direct Store Delivery are
usually in terms of compressing the order cycle. However, a difference in the mode of
transportation (i.e. less than truck load shipping) could offset this advantage.
Warehousing provides the ability to serve store more rapidly by allowing them rapid
replenishment against the distribution center inventory.
    1.     Establish Warehouse Service Level Goals
While 100% in-stock is the goals of all operations, the cost of approaching full service
on every product is prohibitive. Most businesses will establish differing goals based on
the criticality of the particular item and the cost associated with maintaining safety
stocks.
       1.     by Ite m
A commonly used practice is to set a "weeks of supply" target for safety stock. This,
however, does not necessarily result in consistent service levels across products.


                                         Page 6
Normative Model Project - Replenishment Processes
11/23/2009     11/23/2009
Instead, the service level goals should result in the establishment of a safety stock level
covers expected consumption between the placement of an order and the receipt of the
order.
The variance in the demand for a particular item is the critical measurement. Two
items with the same average weekly demand can have vastly differing deviations.
Therefore, to achieve the same service level will require different stock levels.
The second component of variance is the fluctuation in delivery time. When a particular
vendor has an erratic history of lead time, there is a greater need for maintaining higher
stocking levels.     By implementing procedures to reduce and standardize the
replenishment cycle, this component of variance can be significantly decreased,
allowing inventory reduction.
       2.     by Category
Since each item maintains its own inventory, each should maintain an individual service
level. However, for ease of management, it is common to establish groupings of items
to reduce the effort associated with maintaining stocking levels. The most popular
classification method categorizes items based on total dollar volume. Typically, 15 to
20% of the items account for 80% of the sales. These are "A" items. The next cut-off
are the "B" items that accumulate to 95% of sales, approximately 30 to 35% of the total
items. The remaining 50% of the items will account for 5% of total sales. These are
the "C" items. In some cases, the last 1% will be handled separately, in some cases as
custom orders. These are sometimes referred to as "D" items.
In most instances, service level goals for "A" items is highest, then "B" and "C"
respectively. The actual level will be determined based on either a customer service
goal or an inventory value analysis.
    2.      Determine Costs of Procurement
The first component of the cost merchandise is the determination of the cost of
acquiring merchandise. In most instances there are several elements to this cost.
       1.     Determine Purcha se Orde r Cost
The cost of placing a purchase order is based on the allocation of the overhead costs
associated with managing the Purchasing and Distribution processes as well as the
directly identifiable costs for each item ordered. Even though there be a portion of this
cost that will vary based on the quantity ordered, this is not normally factored into the
PO costs.        In a continuous replenishment environment, this cost is
significantly reduced.
       2.     Compute Purchase Price
The cost of acquiring merchandise from a vendor is either based on a pre-established
agreement, a negotiated contract or a price sheet or schedule may be used. The
purchase price is the primary factor in determining inventory costs and gross margins.
Therefore, the purchase price is critical to retail pricing decisions and the ability to
complete in a particular market.
       1.     Determine Unit Cost
The cost of an individual item is taken from whatever agreement is in effect. Without
any quantity discounts or price bracket structures, this represents a simple lookup
procedure. In the event of a quantity driven price structure, multiple items must be
grouped to determine the appropriate price for this specific acquisition.
       2.     Determine Extended Cost


                                         Page 7
Normative Model Project - Replenishment Processes
11/23/2009     11/23/2009
Once the individual unit costs have been identified, each line item's total extended
purchase price can be computed by multiplying the unit cost times the number of units.
       3.     Apply Off-Invoice Allowances
In those instances where vendors have negotiated agreements that provide special
discounts, these are applied to the total invoice. However, for purposes of evaluating
order quantities, the cost should reflect any off-invoice allowance.
    3.      Determine Inventory Costs
The cost of inventorying product is a function of the value of the product and the time
the goods remain in inventory. It is not necessary to compute a cost for every unit of
every stock-keeping unit (SKU). Based on the rate-of-sale, the on-hand quantity will
represent a number of weeks of supply. The inventory cost can be computed by
multiplying one-half of this quantity by the unit cost, including all inbound allocations,
and applying the annual inventory carrying cost.
For example, if 100 units were purchased of an item with a weekly demand of 20 units,
the purchase would represent an incremental five weeks of demand. Given a planned
inventory level of 30 units at the time of receipt, the average unit would be retained in
inventory during the depletion of the purchased quantity would be two-and-one-half
weeks plus the current on-hand. This is equivalent to four weeks. If the inventory
carrying cost, consisting of storage and cost of capital, is equivalent to 24% annually,
the charge for these goods would be 80 * .24 * (4/52) * unit cost. Assuming a purchase
cost of $30 and an additional $1.75 in internal handling costs. the inventory cost for the
order would be estimated as $47 on a purchase of $3,000.
    4.      Develop Inventory Plan
The inventory plan is based on filling the requirements by time period based on the net
item availability. This is represented by a time-phased inventory analysis determines
the project available stocking levels by period. Then once a requirement has been
identified, an analysis is conducted to determine how much to order from the vendor.
       1.     Imple ment Order Models
The primary model in use today is a "Just-in-time" that attempts to meet the
requirement developed in the MRP analysis. It is possible that other models might be
more effective is reducing the total cost of goods sold and delivering desired service
levels.
       1.     Develop Order Models
As part of the purchasing decision process, it is important to review alternative rules for
purchasing and select those rules that best service the business. The chosen model
could differ by item, vendor, category, etc. However, purchasing and inventory
management should not be a function of the sales channel. Instead, the meeting of
requirements will apply to all channels.
       1.     Assess Order Models
Other order models include: economic order quantity for individual items; joint
replenishment for vendors with multiple items; order-up-to target inventory; and min-
max inventory..
       2.     Select Optimal Model(s)
In all probability there will not be a single "best" model, but several that will be applied
based on existing parameters including: cost, rate-of-sale, inventory redundancy,
vendor lead time, risk, etc.


                                             Page 8
Normative Model Project - Replenishment Processes
11/23/2009     11/23/2009
       2.     Validate Order Models
It is to review and update these replenishment models on a recurring basis. Changes
in lead-time, cost structure or forecast can serve to distort the success of the particular
model. In additiion, capacity considerations may alter the economics of the order
methodology.
       2.     Determine Time - Phased Require men ts
The determination of net item requirements can be done on a weekly or daily basis.
While daily provides precision, the forecast accuracy at the daily level is questionable.
Additionally, the variation in delivery would make analysis at the daily level open to
scrutiny. In either instance, net requirements would need to be computed out for the
established time horizon. This horizon is determined by the lead time and the
opportunities for economic advantage.
If the projected available inventory of an item for the period reflecting the lead time is
negative, an order must be placed in the current period to offset the planned shortage.
By limiting the analysis to the lead time, opportunity buying is severely restricted.
However, by extending the review period a number of time intervals beyond the
minimum, some economic gains are possible.
       1.     Calculate Review Stock
The review stock is the expected volume to be shipped to stores for the days between
the initiation of the analysis and the release of the purchase instructions.
SPEC
Review Stock = Sum of the forecasts by day (week / 5) for the number of days until the
purchase advise (or PO) is released to the vendor.
       2.     Calculate Lead Time Stock
The lead stock is the expected volume to be shipped to stores for the days between the
release of the purchase instructions to the vendor and the receipt of the shipment at the
distribution center. In the case of a consolidated shipment, this is the time to get the
merchandise to its final destination.
If the instructions indicate at ship-to-arrive date extending later than the lead time, this
will represent a revised lead time.
Lead Stock = Sum of the forecasts by day (week / 5) for the number of days between
the time the order is released to the vendor and is received at the DC.
This is based on either an historical average or an override based on an agreement
with the vendor.
       3.     Calculate Safety Stock
Safety Stock is the quantity necessary to insure against stock outs between the time of
the order analysis and the receipt of the order do to potential variances in demand and
delivery time.
The Safety Stock computation is based on applying the service level goal to the
forecasted movement based on a normal distribution with the mean equaling the
forecasted consumption and the variance derived from the historical variance in sales
aggregated to distribution center level and the variation in vendor delivery time.
SPEC
The adjusted lead time days for safety stock purposes should be equivalent to the
greater of number of days necessary to meet the service level requirement based on
the Normal distribution with a mean of the historical lead time or the revised lead time.


                                          Page 9
Normative Model Project - Replenishment Processes
11/23/2009     11/23/2009
The safety stock is the statistical bound indicated by a normal distribution with a mean
of the sum of the lead stock plus review stock and variance equal to (the historical
weekly variance for the aggregate warehouse demand / 5) * (Review Days + Adjusted
Lead Time Days)
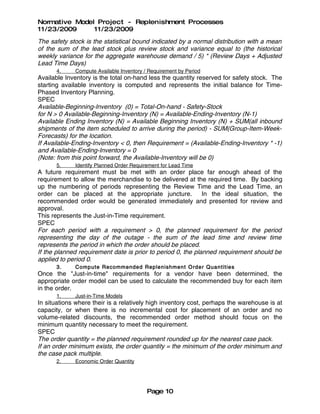
      4.     Compute Available Inventory / Requirement by Period
Available Inventory is the total on-hand less the quantity reserved for safety stock. The
starting available inventory is computed and represents the initial balance for Time-
Phased Inventory Planning.
SPEC
Available-Beginning-Inventory (0) = Total-On-hand - Safety-Stock
for N > 0 Available-Beginning-Inventory (N) = Available-Ending-Inventory (N-1)
Available Ending Inventory (N) = Available Beginning Inventory (N) + SUM(all inbound
shipments of the item scheduled to arrive during the period) - SUM(Group-Item-Week-
Forecasts) for the location.
If Available-Ending-Inventory < 0, then Requirement = (Available-Ending-Inventory * -1)
and Available-Ending-Inventory = 0
(Note: from this point forward, the Available-Inventory will be 0)
      5.     Identify Planned Order Requirement for Lead Time
A future requirement must be met with an order place far enough ahead of the
requirement to allow the merchandise to be delivered at the required time. By backing
up the numbering of periods representing the Review Time and the Lead Time, an
order can be placed at the appropriate juncture.             In the ideal situation, the
recommended order would be generated immediately and presented for review and
approval.
This represents the Just-in-Time requirement.
SPEC
For each period with a requirement > 0, the planned requirement for the period
representing the day of the outage - the sum of the lead time and review time
represents the period in which the order should be placed.
If the planned requirement date is prior to period 0, the planned requirement should be
applied to period 0.
      3.     Compute Recommended Replenish men t Orde r Quantit ie s
Once the "Just-in-time" requirements for a vendor have been determined, the
appropriate order model can be used to calculate the recommended buy for each item
in the order.
      1.     Just-in-Time Models
In situations where their is a relatively high inventory cost, perhaps the warehouse is at
capacity, or when there is no incremental cost for placement of an order and no
volume-related discounts, the recommended order method should focus on the
minimum quantity necessary to meet the requirement.
SPEC
The order quantity = the planned requirement rounded up for the nearest case pack.
If an order minimum exists, the order quantity = the minimum of the order minimum and
the case pack multiple.
      2.     Economic Order Quantity


                                          Page 10
Normative Model Project - Replenishment Processes
11/23/2009     11/23/2009
When a single item is being purchased from a particular vendor, the objective should
be to minimize the total cost function including purchase price, procurement cost and
inventory carrying costs. The EOQ is the quantity for a fixed purchase price that yields
the minimum total cost of goods.
SPEC
EOQ = the square root of [(2 * (SUM of the next 13 weeks forecast)*4) * the cost of
placing an order)/ annual inventory carrying cost per unit]
Inventory Carrying Cost per unit equals the purchase price * the interest rate.
The order quantity = EOQ rounded to the nearest case pack > than JIT requirement.
(Note: if EOQ is less than JIT requirement, the order period should be shortened and
item reviewed more often)
       3.     Bracket Pricing Analysis
Based on quarterly volumes, a recommended review period can be developed that will
result in the lowest cost of goods. This is accomplished by grouping all products that
can be combined for price discount and projecting the cost of goods based on the
attainment of each bracket. As the review period increases, the order quantity will grow
to reach the next bracket. At some point, the additional carrying and storage costs of a
larger buy will offset the discount.
Once this review period has been determined, the buy quantity will attempt the equalize
the weeks supply for all items in the group. Should an individual item sell faster than
anticipated, it may be necessary to place an order early. In this case, all products from
the vendor should be reviewed and the period reinitialized.
       4.     Min-Max Models
In those situations where orders are being shipped directly to stores or when the
customer warehousing configuration is constrained for space, Min-Max models may
prove effective. These models establish a reorder point equivalent to the minimum
desirable inventory level. Normally this is the greater of the statistical safety stock and
the shelf presence quantity (the minimum on hand quantity necessary to meet effective
merchandising requirements.)
The order quantity is based on demand. However, the objective here is to order only
what can be stored in the primary location. This avoids the double handling associated
with establishing multiple stocking locations and reduces the possibility of shrink by
limiting physical stock to a single position.
       5.     Hybrid Models
The "best" economics can sometimes be achieved through combining more than one of
the above models. For example, every order with to a vendor offering a quantity
discount should have consider the implications of reaching the discounts. The
utilization of joint replenishment analysis will normally result in an opportunity to lower
the cost of goods.
       4.     Consider the impact of inbound consolida tion
By aggregating purchase quantities for multiple warehouses, additional quantity
discounts may be attainable. In these cases, however, the it is necessary to assess the
tradeoff of these savings against the increased handling and transportation costs that
would result from double shipments - first into the consolidated distribution center and
subsequently shipped with other goods to the warehouse servicing the store.
Additionally, these orders might need to be placed earlier to allow for the reshipment.


                                         Page 11
Normative Model Project - Replenishment Processes
11/23/2009     11/23/2009
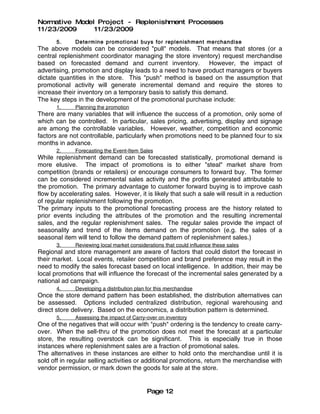
       5.     Determine promot ional buys for replenish ment merchandise
The above models can be considered "pull" models. That means that stores (or a
central replenishment coordinator managing the store inventory) request merchandise
based on forecasted demand and current inventory. However, the impact of
advertising, promotion and display leads to a need to have product managers or buyers
dictate quantities in the store. This "push" method is based on the assumption that
promotional activity will generate incremental demand and require the stores to
increase their inventory on a temporary basis to satisfy this demand.
The key steps in the development of the promotional purchase include:
       1.     Planning the promotion
There are many variables that will influence the success of a promotion, only some of
which can be controlled. In particular, sales pricing, advertising, display and signage
are among the controllable variables. However, weather, competition and economic
factors are not controllable, particularly when promotions need to be planned four to six
months in advance.
       2.     Forecasting the Event-Item Sales
While replenishment demand can be forecasted statistically, promotional demand is
more elusive. The impact of promotions is to either "steal" market share from
competition (brands or retailers) or encourage consumers to forward buy. The former
can be considered incremental sales activity and the profits generated attributable to
the promotion. The primary advantage to customer forward buying is to improve cash
flow by accelerating sales. However, it is likely that such a sale will result in a reduction
of regular replenishment following the promotion.
The primary inputs to the promotional forecasting process are the history related to
prior events including the attributes of the promotion and the resulting incremental
sales, and the regular replenishment sales. The regular sales provide the impact of
seasonality and trend of the items demand on the promotion (e.g. the sales of a
seasonal item will tend to follow the demand pattern of replenishment sales.)
       3.     Reviewing local market considerations that could influence these sales
Regional and store management are aware of factors that could distort the forecast in
their market. Local events, retailer competition and brand preference may result in the
need to modify the sales forecast based on local intelligence. In addition, their may be
local promotions that will influence the forecast of the incremental sales generated by a
national ad campaign.
       4.     Developing a distribution plan for this merchandise
Once the store demand pattern has been established, the distribution alternatives can
be assessed. Options included centralized distribution, regional warehousing and
direct store delivery. Based on the economics, a distribution pattern is determined.
       5.     Assessing the impact of Carry-over on inventory
One of the negatives that will occur with "push" ordering is the tendency to create carry-
over. When the sell-thru of the promotion does not meet the forecast at a particular
store, the resulting overstock can be significant. This is especially true in those
instances where replenishment sales are a fraction of promotional sales.
The alternatives in these instances are either to hold onto the merchandise until it is
sold off in regular selling activities or additional promotions, return the merchandise with
vendor permission, or mark down the goods for sale at the store.


                                             Page 12
Normative Model Project - Replenishment Processes
11/23/2009     11/23/2009
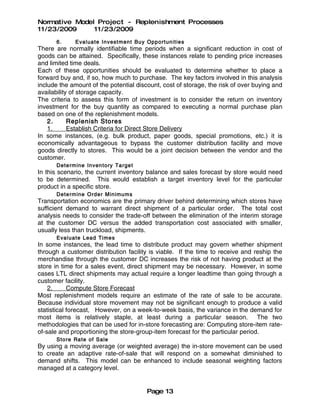
      6.     Evaluate Invest men t Buy Opport unit ie s
There are normally identifiable time periods when a significant reduction in cost of
goods can be attained. Specifically, these instances relate to pending price increases
and limited time deals.
Each of these opportunities should be evaluated to determine whether to place a
forward buy and, if so, how much to purchase. The key factors involved in this analysis
include the amount of the potential discount, cost of storage, the risk of over buying and
availability of storage capacity.
The criteria to assess this form of investment is to consider the return on inventory
investment for the buy quantity as compared to executing a normal purchase plan
based on one of the replenishment models.
    2.      Replenish Stores
    1.      Establish Criteria for Direct Store Delivery
In some instances, (e.g. bulk product, paper goods, special promotions, etc.) it is
economically advantageous to bypass the customer distribution facility and move
goods directly to stores. This would be a joint decision between the vendor and the
customer.
      Determine Inven tory Targe t
In this scenario, the current inventory balance and sales forecast by store would need
to be determined. This would establish a target inventory level for the particular
product in a specific store.
      Determine Order Minimums
Transportation economics are the primary driver behind determining which stores have
sufficient demand to warrant direct shipment of a particular order. The total cost
analysis needs to consider the trade-off between the elimination of the interim storage
at the customer DC versus the added transportation cost associated with smaller,
usually less than truckload, shipments.
      Evaluate Lead Time s
In some instances, the lead time to distribute product may govern whether shipment
through a customer distribution facility is viable. If the time to receive and reship the
merchandise through the customer DC increases the risk of not having product at the
store in time for a sales event, direct shipment may be necessary. However, in some
cases LTL direct shipments may actual require a longer leadtime than going through a
customer facility.
    2.      Compute Store Forecast
Most replenishment models require an estimate of the rate of sale to be accurate.
Because individual store movement may not be significant enough to produce a valid
statistical forecast, However, on a week-to-week basis, the variance in the demand for
most items is relatively staple, at least during a particular season. The two
methodologies that can be used for in-store forecasting are: Computing store-item rate-
of-sale and proportioning the store-group-item forecast for the particular period.
      Store Rate of Sale
By using a moving average (or weighted average) the in-store movement can be used
to create an adaptive rate-of-sale that will respond on a somewhat diminished to
demand shifts. This model can be enhanced to include seasonal weighting factors
managed at a category level.


                                        Page 13
Normative Model Project - Replenishment Processes
11/23/2009     11/23/2009
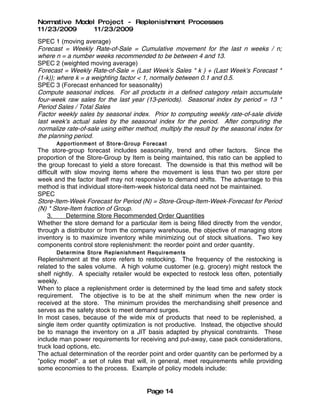
SPEC 1 (moving average)
Forecast = Weekly Rate-of-Sale = Cumulative movement for the last n weeks / n;
where n = a number weeks recommended to be between 4 and 13.
SPEC 2 (weighted moving average)
Forecast = Weekly Rate-of-Sale = (Last Week's Sales * k ) + (Last Week's Forecast *
(1-k)); where k = a weighting factor < 1, normally between 0.1 and 0.5.
SPEC 3 (Forecast enhanced for seasonality)
Compute seasonal indices. For all products in a defined category retain accumulate
four-week raw sales for the last year (13-periods). Seasonal index by period = 13 *
Period Sales / Total Sales
Factor weekly sales by seasonal index. Prior to computing weekly rate-of-sale divide
last week's actual sales by the seasonal index for the period. After computing the
normalize rate-of-sale using either method, multiply the result by the seasonal index for
the planning period.
      Apport ionment of Store - Group Fore cast
The store-group forecast includes seasonality, trend and other factors. Since the
proportion of the Store-Group by Item is being maintained, this ratio can be applied to
the group forecast to yield a store forecast. The downside is that this method will be
difficult with slow moving items where the movement is less than two per store per
week and the factor itself may not responsive to demand shifts. The advantage to this
method is that individual store-item-week historical data need not be maintained.
SPEC
Store-Item-Week Forecast for Period (N) = Store-Group-Item-Week-Forecast for Period
(N) * Store-Item fraction of Group.
     3.     Determine Store Recommended Order Quantities
Whether the store demand for a particular item is being filled directly from the vendor,
through a distributor or from the company warehouse, the objective of managing store
inventory is to maximize inventory while minimizing out of stock situations. Two key
components control store replenishment: the reorder point and order quantity.
      Determine Store Replenish men t Require men ts
Replenishment at the store refers to restocking. The frequency of the restocking is
related to the sales volume. A high volume customer (e.g. grocery) might restock the
shelf nightly. A specialty retailer would be expected to restock less often, potentially
weekly.
When to place a replenishment order is determined by the lead time and safety stock
requirement. The objective is to be at the shelf minimum when the new order is
received at the store. The minimum provides the merchandising shelf presence and
serves as the safety stock to meet demand surges.
In most cases, because of the wide mix of products that need to be replenished, a
single item order quantity optimization is not productive. Instead, the objective should
be to manage the inventory on a JIT basis adapted by physical constraints. These
include man power requirements for receiving and put-away, case pack considerations,
truck load options, etc.
The actual determination of the reorder point and order quantity can be performed by a
"policy model". a set of rules that will, in general, meet requirements while providing
some economies to the process. Example of policy models include:


                                       Page 14
Normative Model Project - Replenishment Processes
11/23/2009     11/23/2009
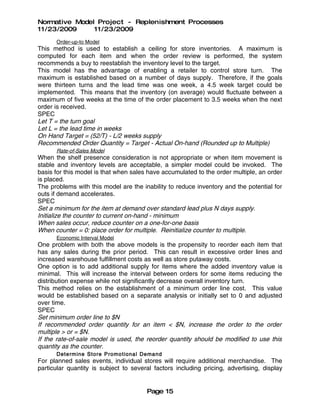
      Order-up-to Model
This method is used to establish a ceiling for store inventories. A maximum is
computed for each item and when the order review is performed, the system
recommends a buy to reestablish the inventory level to the target.
This model has the advantage of enabling a retailer to control store turn. The
maximum is established based on a number of days supply. Therefore, if the goals
were thirteen turns and the lead time was one week, a 4.5 week target could be
implemented. This means that the inventory (on average) would fluctuate between a
maximum of five weeks at the time of the order placement to 3.5 weeks when the next
order is received.
SPEC
Let T = the turn goal
Let L = the lead time in weeks
On Hand Target = (52/T) - L/2 weeks supply
Recommended Order Quantity = Target - Actual On-hand (Rounded up to Multiple)
      Rate-of-Sales Model
When the shelf presence consideration is not appropriate or when item movement is
stable and inventory levels are acceptable, a simpler model could be invoked. The
basis for this model is that when sales have accumulated to the order multiple, an order
is placed.
The problems with this model are the inability to reduce inventory and the potential for
outs if demand accelerates.
SPEC
Set a minimum for the item at demand over standard lead plus N days supply.
Initialize the counter to current on-hand - minimum
When sales occur, reduce counter on a one-for-one basis
When counter = 0: place order for multiple. Reinitialize counter to multiple.
      Economic Interval Model
One problem with both the above models is the propensity to reorder each item that
has any sales during the prior period. This can result in excessive order lines and
increased warehouse fulfillment costs as well as store putaway costs.
One option is to add additional supply for items where the added inventory value is
minimal. This will increase the interval between orders for some items reducing the
distribution expense while not significantly decrease overall inventory turn.
This method relies on the establishment of a minimum order line cost. This value
would be established based on a separate analysis or initially set to 0 and adjusted
over time.
SPEC
Set minimum order line to $N
If recommended order quantity for an item < $N, increase the order to the order
multiple > or = $N.
If the rate-of-sale model is used, the reorder quantity should be modified to use this
quantity as the counter.
      Determine Store Promo tional Demand
For planned sales events, individual stores will require additional merchandise. The
particular quantity is subject to several factors including pricing, advertising, display


                                       Page 15
Normative Model Project - Replenishment Processes
11/23/2009     11/23/2009
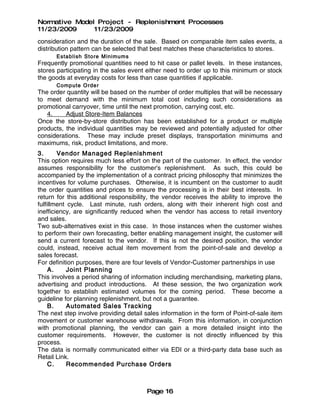
consideration and the duration of the sale. Based on comparable item sales events, a
distribution pattern can be selected that best matches these characteristics to stores.
      Establish Store Minimums
Frequently promotional quantities need to hit case or pallet levels. In these instances,
stores participating in the sales event either need to order up to this minimum or stock
the goods at everyday costs for less than case quantities if applicable.
      Compute Orde r
The order quantity will be based on the number of order multiples that will be necessary
to meet demand with the minimum total cost including such considerations as
promotional carryover, time until the next promotion, carrying cost, etc.
   4.     Adjust Store-Item Balances
Once the store-by-store distribution has been established for a product or multiple
products, the individual quantities may be reviewed and potentially adjusted for other
considerations. These may include preset displays, transportation minimums and
maximums, risk, product limitations, and more.
3.      Vendor Managed Replenishment
This option requires much less effort on the part of the customer. In effect, the vendor
assumes responsibility for the customer's replenishment. As such, this could be
accompanied by the implementation of a contract pricing philosophy that minimizes the
incentives for volume purchases. Otherwise, it is incumbent on the customer to audit
the order quantities and prices to ensure the processing is in their best interests. In
return for this additional responsibility, the vendor receives the ability to improve the
fulfillment cycle. Last minute, rush orders, along with their inherent high cost and
inefficiency, are significantly reduced when the vendor has access to retail inventory
and sales.
Two sub-alternatives exist in this case. In those instances when the customer wishes
to perform their own forecasting, better enabling management insight, the customer will
send a current forecast to the vendor. If this is not the desired position, the vendor
could, instead, receive actual item movement from the point-of-sale and develop a
sales forecast.
For definition purposes, there are four levels of Vendor-Customer partnerships in use
     A.     Joint Planning
This involves a period sharing of information including merchandising, marketing plans,
advertising and product introductions. At these session, the two organization work
together to establish estimated volumes for the coming period. These become a
guideline for planning replenishment, but not a guarantee.
     B.     Automated Sales Tracking
The next step involve providing detail sales information in the form of Point-of-sale item
movement or customer warehouse withdrawals. From this information, in conjunction
with promotional planning, the vendor can gain a more detailed insight into the
customer requirements. However, the customer is not directly influenced by this
process.
The data is normally communicated either via EDI or a third-party data base such as
Retail Link.
     C.     Recommended Purchase Orders


                                        Page 16
Normative Model Project - Replenishment Processes
11/23/2009     11/23/2009
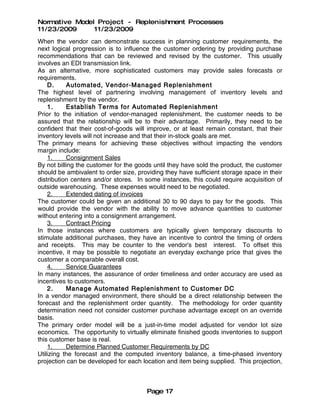
When the vendor can demonstrate success in planning customer requirements, the
next logical progression is to influence the customer ordering by providing purchase
recommendations that can be reviewed and revised by the customer. This usually
involves an EDI transmission link.
As an alternative, more sophisticated customers may provide sales forecasts or
requirements.
    D.     Automated, Vendor-Managed Replenishment
The highest level of partnering involving management of inventory levels and
replenishment by the vendor.
    1.     Establish Terms for Automated Replenishment
Prior to the initiation of vendor-managed replenishment, the customer needs to be
assured that the relationship will be to their advantage. Primarily, they need to be
confident that their cost-of-goods will improve, or at least remain constant, that their
inventory levels will not increase and that their in-stock goals are met.
The primary means for achieving these objectives without impacting the vendors
margin include:
    1.     Consignment Sales
By not billing the customer for the goods until they have sold the product, the customer
should be ambivalent to order size, providing they have sufficient storage space in their
distribution centers and/or stores. In some instances, this could require acquisition of
outside warehousing. These expenses would need to be negotiated.
    2.     Extended dating of invoices
The customer could be given an additional 30 to 90 days to pay for the goods. This
would provide the vendor with the ability to move advance quantities to customer
without entering into a consignment arrangement.
    3.     Contract Pricing
In those instances where customers are typically given temporary discounts to
stimulate additional purchases, they have an incentive to control the timing of orders
and receipts. This may be counter to the vendor's best interest. To offset this
incentive, it may be possible to negotiate an everyday exchange price that gives the
customer a comparable overall cost.
    4.     Service Guarantees
In many instances, the assurance of order timeliness and order accuracy are used as
incentives to customers.
    2.     Manage Automated Replenishment to Customer DC
In a vendor managed environment, there should be a direct relationship between the
forecast and the replenishment order quantity. The methodology for order quantity
determination need not consider customer purchase advantage except on an override
basis.
The primary order model will be a just-in-time model adjusted for vendor lot size
economics. The opportunity to virtually eliminate finished goods inventories to support
this customer base is real.
    1.     Determine Planned Customer Requirements by DC
Utilizing the forecast and the computed inventory balance, a time-phased inventory
projection can be developed for each location and item being supplied. This projection,


                                       Page 17
Normative Model Project - Replenishment Processes
11/23/2009     11/23/2009
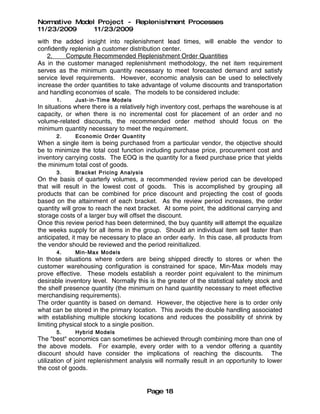
with the added insight into replenishment lead times, will enable the vendor to
confidently replenish a customer distribution center.
    2.    Compute Recommended Replenishment Order Quantities
As in the customer managed replenishment methodology, the net item requirement
serves as the minimum quantity necessary to meet forecasted demand and satisfy
service level requirements. However, economic analysis can be used to selectively
increase the order quantities to take advantage of volume discounts and transportation
and handling economies of scale. The models to be considered include:
       1.     Just- in- Time Models
In situations where there is a relatively high inventory cost, perhaps the warehouse is at
capacity, or when there is no incremental cost for placement of an order and no
volume-related discounts, the recommended order method should focus on the
minimum quantity necessary to meet the requirement.
       2.     Econo mic Order Quantity
When a single item is being purchased from a particular vendor, the objective should
be to minimize the total cost function including purchase price, procurement cost and
inventory carrying costs. The EOQ is the quantity for a fixed purchase price that yields
the minimum total cost of goods.
       3.     Bracket Pricing Analysis
On the basis of quarterly volumes, a recommended review period can be developed
that will result in the lowest cost of goods. This is accomplished by grouping all
products that can be combined for price discount and projecting the cost of goods
based on the attainment of each bracket. As the review period increases, the order
quantity will grow to reach the next bracket. At some point, the additional carrying and
storage costs of a larger buy will offset the discount.
Once this review period has been determined, the buy quantity will attempt the equalize
the weeks supply for all items in the group. Should an individual item sell faster than
anticipated, it may be necessary to place an order early. In this case, all products from
the vendor should be reviewed and the period reinitialized.
       4.     Min- Max Models
In those situations where orders are being shipped directly to stores or when the
customer warehousing configuration is constrained for space, Min-Max models may
prove effective. These models establish a reorder point equivalent to the minimum
desirable inventory level. Normally this is the greater of the statistical safety stock and
the shelf presence quantity (the minimum on hand quantity necessary to meet effective
merchandising requirements).
The order quantity is based on demand. However, the objective here is to order only
what can be stored in the primary location. This avoids the double handling associated
with establishing multiple stocking locations and reduces the possibility of shrink by
limiting physical stock to a single position.
       5.     Hybrid Models
The "best" economics can sometimes be achieved through combining more than one of
the above models. For example, every order with to a vendor offering a quantity
discount should have consider the implications of reaching the discounts. The
utilization of joint replenishment analysis will normally result in an opportunity to lower
the cost of goods.


                                         Page 18
Normative Model Project - Replenishment Processes
11/23/2009     11/23/2009
      6.     Econo mic Lot Size
From the point-of-view of the vendor it is desirable to ship product in accordance with a
production schedule that would minimize finished goods inventory and shorten the
replenishment cycle.
To accomplish this the vendor would attempt to fill orders in accordance with the
production runs for the specific products. In some instances the customer might get a
quantity that exceeds the JIT demand. However, this would allow all orders to be filled
more rapidly and what the customer lost in terms of minimum inventories would be
offset by the reduction in stocking levels to support protracted order lead times.
    3.      Provide Customer Review and Adjustment Facility
Since these quantities are intended to replenish customer inventories, it is prudent to
allow customer management to review the pending delivery prior to its release. This, in
effect, is the approval of the purchase quantity by the customer.
    4.      Maintain Customer DC Inventory Levels
In order to maintain the accuracy of the time-phased inventory, up to date inventory
levels will need to be communicated to the vendor. Additionally, DC-to-store billings will
be needed to indicate the decrement to the DC inventory levels. Shipments to the
customer from the vendor will be established.
    3.      Manage Automated Direct Store Delivery
In some instances, (e.g. bulk product, paper goods, special promotions, etc.) it is
economically advantageous to bypass the customer distribution facility and move
goods directly to stores.
    1.      Establish Store Template for DSD
In those instances where direct store delivery is a viable option, an initial distribution
pattern based on store percent of market for the selected product will need to be
generated. Additionally, rules will need to be developed to establish a cut-off or other
qualifying criteria for direct store delivery.
    2.      Adjust Store-Item Balances
In some instances the delivery quantities to individual store locations will need to be
adjusted for transportation considerations, promotional considerations or economics.
    3.      Provide Customer Review and Adjustment Facility
Since these quantities are intended to replenish customer inventories, it is prudent to
allow customer management to review the pending delivery prior to its release. This, in
effect, is the approval of the purchase quantity by the customer.


                                        Page 19

More Related Content

What's hot

Supply chain management presentation
Supply chain management presentationSupply chain management presentation
Supply chain management presentationMuhammad Nasir
 
Marketing measurement
Marketing measurementMarketing measurement
Marketing measurementSam Sharma
 
Sales, Distribution & Logistic Management - Goals in Sales Management
Sales, Distribution & Logistic Management - Goals in Sales ManagementSales, Distribution & Logistic Management - Goals in Sales Management
Sales, Distribution & Logistic Management - Goals in Sales ManagementThe Stockker
 
FORECASTING DEMAND AND MEASUREMENT
FORECASTING DEMAND AND MEASUREMENTFORECASTING DEMAND AND MEASUREMENT
FORECASTING DEMAND AND MEASUREMENTSameer Mathur
 
2016 Retail Holiday Season Global Forecast_Final
2016 Retail Holiday Season Global Forecast_Final2016 Retail Holiday Season Global Forecast_Final
2016 Retail Holiday Season Global Forecast_FinalErnie Deyle
 
The theory-and-practice-of-space-and-assortment-optimization-final
The theory-and-practice-of-space-and-assortment-optimization-finalThe theory-and-practice-of-space-and-assortment-optimization-final
The theory-and-practice-of-space-and-assortment-optimization-finalHIEN NGUYEN SONG THANH
 
Assortment optimization based on consumer clustering and behavior modelling
Assortment optimization based on consumer clustering and behavior modellingAssortment optimization based on consumer clustering and behavior modelling
Assortment optimization based on consumer clustering and behavior modellingScienceSoft
 
Retailmerchandisebudgetplannng
RetailmerchandisebudgetplannngRetailmerchandisebudgetplannng
Retailmerchandisebudgetplannngsunil mehra
 
Concept of market potential,crmmm market share & buying decision process
Concept of market potential,crmmm market share & buying decision processConcept of market potential,crmmm market share & buying decision process
Concept of market potential,crmmm market share & buying decision processVikash Kumar Bibhakar
 
Sales and customer dashboard
Sales and customer dashboardSales and customer dashboard
Sales and customer dashboardDharshniSuresh
 
production Economic
production Economicproduction Economic
production EconomicItiDubey3
 
Sales budget & forecasting
Sales budget & forecastingSales budget & forecasting
Sales budget & forecastingAvinash Singh
 
Merchandise, store and financial planning with Targetta
Merchandise, store and financial planning with TargettaMerchandise, store and financial planning with Targetta
Merchandise, store and financial planning with TargettaMärt Parker
 
Assortment Planning for P&G
Assortment Planning for P&GAssortment Planning for P&G
Assortment Planning for P&GLee Saeugling
 
Chapter 4 Marketing Research and Sales Forecasting
Chapter 4 Marketing Research and Sales ForecastingChapter 4 Marketing Research and Sales Forecasting
Chapter 4 Marketing Research and Sales ForecastingHoly Angel University
 

What's hot (20)

Supply chain management presentation
Supply chain management presentationSupply chain management presentation
Supply chain management presentation
 
Marketing measurement
Marketing measurementMarketing measurement
Marketing measurement
 
Measuring market demand
Measuring market demandMeasuring market demand
Measuring market demand
 
Forecasting and demand measurement
Forecasting and demand measurementForecasting and demand measurement
Forecasting and demand measurement
 
Sales, Distribution & Logistic Management - Goals in Sales Management
Sales, Distribution & Logistic Management - Goals in Sales ManagementSales, Distribution & Logistic Management - Goals in Sales Management
Sales, Distribution & Logistic Management - Goals in Sales Management
 
FORECASTING DEMAND AND MEASUREMENT
FORECASTING DEMAND AND MEASUREMENTFORECASTING DEMAND AND MEASUREMENT
FORECASTING DEMAND AND MEASUREMENT
 
2016 Retail Holiday Season Global Forecast_Final
2016 Retail Holiday Season Global Forecast_Final2016 Retail Holiday Season Global Forecast_Final
2016 Retail Holiday Season Global Forecast_Final
 
Forecasting accuracy of industrial sales with endogeneity in firm-level data
Forecasting accuracy of industrial sales with endogeneity in firm-level dataForecasting accuracy of industrial sales with endogeneity in firm-level data
Forecasting accuracy of industrial sales with endogeneity in firm-level data
 
The theory-and-practice-of-space-and-assortment-optimization-final
The theory-and-practice-of-space-and-assortment-optimization-finalThe theory-and-practice-of-space-and-assortment-optimization-final
The theory-and-practice-of-space-and-assortment-optimization-final
 
Demand forecasting
Demand forecastingDemand forecasting
Demand forecasting
 
Assortment optimization based on consumer clustering and behavior modelling
Assortment optimization based on consumer clustering and behavior modellingAssortment optimization based on consumer clustering and behavior modelling
Assortment optimization based on consumer clustering and behavior modelling
 
Retailmerchandisebudgetplannng
RetailmerchandisebudgetplannngRetailmerchandisebudgetplannng
Retailmerchandisebudgetplannng
 
Demand forecasting 4 gp
Demand forecasting 4 gpDemand forecasting 4 gp
Demand forecasting 4 gp
 
Concept of market potential,crmmm market share & buying decision process
Concept of market potential,crmmm market share & buying decision processConcept of market potential,crmmm market share & buying decision process
Concept of market potential,crmmm market share & buying decision process
 
Sales and customer dashboard
Sales and customer dashboardSales and customer dashboard
Sales and customer dashboard
 
production Economic
production Economicproduction Economic
production Economic
 
Sales budget & forecasting
Sales budget & forecastingSales budget & forecasting
Sales budget & forecasting
 
Merchandise, store and financial planning with Targetta
Merchandise, store and financial planning with TargettaMerchandise, store and financial planning with Targetta
Merchandise, store and financial planning with Targetta
 
Assortment Planning for P&G
Assortment Planning for P&GAssortment Planning for P&G
Assortment Planning for P&G
 
Chapter 4 Marketing Research and Sales Forecasting
Chapter 4 Marketing Research and Sales ForecastingChapter 4 Marketing Research and Sales Forecasting
Chapter 4 Marketing Research and Sales Forecasting
 

Similar to Normative Model Project - Replenishment Planning Processes

Inventory Management: How Incremental Improvements Drive Big Gains
Inventory Management: How Incremental Improvements Drive Big GainsInventory Management: How Incremental Improvements Drive Big Gains
Inventory Management: How Incremental Improvements Drive Big GainsCognizant
 
DATA MINING IN RETAIL SECTOR
DATA MINING IN RETAIL SECTORDATA MINING IN RETAIL SECTOR
DATA MINING IN RETAIL SECTORRenuka Chand
 
Managing predictable variability
Managing predictable variability Managing predictable variability
Managing predictable variability Deepali Bhosale
 
Off the shelf: Smart Retail Strategies for Competitive Grocers
Off the shelf: Smart Retail Strategies for Competitive GrocersOff the shelf: Smart Retail Strategies for Competitive Grocers
Off the shelf: Smart Retail Strategies for Competitive GrocersQuantum Retail
 
Instantaneous Deteriorated Economic Order Quantity (EOQ) Model with Promotion...
Instantaneous Deteriorated Economic Order Quantity (EOQ) Model with Promotion...Instantaneous Deteriorated Economic Order Quantity (EOQ) Model with Promotion...
Instantaneous Deteriorated Economic Order Quantity (EOQ) Model with Promotion...IJAEMSJORNAL
 
Master's Project Report - Minchao Lin
Master's Project Report - Minchao LinMaster's Project Report - Minchao Lin
Master's Project Report - Minchao LinMinchao Lin
 
Demand planning and inventories strategy
Demand planning and inventories strategyDemand planning and inventories strategy
Demand planning and inventories strategyLuis Cabrera
 
Beyond the 'Perfect Order' Index: Obtaining a True Measure of Customer Value
Beyond the 'Perfect Order' Index: Obtaining a True Measure of Customer ValueBeyond the 'Perfect Order' Index: Obtaining a True Measure of Customer Value
Beyond the 'Perfect Order' Index: Obtaining a True Measure of Customer ValueCognizant
 
Retailmerchandisebudgetplannng
RetailmerchandisebudgetplannngRetailmerchandisebudgetplannng
Retailmerchandisebudgetplannngbaabul
 
0562 financial management
0562 financial management0562 financial management
0562 financial managementhusnaink
 

Similar to Normative Model Project - Replenishment Planning Processes (20)

Pom unit 3
Pom unit 3Pom unit 3
Pom unit 3
 
Inventory Management: How Incremental Improvements Drive Big Gains
Inventory Management: How Incremental Improvements Drive Big GainsInventory Management: How Incremental Improvements Drive Big Gains
Inventory Management: How Incremental Improvements Drive Big Gains
 
2012 e4
2012 e42012 e4
2012 e4
 
Crer internship glossary
Crer internship glossaryCrer internship glossary
Crer internship glossary
 
Managingdistribution
ManagingdistributionManagingdistribution
Managingdistribution
 
The Plan2
The Plan2The Plan2
The Plan2
 
DATA MINING IN RETAIL SECTOR
DATA MINING IN RETAIL SECTORDATA MINING IN RETAIL SECTOR
DATA MINING IN RETAIL SECTOR
 
Managing predictable variability
Managing predictable variability Managing predictable variability
Managing predictable variability
 
Inventory management
Inventory managementInventory management
Inventory management
 
Reliance retail scenario
Reliance retail scenarioReliance retail scenario
Reliance retail scenario
 
Off the shelf: Smart Retail Strategies for Competitive Grocers
Off the shelf: Smart Retail Strategies for Competitive GrocersOff the shelf: Smart Retail Strategies for Competitive Grocers
Off the shelf: Smart Retail Strategies for Competitive Grocers
 
Instantaneous Deteriorated Economic Order Quantity (EOQ) Model with Promotion...
Instantaneous Deteriorated Economic Order Quantity (EOQ) Model with Promotion...Instantaneous Deteriorated Economic Order Quantity (EOQ) Model with Promotion...
Instantaneous Deteriorated Economic Order Quantity (EOQ) Model with Promotion...
 
Better Inventory Management
Better Inventory ManagementBetter Inventory Management
Better Inventory Management
 
Master's Project Report - Minchao Lin
Master's Project Report - Minchao LinMaster's Project Report - Minchao Lin
Master's Project Report - Minchao Lin
 
Demand planning and inventories strategy
Demand planning and inventories strategyDemand planning and inventories strategy
Demand planning and inventories strategy
 
Kraljic matrix of procurement
Kraljic matrix of procurementKraljic matrix of procurement
Kraljic matrix of procurement
 
Beyond the 'Perfect Order' Index: Obtaining a True Measure of Customer Value
Beyond the 'Perfect Order' Index: Obtaining a True Measure of Customer ValueBeyond the 'Perfect Order' Index: Obtaining a True Measure of Customer Value
Beyond the 'Perfect Order' Index: Obtaining a True Measure of Customer Value
 
Retailmerchandisebudgetplannng
RetailmerchandisebudgetplannngRetailmerchandisebudgetplannng
Retailmerchandisebudgetplannng
 
0562 financial management
0562 financial management0562 financial management
0562 financial management
 
Sourcing Portfolio Analysis
Sourcing Portfolio AnalysisSourcing Portfolio Analysis
Sourcing Portfolio Analysis
 

Normative Model Project - Replenishment Planning Processes

  • 1. Normative Model Project - Replenishment Processes 11/23/2009 11/23/2009 Replenishment Planning There are two primary methodologies for developing supply requirements for the retail chain. The more traditional method, Customer Managed Replenishment, has the retailer determining their requirements and communicating these quantities to the vendor for fulfillment. The other alternative, Vendor Managed Replenishment, focuses on allowing the vendor to manage the supply chain by providing visibility to the actual sales (or sales forecast) from the retailer and utilizing this data to replenish the retailer's stores and / or distribution centers based on the optimum distribution. In either case, a demand forecast is necessary to drive the replenishment. 1. Forecast Demand The first step in retailer's purchase planning process is to compute a sales forecast including quantities and timing. The forecast needs to be a combination of historical sales and management insight. The demand is normal segmented into a regular component which represents on-going customer demand and an event component that indicates specific merchandising actions that are intended to stimulate sales. 1. Establish Store Hierarchy In most instances the sales volume for an individual item in an individual store does not provide a demand pattern consistent enough for accurate statistical forecasting. Since the integrity of the individual item is critical to replenishment, it is normally prudent to roll-up item movement across grouping of stores. As a rule, the criteria for aggregation should be to demonstrate enough sales volume so that the vast majority of items have sales in each period. This methodology needs to be defined for each organization. The two primary methods for aggregating store-item demand to store groups are to accumulate based on a physical distribution pattern or according to market considerations. When feasible, both should be taken into consideration. 1. Aggregate to Distribution Center In many instances, stores are services by parent distribution centers. Therefore, the management of inventory for replenishment of multiple stores is accomplished through a single warehouse. By aggregating the sales to this level, the replenishment of the item at the distribution center can be accomplished. 2. Aggregate to Market Too often, physical distribution hierarchies (such as warehouse groupings) do not reflect market considerations. Climate, demography, advertising territories and competition are key influences to forecasting. By grouping store according to these factors, a more consistent demand pattern can be identified. This will translate into less variance and, therefore, a relatively smaller inventory requirement to meet a comparable service level. While performing this aggregation it will be necessary to index each location in terms of its contribution to the total sales for the market. This will serve as the basis for allocation back to the store level. The downside to this methodology is the potential fragmentation of supply sources (vendors or company warehouses). 3. Maintain Store Hierarchy Page 1
  • 2. Normative Model Project - Replenishment Processes 11/23/2009 11/23/2009 In either scenario,. a relationship must be established and maintained linking a store to a forecast grouping. As new stores are added, their assignment to a group is mandatory. When new stores are added, the history for the store should be cloned for an existing store with comparable market factors. The new store sales will then be multiplied by a constant that will reflect its anticipated sales. (New stores typically operate at a lower sales level than mature stores while they establish a customer base.) When stores are closed, their demand should be removed from the data as well. 2. Build Historical Demand Prior to developing a statistical forecast, it is necessary to accumulate enough history to provide trends and infer seasonality for the individual item. This history needs to be reviewed to determine which components are considered recurring and which are one- time events. 1. Manage Item Linkage In many instances an individual SKU can be forecasted independently. However, in other cases, the demand for one SKU is directly linked to another. One primary example of this affect is the introduction of promotional substitutes. When a manufacture distributes a "cents-off" or "bonus pack" version of a basic item, this new (usually temporary) product will be a logical substitute for the base item. When this occurs, the sales pattern for the basic (Parent) item will normally drop. It is essential to consider how the sales of the promotional substitute impact the parent item. Because of the nature of these promotional subs, the tend to generate accelerated sales. Hence, the sales for the sub needs to be reduced when considering what the normal history would have been. This multiplier will be stored and can be subsequently used to convert a parent item forecast to a promotional item forecast. The second type of adjustment would come from a shortage situation where lack of product would necessitate the substitution of one basic item for another. For example, a different size could be substituted. In this case the sales of the substitute item will need to be segmented into the component representing the natural movement of the item and the remainder indicating demand for the product not available. Again, the substitute demand may need to be factored before being counted as demand history. The third instance is the introduction of an new basic product. This could be a new shade, flavor, size or other variation on an existing product. In this instance, the sales of the new item will normally "steal" sales from another item or items. The method for forecasting would be to create a historical sales pattern based on a fraction of the demand for these items. To be consistent, the other items' demand history should also be adjusted to reflect this change. The fourth case involves a permanent replacement of one item for another. The solution in this instance is to treat the new item as a continuation of the old item. In this instance, the new item becomes the Parent and the old item a child along with all its child items. 2. Accumulate History Normally, history is accumulated from point of sale for two to three cycles (years) in order to provide a consistent forecasting method. However, when the life cycle of products fails to reach the two or three year requirement, compromises need to be Page 2
  • 3. Normative Model Project - Replenishment Processes 11/23/2009 11/23/2009 made. In most cases, this involves linking the history of an item with its predecessor item(s) to determine seasonality. SPEC Group SKU Sales for the week by SKU/Store = SUM(Store Sales for the week by SKU/ Store) for all stores in the group Store-Group-SKU-Fraction=(Store-SKU-Week-Sales/Group-SKU-Week- Sales)*Weighting Factor + (Previous Store-Group-SKU-Fraction)*(1-Weighting Factor) Group-Item Week Sales = SUM(Group SKU Week Sales * SKU Weighting Factor) for all SKU's with in the Parent Item Family 3. Segment Regular versus Event When history is accumulated, the time period attributes need to be considered. When a special event has occurred during the period, the sales will be influenced. An assumption should be made that the regular demand for the period is equivalent to the forecasted regular demand. Therefore, the incremental demand is considered to be attributable to the event. Examples of events are advertised sales, short-term price reductions, special displays or other special promotional activity geared to stimulate demand. These events can be either national (impacting all stores) or local (impacting a store group or an individual store). This incremental demand consists of two components: advanced sales, or those sales that represent demand from regular customers who have purchased earlier than normal to take advantage of a reduced price; and market share gain, or sales taken from the competition's normal market share. SPEC If Week contains promotional event for the group Group-Item-Week Regular Sales = Group-Item-Week-Forecast Group-Item-Week Promotional Sales = Group-Item-Week-Sales - Group-Item-Week Forecast 4. Correct Errors and Aberrations While corrections could be made to store level data, this is cumbersome. Unless a store has experience unusual problems, the logical point for adjustment is at the store- group level. This history needs to be reviewed for non-recurring sales patterns. For example, lost sales due to lack of product need to be acknowledged. This could be indicated by substitute item sales or an unexplained drop in sales during a period of inventory shortage. Another reason for adjustment of history would be the loss of data through some type of system problem. (Mechanisms for data cleansing will be specified in more detail.) Finally, outside events might also impact history. Weather problems and other occurrences that shutdown facilities, could result in lost or skewed sales. Additionally, competitor activity could have a non-recurring impact on sales. 5. Roll History As the most recent week (or period) of history is accumulated, this movement needs to be added to the time series. Additionally, each previous period's sales needs to be moved back to indicate the passage of time. The oldest period (normally beyond the two-year horizon) is rolled off. For N= 0 to -34 Page 3
  • 4. Normative Model Project - Replenishment Processes 11/23/2009 11/23/2009 Period (N-1)=Pertod(N) Period(0) = Last Period's Actual 3. Select Best Fit Model Forecast accuracy is based on both the validity of the history and the selection of the statistical model to project this history forward into the future. 1. Identify Seasonality When at least two years of history is available for analysis, it is possible to trace the pattern of sales to determine if there are peaks and valleys in the data that coincide to the time of year. This seasonality could be the result of climatic event or annual occurrences such as back-to-school or Christmas. Seasonality is normally established by a weighting factor. If the year is split into thirteen periods of four weeks each, the sum of the seasonal factors will equal 13.00. Each period will have an individual factor that coincides with the relative proportion of the total year's basic sales that would be expected to occur during the period. 2. Identify Trend Most items experience changes in demand throughout the product life cycle. Other than normal, seasonal fluctuation, these changes can be due to growth or decline in the normal demand. Typically, new products experience a natural growth pattern. Conversely, more mature products may suffer a decline. These patterns are both identified in the forecast model as trends. The trend component of the forecast is indicative of the period-to-period change in forecast independent of the seasonality. 3. Determine Weighting/Tracking Factors for History Forecasts in their simplest forms are averages. This means that once the seasonal fluctuation and period-over-period trending has been stripped, the forecast for subsequent periods is based on the average of the history. In most instances it is desirable to place more weight on the recent history. The concept of exponential smoothing is based on the development of a weighted moving average that places the greatest emphasis on the latest history and correspondingly less on each previous period. The actual weight given to the most recent period is called the weighting or alpha factor. Through iterative analysis, the best alpha factor, the one that results in the least cumulative variance between theoretical demand and actual, can be computed. 4. Forecast Replenishment at Store/Group Level The component of the forecast that represents basic demand is used to replenish inventory. This portion of the demand is based on the expected volume of sales without considering special marketing or sales efforts. In essence, this represents the sales attributable to consistent market share. Hence, if market share is trending upward for a particular item or group of items, the forecast will trend up. However, if the market share experiences a temporary surge as a result of a marketing or sales program, the replenishment forecast should be unaffected. This statistical forecast can then be reviewed and adjusted by the product manager in consideration of factors not included in the forecasting assumptions such as competition from outside companies and/or other products, product availability, price changes, etc. Page 4
  • 5. Normative Model Project - Replenishment Processes 11/23/2009 11/23/2009 Current Week's Forecast = (1-A) * [Seasonality Factor * (Last Week's Forecast / Last Period's Seasonality Factor)] + A * (Last Week's Actual / Last Period's Seasonality Factor) 5. Forecast Events at Store Group Level While events are isolated from normal demand, events need to be forecasted in addition to regular replenishment. Future events can be forecasted based on previous events. The incremental quantity associated with the planned event is derived from utilizing a previous event or events, considering the impact of the seasonality and trend on the base sales for the planned period and generating a preliminary target forecast. This initial forecast is equivalent to a system generated statistical forecast that must then be reviewed and adjusted by the product manager. Event forecasts are not driven by history, but by predictive factors that influence the generation of incremental demand. A merchant cannot create demand. By stimulating consumer awareness and the attractiveness of the products, a sales organization can generate incremental sales as a result of either increasing market share or through accelerating sales. The first represents real growth; the second is strictly an improved cash flow. The basis for determine an event forecast is to utilize the predictive analysis based on those factors that drive demand. While these can vary for different products and organizations, the key factors will include sensitivity to pricing, impact of display advertising, telemarketing, sales force incentives and retail display. In addition, key non-predictive factors that will strongly influence demand are competitor promotions and substitute item promotions. SPEC Promo-Group-Item-Forecast = (Comparable-Event-Promo-Group-Item-Sales * Event- Comparison-Weight) * (Group-Item-Week-Forecast [for the week of the planned event] / Group-Item-Week-Sales [for the period of the Comparable Event]) 1. Determine Promotional Event Attributes There are several types of promotional events: a) National Advertising b) Local / Regional Advertising c) Retail Display d) Aggregate Events The attributes for advertising include the position and size of the ad, the use of a coupon and the pricing The attributes for display include the use of a preset stand-alone display, positioning of the end-cap, speed table, counter space, etc. and the size of the display as well as the pricing. 2. Select and Weight Comparable Event History Based on the attributes, one or more comparable events are selected to serve as input to the computation. If more than one event is chosen, and the forecaster does not believe these events should be equally weighted, a mechanism for entering weights to be applied to the promotional history increments needs to be developed. 3. Compute Initial Item-Event Forecasts The weighted average of the event increments is computed at the store market level. Then the incremental values are factored based on the ratios of the base forecast in Page 5
  • 6. Normative Model Project - Replenishment Processes 11/23/2009 11/23/2009 the planning period against the base forecasts (regular history) in the selected comparable event periods. 4. Review, Adjust and Approve Promotional Forecasts Once the initial incremental forecast is computed, the forecaster will need to approve the quanitities. The preferred method would be to review the combined regular and promotional forecasts and make the necessary adjustments. Subsequently, the quantities will be approved prior to inclusion in requirements planning. 6. Review and Adjust Forecasts The system generated forecasts are to be considered initial estimates. Since the computation of a forecast based on history is driven by a series of assumption, the forecast is only as valid as those assumptions. In addition, there are marketing and merchandising considerations that are normally not tracked with the history. As a result, forecast inaccuracies can occur. It is the responsibility of the individual charged with sales planning for the item (normally a buyer or product manager) to review the history and the forecast and apply whatever adjustments are necessary to compensate for the lack of sophistication. Newer forecasting techniques are better able to take more of these factors into consideration. Expert systems are just beginning to be applied successfully to this area. Future forecasting should benefit greatly from these enhanced tools. 7. Manage Forecasts In addition to the review and adjustment of the forecasts for individual items, it is normally necessary for the system to monitor and report forecast error. This is the cumulative deviation of the forecasted demand to actual sales. When this "tracking signal" exceeds a preestablished cutoff, it is necessary to reevaluate the forecast model. This can be done manually, by a forecasting analyst or the system can be asked to refit the model to the most recent history. 2. Customer Managed Replenishment This section considers the processes associated with developing customer purchase requirements. The forecast is used to determine the Just-in-Time requirements for purchasing. The purchase planning process then modifies the requirement based on economic incentives. 1. Replenish Customer Distribution Facility There are two options in order fulfillment for most retailers. Product can either be sent directly to stores or to a distribution center. The benefits of Direct Store Delivery are usually in terms of compressing the order cycle. However, a difference in the mode of transportation (i.e. less than truck load shipping) could offset this advantage. Warehousing provides the ability to serve store more rapidly by allowing them rapid replenishment against the distribution center inventory. 1. Establish Warehouse Service Level Goals While 100% in-stock is the goals of all operations, the cost of approaching full service on every product is prohibitive. Most businesses will establish differing goals based on the criticality of the particular item and the cost associated with maintaining safety stocks. 1. by Ite m A commonly used practice is to set a "weeks of supply" target for safety stock. This, however, does not necessarily result in consistent service levels across products. Page 6
  • 7. Normative Model Project - Replenishment Processes 11/23/2009 11/23/2009 Instead, the service level goals should result in the establishment of a safety stock level covers expected consumption between the placement of an order and the receipt of the order. The variance in the demand for a particular item is the critical measurement. Two items with the same average weekly demand can have vastly differing deviations. Therefore, to achieve the same service level will require different stock levels. The second component of variance is the fluctuation in delivery time. When a particular vendor has an erratic history of lead time, there is a greater need for maintaining higher stocking levels. By implementing procedures to reduce and standardize the replenishment cycle, this component of variance can be significantly decreased, allowing inventory reduction. 2. by Category Since each item maintains its own inventory, each should maintain an individual service level. However, for ease of management, it is common to establish groupings of items to reduce the effort associated with maintaining stocking levels. The most popular classification method categorizes items based on total dollar volume. Typically, 15 to 20% of the items account for 80% of the sales. These are "A" items. The next cut-off are the "B" items that accumulate to 95% of sales, approximately 30 to 35% of the total items. The remaining 50% of the items will account for 5% of total sales. These are the "C" items. In some cases, the last 1% will be handled separately, in some cases as custom orders. These are sometimes referred to as "D" items. In most instances, service level goals for "A" items is highest, then "B" and "C" respectively. The actual level will be determined based on either a customer service goal or an inventory value analysis. 2. Determine Costs of Procurement The first component of the cost merchandise is the determination of the cost of acquiring merchandise. In most instances there are several elements to this cost. 1. Determine Purcha se Orde r Cost The cost of placing a purchase order is based on the allocation of the overhead costs associated with managing the Purchasing and Distribution processes as well as the directly identifiable costs for each item ordered. Even though there be a portion of this cost that will vary based on the quantity ordered, this is not normally factored into the PO costs. In a continuous replenishment environment, this cost is significantly reduced. 2. Compute Purchase Price The cost of acquiring merchandise from a vendor is either based on a pre-established agreement, a negotiated contract or a price sheet or schedule may be used. The purchase price is the primary factor in determining inventory costs and gross margins. Therefore, the purchase price is critical to retail pricing decisions and the ability to complete in a particular market. 1. Determine Unit Cost The cost of an individual item is taken from whatever agreement is in effect. Without any quantity discounts or price bracket structures, this represents a simple lookup procedure. In the event of a quantity driven price structure, multiple items must be grouped to determine the appropriate price for this specific acquisition. 2. Determine Extended Cost Page 7
  • 8. Normative Model Project - Replenishment Processes 11/23/2009 11/23/2009 Once the individual unit costs have been identified, each line item's total extended purchase price can be computed by multiplying the unit cost times the number of units. 3. Apply Off-Invoice Allowances In those instances where vendors have negotiated agreements that provide special discounts, these are applied to the total invoice. However, for purposes of evaluating order quantities, the cost should reflect any off-invoice allowance. 3. Determine Inventory Costs The cost of inventorying product is a function of the value of the product and the time the goods remain in inventory. It is not necessary to compute a cost for every unit of every stock-keeping unit (SKU). Based on the rate-of-sale, the on-hand quantity will represent a number of weeks of supply. The inventory cost can be computed by multiplying one-half of this quantity by the unit cost, including all inbound allocations, and applying the annual inventory carrying cost. For example, if 100 units were purchased of an item with a weekly demand of 20 units, the purchase would represent an incremental five weeks of demand. Given a planned inventory level of 30 units at the time of receipt, the average unit would be retained in inventory during the depletion of the purchased quantity would be two-and-one-half weeks plus the current on-hand. This is equivalent to four weeks. If the inventory carrying cost, consisting of storage and cost of capital, is equivalent to 24% annually, the charge for these goods would be 80 * .24 * (4/52) * unit cost. Assuming a purchase cost of $30 and an additional $1.75 in internal handling costs. the inventory cost for the order would be estimated as $47 on a purchase of $3,000. 4. Develop Inventory Plan The inventory plan is based on filling the requirements by time period based on the net item availability. This is represented by a time-phased inventory analysis determines the project available stocking levels by period. Then once a requirement has been identified, an analysis is conducted to determine how much to order from the vendor. 1. Imple ment Order Models The primary model in use today is a "Just-in-time" that attempts to meet the requirement developed in the MRP analysis. It is possible that other models might be more effective is reducing the total cost of goods sold and delivering desired service levels. 1. Develop Order Models As part of the purchasing decision process, it is important to review alternative rules for purchasing and select those rules that best service the business. The chosen model could differ by item, vendor, category, etc. However, purchasing and inventory management should not be a function of the sales channel. Instead, the meeting of requirements will apply to all channels. 1. Assess Order Models Other order models include: economic order quantity for individual items; joint replenishment for vendors with multiple items; order-up-to target inventory; and min- max inventory.. 2. Select Optimal Model(s) In all probability there will not be a single "best" model, but several that will be applied based on existing parameters including: cost, rate-of-sale, inventory redundancy, vendor lead time, risk, etc. Page 8
  • 9. Normative Model Project - Replenishment Processes 11/23/2009 11/23/2009 2. Validate Order Models It is to review and update these replenishment models on a recurring basis. Changes in lead-time, cost structure or forecast can serve to distort the success of the particular model. In additiion, capacity considerations may alter the economics of the order methodology. 2. Determine Time - Phased Require men ts The determination of net item requirements can be done on a weekly or daily basis. While daily provides precision, the forecast accuracy at the daily level is questionable. Additionally, the variation in delivery would make analysis at the daily level open to scrutiny. In either instance, net requirements would need to be computed out for the established time horizon. This horizon is determined by the lead time and the opportunities for economic advantage. If the projected available inventory of an item for the period reflecting the lead time is negative, an order must be placed in the current period to offset the planned shortage. By limiting the analysis to the lead time, opportunity buying is severely restricted. However, by extending the review period a number of time intervals beyond the minimum, some economic gains are possible. 1. Calculate Review Stock The review stock is the expected volume to be shipped to stores for the days between the initiation of the analysis and the release of the purchase instructions. SPEC Review Stock = Sum of the forecasts by day (week / 5) for the number of days until the purchase advise (or PO) is released to the vendor. 2. Calculate Lead Time Stock The lead stock is the expected volume to be shipped to stores for the days between the release of the purchase instructions to the vendor and the receipt of the shipment at the distribution center. In the case of a consolidated shipment, this is the time to get the merchandise to its final destination. If the instructions indicate at ship-to-arrive date extending later than the lead time, this will represent a revised lead time. Lead Stock = Sum of the forecasts by day (week / 5) for the number of days between the time the order is released to the vendor and is received at the DC. This is based on either an historical average or an override based on an agreement with the vendor. 3. Calculate Safety Stock Safety Stock is the quantity necessary to insure against stock outs between the time of the order analysis and the receipt of the order do to potential variances in demand and delivery time. The Safety Stock computation is based on applying the service level goal to the forecasted movement based on a normal distribution with the mean equaling the forecasted consumption and the variance derived from the historical variance in sales aggregated to distribution center level and the variation in vendor delivery time. SPEC The adjusted lead time days for safety stock purposes should be equivalent to the greater of number of days necessary to meet the service level requirement based on the Normal distribution with a mean of the historical lead time or the revised lead time. Page 9
  • 10. Normative Model Project - Replenishment Processes 11/23/2009 11/23/2009 The safety stock is the statistical bound indicated by a normal distribution with a mean of the sum of the lead stock plus review stock and variance equal to (the historical weekly variance for the aggregate warehouse demand / 5) * (Review Days + Adjusted Lead Time Days) 4. Compute Available Inventory / Requirement by Period Available Inventory is the total on-hand less the quantity reserved for safety stock. The starting available inventory is computed and represents the initial balance for Time- Phased Inventory Planning. SPEC Available-Beginning-Inventory (0) = Total-On-hand - Safety-Stock for N > 0 Available-Beginning-Inventory (N) = Available-Ending-Inventory (N-1) Available Ending Inventory (N) = Available Beginning Inventory (N) + SUM(all inbound shipments of the item scheduled to arrive during the period) - SUM(Group-Item-Week- Forecasts) for the location. If Available-Ending-Inventory < 0, then Requirement = (Available-Ending-Inventory * -1) and Available-Ending-Inventory = 0 (Note: from this point forward, the Available-Inventory will be 0) 5. Identify Planned Order Requirement for Lead Time A future requirement must be met with an order place far enough ahead of the requirement to allow the merchandise to be delivered at the required time. By backing up the numbering of periods representing the Review Time and the Lead Time, an order can be placed at the appropriate juncture. In the ideal situation, the recommended order would be generated immediately and presented for review and approval. This represents the Just-in-Time requirement. SPEC For each period with a requirement > 0, the planned requirement for the period representing the day of the outage - the sum of the lead time and review time represents the period in which the order should be placed. If the planned requirement date is prior to period 0, the planned requirement should be applied to period 0. 3. Compute Recommended Replenish men t Orde r Quantit ie s Once the "Just-in-time" requirements for a vendor have been determined, the appropriate order model can be used to calculate the recommended buy for each item in the order. 1. Just-in-Time Models In situations where their is a relatively high inventory cost, perhaps the warehouse is at capacity, or when there is no incremental cost for placement of an order and no volume-related discounts, the recommended order method should focus on the minimum quantity necessary to meet the requirement. SPEC The order quantity = the planned requirement rounded up for the nearest case pack. If an order minimum exists, the order quantity = the minimum of the order minimum and the case pack multiple. 2. Economic Order Quantity Page 10
  • 11. Normative Model Project - Replenishment Processes 11/23/2009 11/23/2009 When a single item is being purchased from a particular vendor, the objective should be to minimize the total cost function including purchase price, procurement cost and inventory carrying costs. The EOQ is the quantity for a fixed purchase price that yields the minimum total cost of goods. SPEC EOQ = the square root of [(2 * (SUM of the next 13 weeks forecast)*4) * the cost of placing an order)/ annual inventory carrying cost per unit] Inventory Carrying Cost per unit equals the purchase price * the interest rate. The order quantity = EOQ rounded to the nearest case pack > than JIT requirement. (Note: if EOQ is less than JIT requirement, the order period should be shortened and item reviewed more often) 3. Bracket Pricing Analysis Based on quarterly volumes, a recommended review period can be developed that will result in the lowest cost of goods. This is accomplished by grouping all products that can be combined for price discount and projecting the cost of goods based on the attainment of each bracket. As the review period increases, the order quantity will grow to reach the next bracket. At some point, the additional carrying and storage costs of a larger buy will offset the discount. Once this review period has been determined, the buy quantity will attempt the equalize the weeks supply for all items in the group. Should an individual item sell faster than anticipated, it may be necessary to place an order early. In this case, all products from the vendor should be reviewed and the period reinitialized. 4. Min-Max Models In those situations where orders are being shipped directly to stores or when the customer warehousing configuration is constrained for space, Min-Max models may prove effective. These models establish a reorder point equivalent to the minimum desirable inventory level. Normally this is the greater of the statistical safety stock and the shelf presence quantity (the minimum on hand quantity necessary to meet effective merchandising requirements.) The order quantity is based on demand. However, the objective here is to order only what can be stored in the primary location. This avoids the double handling associated with establishing multiple stocking locations and reduces the possibility of shrink by limiting physical stock to a single position. 5. Hybrid Models The "best" economics can sometimes be achieved through combining more than one of the above models. For example, every order with to a vendor offering a quantity discount should have consider the implications of reaching the discounts. The utilization of joint replenishment analysis will normally result in an opportunity to lower the cost of goods. 4. Consider the impact of inbound consolida tion By aggregating purchase quantities for multiple warehouses, additional quantity discounts may be attainable. In these cases, however, the it is necessary to assess the tradeoff of these savings against the increased handling and transportation costs that would result from double shipments - first into the consolidated distribution center and subsequently shipped with other goods to the warehouse servicing the store. Additionally, these orders might need to be placed earlier to allow for the reshipment. Page 11
  • 12. Normative Model Project - Replenishment Processes 11/23/2009 11/23/2009 5. Determine promot ional buys for replenish ment merchandise The above models can be considered "pull" models. That means that stores (or a central replenishment coordinator managing the store inventory) request merchandise based on forecasted demand and current inventory. However, the impact of advertising, promotion and display leads to a need to have product managers or buyers dictate quantities in the store. This "push" method is based on the assumption that promotional activity will generate incremental demand and require the stores to increase their inventory on a temporary basis to satisfy this demand. The key steps in the development of the promotional purchase include: 1. Planning the promotion There are many variables that will influence the success of a promotion, only some of which can be controlled. In particular, sales pricing, advertising, display and signage are among the controllable variables. However, weather, competition and economic factors are not controllable, particularly when promotions need to be planned four to six months in advance. 2. Forecasting the Event-Item Sales While replenishment demand can be forecasted statistically, promotional demand is more elusive. The impact of promotions is to either "steal" market share from competition (brands or retailers) or encourage consumers to forward buy. The former can be considered incremental sales activity and the profits generated attributable to the promotion. The primary advantage to customer forward buying is to improve cash flow by accelerating sales. However, it is likely that such a sale will result in a reduction of regular replenishment following the promotion. The primary inputs to the promotional forecasting process are the history related to prior events including the attributes of the promotion and the resulting incremental sales, and the regular replenishment sales. The regular sales provide the impact of seasonality and trend of the items demand on the promotion (e.g. the sales of a seasonal item will tend to follow the demand pattern of replenishment sales.) 3. Reviewing local market considerations that could influence these sales Regional and store management are aware of factors that could distort the forecast in their market. Local events, retailer competition and brand preference may result in the need to modify the sales forecast based on local intelligence. In addition, their may be local promotions that will influence the forecast of the incremental sales generated by a national ad campaign. 4. Developing a distribution plan for this merchandise Once the store demand pattern has been established, the distribution alternatives can be assessed. Options included centralized distribution, regional warehousing and direct store delivery. Based on the economics, a distribution pattern is determined. 5. Assessing the impact of Carry-over on inventory One of the negatives that will occur with "push" ordering is the tendency to create carry- over. When the sell-thru of the promotion does not meet the forecast at a particular store, the resulting overstock can be significant. This is especially true in those instances where replenishment sales are a fraction of promotional sales. The alternatives in these instances are either to hold onto the merchandise until it is sold off in regular selling activities or additional promotions, return the merchandise with vendor permission, or mark down the goods for sale at the store. Page 12
  • 13. Normative Model Project - Replenishment Processes 11/23/2009 11/23/2009 6. Evaluate Invest men t Buy Opport unit ie s There are normally identifiable time periods when a significant reduction in cost of goods can be attained. Specifically, these instances relate to pending price increases and limited time deals. Each of these opportunities should be evaluated to determine whether to place a forward buy and, if so, how much to purchase. The key factors involved in this analysis include the amount of the potential discount, cost of storage, the risk of over buying and availability of storage capacity. The criteria to assess this form of investment is to consider the return on inventory investment for the buy quantity as compared to executing a normal purchase plan based on one of the replenishment models. 2. Replenish Stores 1. Establish Criteria for Direct Store Delivery In some instances, (e.g. bulk product, paper goods, special promotions, etc.) it is economically advantageous to bypass the customer distribution facility and move goods directly to stores. This would be a joint decision between the vendor and the customer. Determine Inven tory Targe t In this scenario, the current inventory balance and sales forecast by store would need to be determined. This would establish a target inventory level for the particular product in a specific store. Determine Order Minimums Transportation economics are the primary driver behind determining which stores have sufficient demand to warrant direct shipment of a particular order. The total cost analysis needs to consider the trade-off between the elimination of the interim storage at the customer DC versus the added transportation cost associated with smaller, usually less than truckload, shipments. Evaluate Lead Time s In some instances, the lead time to distribute product may govern whether shipment through a customer distribution facility is viable. If the time to receive and reship the merchandise through the customer DC increases the risk of not having product at the store in time for a sales event, direct shipment may be necessary. However, in some cases LTL direct shipments may actual require a longer leadtime than going through a customer facility. 2. Compute Store Forecast Most replenishment models require an estimate of the rate of sale to be accurate. Because individual store movement may not be significant enough to produce a valid statistical forecast, However, on a week-to-week basis, the variance in the demand for most items is relatively staple, at least during a particular season. The two methodologies that can be used for in-store forecasting are: Computing store-item rate- of-sale and proportioning the store-group-item forecast for the particular period. Store Rate of Sale By using a moving average (or weighted average) the in-store movement can be used to create an adaptive rate-of-sale that will respond on a somewhat diminished to demand shifts. This model can be enhanced to include seasonal weighting factors managed at a category level. Page 13
  • 14. Normative Model Project - Replenishment Processes 11/23/2009 11/23/2009 SPEC 1 (moving average) Forecast = Weekly Rate-of-Sale = Cumulative movement for the last n weeks / n; where n = a number weeks recommended to be between 4 and 13. SPEC 2 (weighted moving average) Forecast = Weekly Rate-of-Sale = (Last Week's Sales * k ) + (Last Week's Forecast * (1-k)); where k = a weighting factor < 1, normally between 0.1 and 0.5. SPEC 3 (Forecast enhanced for seasonality) Compute seasonal indices. For all products in a defined category retain accumulate four-week raw sales for the last year (13-periods). Seasonal index by period = 13 * Period Sales / Total Sales Factor weekly sales by seasonal index. Prior to computing weekly rate-of-sale divide last week's actual sales by the seasonal index for the period. After computing the normalize rate-of-sale using either method, multiply the result by the seasonal index for the planning period. Apport ionment of Store - Group Fore cast The store-group forecast includes seasonality, trend and other factors. Since the proportion of the Store-Group by Item is being maintained, this ratio can be applied to the group forecast to yield a store forecast. The downside is that this method will be difficult with slow moving items where the movement is less than two per store per week and the factor itself may not responsive to demand shifts. The advantage to this method is that individual store-item-week historical data need not be maintained. SPEC Store-Item-Week Forecast for Period (N) = Store-Group-Item-Week-Forecast for Period (N) * Store-Item fraction of Group. 3. Determine Store Recommended Order Quantities Whether the store demand for a particular item is being filled directly from the vendor, through a distributor or from the company warehouse, the objective of managing store inventory is to maximize inventory while minimizing out of stock situations. Two key components control store replenishment: the reorder point and order quantity. Determine Store Replenish men t Require men ts Replenishment at the store refers to restocking. The frequency of the restocking is related to the sales volume. A high volume customer (e.g. grocery) might restock the shelf nightly. A specialty retailer would be expected to restock less often, potentially weekly. When to place a replenishment order is determined by the lead time and safety stock requirement. The objective is to be at the shelf minimum when the new order is received at the store. The minimum provides the merchandising shelf presence and serves as the safety stock to meet demand surges. In most cases, because of the wide mix of products that need to be replenished, a single item order quantity optimization is not productive. Instead, the objective should be to manage the inventory on a JIT basis adapted by physical constraints. These include man power requirements for receiving and put-away, case pack considerations, truck load options, etc. The actual determination of the reorder point and order quantity can be performed by a "policy model". a set of rules that will, in general, meet requirements while providing some economies to the process. Example of policy models include: Page 14
  • 15. Normative Model Project - Replenishment Processes 11/23/2009 11/23/2009 Order-up-to Model This method is used to establish a ceiling for store inventories. A maximum is computed for each item and when the order review is performed, the system recommends a buy to reestablish the inventory level to the target. This model has the advantage of enabling a retailer to control store turn. The maximum is established based on a number of days supply. Therefore, if the goals were thirteen turns and the lead time was one week, a 4.5 week target could be implemented. This means that the inventory (on average) would fluctuate between a maximum of five weeks at the time of the order placement to 3.5 weeks when the next order is received. SPEC Let T = the turn goal Let L = the lead time in weeks On Hand Target = (52/T) - L/2 weeks supply Recommended Order Quantity = Target - Actual On-hand (Rounded up to Multiple) Rate-of-Sales Model When the shelf presence consideration is not appropriate or when item movement is stable and inventory levels are acceptable, a simpler model could be invoked. The basis for this model is that when sales have accumulated to the order multiple, an order is placed. The problems with this model are the inability to reduce inventory and the potential for outs if demand accelerates. SPEC Set a minimum for the item at demand over standard lead plus N days supply. Initialize the counter to current on-hand - minimum When sales occur, reduce counter on a one-for-one basis When counter = 0: place order for multiple. Reinitialize counter to multiple. Economic Interval Model One problem with both the above models is the propensity to reorder each item that has any sales during the prior period. This can result in excessive order lines and increased warehouse fulfillment costs as well as store putaway costs. One option is to add additional supply for items where the added inventory value is minimal. This will increase the interval between orders for some items reducing the distribution expense while not significantly decrease overall inventory turn. This method relies on the establishment of a minimum order line cost. This value would be established based on a separate analysis or initially set to 0 and adjusted over time. SPEC Set minimum order line to $N If recommended order quantity for an item < $N, increase the order to the order multiple > or = $N. If the rate-of-sale model is used, the reorder quantity should be modified to use this quantity as the counter. Determine Store Promo tional Demand For planned sales events, individual stores will require additional merchandise. The particular quantity is subject to several factors including pricing, advertising, display Page 15
  • 16. Normative Model Project - Replenishment Processes 11/23/2009 11/23/2009 consideration and the duration of the sale. Based on comparable item sales events, a distribution pattern can be selected that best matches these characteristics to stores. Establish Store Minimums Frequently promotional quantities need to hit case or pallet levels. In these instances, stores participating in the sales event either need to order up to this minimum or stock the goods at everyday costs for less than case quantities if applicable. Compute Orde r The order quantity will be based on the number of order multiples that will be necessary to meet demand with the minimum total cost including such considerations as promotional carryover, time until the next promotion, carrying cost, etc. 4. Adjust Store-Item Balances Once the store-by-store distribution has been established for a product or multiple products, the individual quantities may be reviewed and potentially adjusted for other considerations. These may include preset displays, transportation minimums and maximums, risk, product limitations, and more. 3. Vendor Managed Replenishment This option requires much less effort on the part of the customer. In effect, the vendor assumes responsibility for the customer's replenishment. As such, this could be accompanied by the implementation of a contract pricing philosophy that minimizes the incentives for volume purchases. Otherwise, it is incumbent on the customer to audit the order quantities and prices to ensure the processing is in their best interests. In return for this additional responsibility, the vendor receives the ability to improve the fulfillment cycle. Last minute, rush orders, along with their inherent high cost and inefficiency, are significantly reduced when the vendor has access to retail inventory and sales. Two sub-alternatives exist in this case. In those instances when the customer wishes to perform their own forecasting, better enabling management insight, the customer will send a current forecast to the vendor. If this is not the desired position, the vendor could, instead, receive actual item movement from the point-of-sale and develop a sales forecast. For definition purposes, there are four levels of Vendor-Customer partnerships in use A. Joint Planning This involves a period sharing of information including merchandising, marketing plans, advertising and product introductions. At these session, the two organization work together to establish estimated volumes for the coming period. These become a guideline for planning replenishment, but not a guarantee. B. Automated Sales Tracking The next step involve providing detail sales information in the form of Point-of-sale item movement or customer warehouse withdrawals. From this information, in conjunction with promotional planning, the vendor can gain a more detailed insight into the customer requirements. However, the customer is not directly influenced by this process. The data is normally communicated either via EDI or a third-party data base such as Retail Link. C. Recommended Purchase Orders Page 16
  • 17. Normative Model Project - Replenishment Processes 11/23/2009 11/23/2009 When the vendor can demonstrate success in planning customer requirements, the next logical progression is to influence the customer ordering by providing purchase recommendations that can be reviewed and revised by the customer. This usually involves an EDI transmission link. As an alternative, more sophisticated customers may provide sales forecasts or requirements. D. Automated, Vendor-Managed Replenishment The highest level of partnering involving management of inventory levels and replenishment by the vendor. 1. Establish Terms for Automated Replenishment Prior to the initiation of vendor-managed replenishment, the customer needs to be assured that the relationship will be to their advantage. Primarily, they need to be confident that their cost-of-goods will improve, or at least remain constant, that their inventory levels will not increase and that their in-stock goals are met. The primary means for achieving these objectives without impacting the vendors margin include: 1. Consignment Sales By not billing the customer for the goods until they have sold the product, the customer should be ambivalent to order size, providing they have sufficient storage space in their distribution centers and/or stores. In some instances, this could require acquisition of outside warehousing. These expenses would need to be negotiated. 2. Extended dating of invoices The customer could be given an additional 30 to 90 days to pay for the goods. This would provide the vendor with the ability to move advance quantities to customer without entering into a consignment arrangement. 3. Contract Pricing In those instances where customers are typically given temporary discounts to stimulate additional purchases, they have an incentive to control the timing of orders and receipts. This may be counter to the vendor's best interest. To offset this incentive, it may be possible to negotiate an everyday exchange price that gives the customer a comparable overall cost. 4. Service Guarantees In many instances, the assurance of order timeliness and order accuracy are used as incentives to customers. 2. Manage Automated Replenishment to Customer DC In a vendor managed environment, there should be a direct relationship between the forecast and the replenishment order quantity. The methodology for order quantity determination need not consider customer purchase advantage except on an override basis. The primary order model will be a just-in-time model adjusted for vendor lot size economics. The opportunity to virtually eliminate finished goods inventories to support this customer base is real. 1. Determine Planned Customer Requirements by DC Utilizing the forecast and the computed inventory balance, a time-phased inventory projection can be developed for each location and item being supplied. This projection, Page 17
  • 18. Normative Model Project - Replenishment Processes 11/23/2009 11/23/2009 with the added insight into replenishment lead times, will enable the vendor to confidently replenish a customer distribution center. 2. Compute Recommended Replenishment Order Quantities As in the customer managed replenishment methodology, the net item requirement serves as the minimum quantity necessary to meet forecasted demand and satisfy service level requirements. However, economic analysis can be used to selectively increase the order quantities to take advantage of volume discounts and transportation and handling economies of scale. The models to be considered include: 1. Just- in- Time Models In situations where there is a relatively high inventory cost, perhaps the warehouse is at capacity, or when there is no incremental cost for placement of an order and no volume-related discounts, the recommended order method should focus on the minimum quantity necessary to meet the requirement. 2. Econo mic Order Quantity When a single item is being purchased from a particular vendor, the objective should be to minimize the total cost function including purchase price, procurement cost and inventory carrying costs. The EOQ is the quantity for a fixed purchase price that yields the minimum total cost of goods. 3. Bracket Pricing Analysis On the basis of quarterly volumes, a recommended review period can be developed that will result in the lowest cost of goods. This is accomplished by grouping all products that can be combined for price discount and projecting the cost of goods based on the attainment of each bracket. As the review period increases, the order quantity will grow to reach the next bracket. At some point, the additional carrying and storage costs of a larger buy will offset the discount. Once this review period has been determined, the buy quantity will attempt the equalize the weeks supply for all items in the group. Should an individual item sell faster than anticipated, it may be necessary to place an order early. In this case, all products from the vendor should be reviewed and the period reinitialized. 4. Min- Max Models In those situations where orders are being shipped directly to stores or when the customer warehousing configuration is constrained for space, Min-Max models may prove effective. These models establish a reorder point equivalent to the minimum desirable inventory level. Normally this is the greater of the statistical safety stock and the shelf presence quantity (the minimum on hand quantity necessary to meet effective merchandising requirements). The order quantity is based on demand. However, the objective here is to order only what can be stored in the primary location. This avoids the double handling associated with establishing multiple stocking locations and reduces the possibility of shrink by limiting physical stock to a single position. 5. Hybrid Models The "best" economics can sometimes be achieved through combining more than one of the above models. For example, every order with to a vendor offering a quantity discount should have consider the implications of reaching the discounts. The utilization of joint replenishment analysis will normally result in an opportunity to lower the cost of goods. Page 18
  • 19. Normative Model Project - Replenishment Processes 11/23/2009 11/23/2009 6. Econo mic Lot Size From the point-of-view of the vendor it is desirable to ship product in accordance with a production schedule that would minimize finished goods inventory and shorten the replenishment cycle. To accomplish this the vendor would attempt to fill orders in accordance with the production runs for the specific products. In some instances the customer might get a quantity that exceeds the JIT demand. However, this would allow all orders to be filled more rapidly and what the customer lost in terms of minimum inventories would be offset by the reduction in stocking levels to support protracted order lead times. 3. Provide Customer Review and Adjustment Facility Since these quantities are intended to replenish customer inventories, it is prudent to allow customer management to review the pending delivery prior to its release. This, in effect, is the approval of the purchase quantity by the customer. 4. Maintain Customer DC Inventory Levels In order to maintain the accuracy of the time-phased inventory, up to date inventory levels will need to be communicated to the vendor. Additionally, DC-to-store billings will be needed to indicate the decrement to the DC inventory levels. Shipments to the customer from the vendor will be established. 3. Manage Automated Direct Store Delivery In some instances, (e.g. bulk product, paper goods, special promotions, etc.) it is economically advantageous to bypass the customer distribution facility and move goods directly to stores. 1. Establish Store Template for DSD In those instances where direct store delivery is a viable option, an initial distribution pattern based on store percent of market for the selected product will need to be generated. Additionally, rules will need to be developed to establish a cut-off or other qualifying criteria for direct store delivery. 2. Adjust Store-Item Balances In some instances the delivery quantities to individual store locations will need to be adjusted for transportation considerations, promotional considerations or economics. 3. Provide Customer Review and Adjustment Facility Since these quantities are intended to replenish customer inventories, it is prudent to allow customer management to review the pending delivery prior to its release. This, in effect, is the approval of the purchase quantity by the customer. Page 19