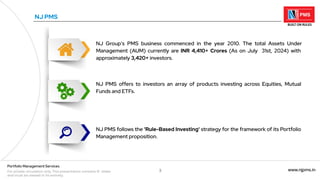
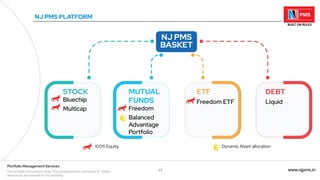
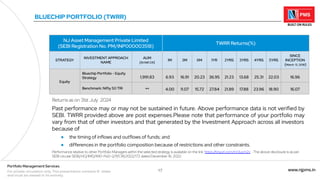
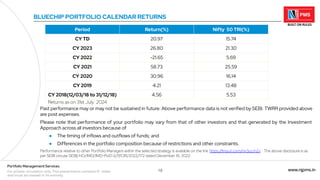
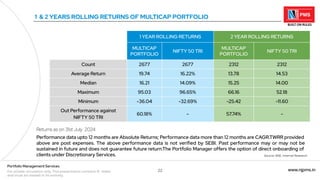
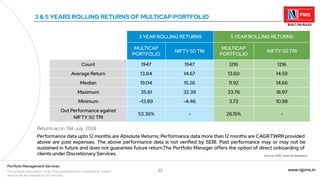
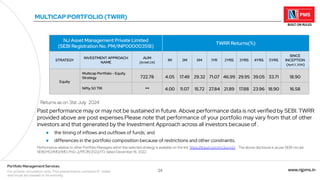
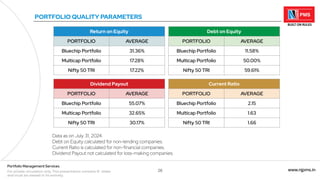
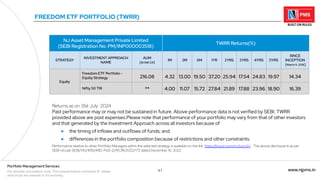
1 www.njpms.in
Portfolio Management Services
For private circulation only. This presentation contains 51 slides
and must be viewed in its entirety.
A RULE-BASED
PORTFOLIO MANAGER
JULY 2024
Portfolio Management Services
For private circulation only. This presentation contains 51 slides and must be viewed in its entirety.
www.njpms.in
2 www.njpms.in
Portfolio Management Services
For private circulation only. This presentation contains 51 slides
and must be viewed in its entirety.
ABOUT NJ GROUP
ONE OF
INDIA'S LARGEST
MUTUAL FUND DISTRIBUTOR
A BUSINESS BUILT ON TRUST
Our mission is to transform the lives of people across India by ensuring their financial well-being. With a humble
beginning in 1994, we are privileged today to impact the lives of countless families. A reputed name in the financial
services industry, NJ Group today is expanding its horizons into diverse businesses.
We are driven with the passion for transforming lives, and we value trust above everything.
We are BUILT ON TRUST
Started
1994
Employees
2062+
Active Distributors
41,001+
Assets Under Management
₹2,37,051*+ Crore
*Asset managed by various AMCs, mobilised by NJ | As on July, 2024
3 www.njpms.in
Portfolio Management Services
For private circulation only. This presentation contains 51 slides
and must be viewed in its entirety.
NJ Group's PMS business commenced in the year 2010. The total Assets Under
Management (AUM) currently are INR 4,410+ Crores (As on July 31st, 2024) with
approximately 3,420+ investors.
NJ PMS
NJ PMS offers to investors an array of products investing across Equities, Mutual
Funds and ETFs.
NJ PMS follows the 'Rule-Based Investing' strategy for the framework of its Portfolio
Management proposition.
4 www.njpms.in
Portfolio Management Services
For private circulation only. This presentation contains 51 slides
and must be viewed in its entirety.
A different approach to investing
RULE-BASED INVESTING
DISCIPLINED
ACTIVE
RETURN
PASSIVE
INVESTING
TRADITIONAL
ACTIVE INVESTING
DISCIPLINED
MARKET
RETURN
DISCRETIONARY
MANAGEMENT
ACTIVE
RETURN
5 www.njpms.in
Portfolio Management Services
For private circulation only. This presentation contains 51 slides
and must be viewed in its entirety.
UNDERSTANDING RULE-BASED INVESTING
Select time tested
attributes
Determine criteria
to identify these
attributes
Specify measures
and limits
Test and validate
rules for efficiency
Combine
complementary rules
to form a protocol
Use the protocol to allocate assets,
select stocks and assign weights
DEFINE
RULES
6 www.njpms.in
Portfolio Management Services
For private circulation only. This presentation contains 51 slides
and must be viewed in its entirety.
NJ's INVESTMENT PROCESS - STOCK SELECTION
FACTOR
BASED
SELECTION
Market
Factor
Momentum Volatility Value Quality
Fundamental
Factor
PORTFOLIO
7 www.njpms.in
Portfolio Management Services
For private circulation only. This presentation contains 51 slides
and must be viewed in its entirety.
BENEFITS OF RULE-BASED INVESTING
Selection of securities
is on a predefined set
of rules, eliminating
human bias.
The investment
process is pre-tested
for performance and
volatility in various
scenarios.
The Portfolio stays
"True to Label" at all
times.
8 www.njpms.in
Portfolio Management Services
For private circulation only. This presentation contains 51 slides
and must be viewed in its entirety.
NJ PORTFOLIO MANAGEMENT SERVICES
9 www.njpms.in
Portfolio Management Services
For private circulation only. This presentation contains 51 slides
and must be viewed in its entirety.
CONVENTIONAL PMS MECHANISM
Single
Product
Approach
Return
Focused
Equity or
Debt
Orientation
Discretionary
Management
Expensive
Proposition
10 www.njpms.in
Portfolio Management Services
For private circulation only. This presentation contains 51 slides
and must be viewed in its entirety.
5 PILLARS OF INVESTING AT NJ PMS
CUSTOMIZABLE
Solution oriented
RISK AWARE
Manages risk efficiently
DIVERSIFIED
Offers multiple asset
classes
RULE-BASED
Disciplined investing
COST EFFECTIVE
Offers flexible cost
solutions
11 www.njpms.in
Portfolio Management Services
For private circulation only. This presentation contains 51 slides
and must be viewed in its entirety.
NJ PMS PLATFORM
NJ PMS
BASKET
STOCK
Bluechip
Multicap
MUTUAL
FUNDS
Freedom
Balanced
Advantage
Portfolio
ETF
Freedom ETF
DEBT
Liquid
Dynamic Asset allocation
100% Equity
12 www.njpms.in
Portfolio Management Services
For private circulation only. This presentation contains 51 slides
and must be viewed in its entirety.
BLUECHIP PORTFOLIO
13 www.njpms.in
Portfolio Management Services
For private circulation only. This presentation contains 51 slides
and must be viewed in its entirety.
BLUECHIP PORTFOLIO - OBJECTIVE & INVESTMENT APPROACH
Investment Objective:
● To generate capital appreciation over a long term by investing in equity and equity related
instruments.
The investment approach is as summarised below :
● Rule-based stock selection
● Focus on companies with superior quality over a long period with high ROE and cash rich companies
with high dividend paying capabilities
● Preference for companies with lower volatility in returns and avoid loss making companies
● Portfolio would be reviewed for re-balancing on a yearly basis
● Allocation would be 80% to 100% in equity and equity related securities and 0% to 20% in debt
oriented mutual funds, cash, liquid funds and arbitrage funds.
For detailed risk factors associated with investment approach, please refer to the Disclosure Document available on our website www.njpms.in
14 www.njpms.in
Portfolio Management Services
For private circulation only. This presentation contains 51 slides
and must be viewed in its entirety.
BLUECHIP PORTFOLIO - SELECTION & ALLOCATION
NIFTY 500 Universe
Eliminate Bottom Companies with Highest Volatility
Select High Quality Companies with high ROE and Dividend
Payout Ratio
Select Top 20 Reasonably Priced Companies
● Model portfolio based weights allocated with a maximum threshold of 8% per stock at the
time of rebalancing and 10% during the period of holding
● Portfolio would be reviewed for re-balancing on a yearly basis which would reduce churn
while still providing high risk-adjusted returns based on model backtesting results
● This investment approach is 100% equity and the relevant benchmark is NIFTY 50 TRI.
15 www.njpms.in
Portfolio Management Services
For private circulation only. This presentation contains 51 slides
and must be viewed in its entirety.
1 YEAR ROLLING RETURNS 3 YEAR ROLLING RETURNS
BLUECHIP
PORTFOLIO
NIFTY 50 TRI
BLUECHIP
PORTFOLIO
NIFTY 50 TRI
Count 1968 1968 1238 1238
Average Return 17.87 16.50% 20.09 17.56
Median 10.49 13.14% 19.71 16.66
Maximum 94.71 96.65% 32.08 32.39
Minimum -22.40 -32.69% 10.43 10.41
Out Performance against NIFTY
50 TRI
51.27% - 63.25% -
1 & 3 YEARS ROLLING RETURNS OF BLUECHIP PORTFOLIO
Returns as on 31st July 2024
Performance data upto 12 months are Absolute Returns; Performance data more than 12 months are CAGR.TWRR provided
above are post expenses. The above performance data is not verified by SEBI. Past performance may or may not be
sustained in future and does not guarantee future return.The Portfolio Manager offers the option of direct onboarding of
clients under Discretionary Services. Inception date is March 12, 2018. Source: NSE, Internal Research
16 www.njpms.in
Portfolio Management Services
For private circulation only. This presentation contains 51 slides
and must be viewed in its entirety.
4 & 5 YEARS ROLLING RETURNS OF BLUECHIP PORTFOLIO
4 YEAR ROLLING RETURNS 5 YEAR ROLLING RETURNS
BLUECHIP
PORTFOLIO
NIFTY 50 TRI
BLUECHIP
PORTFOLIO
NIFTY 50 TRI
Count 873 873 507 507
Average Return 17.86 16.46 15.25 14.61
Median 17.14 15.24 15.42 14.84
Maximum 28.21 32.01 22.26 18.92
Minimum 11.75 10.40 10.45 11.73
Out Performance against NIFTY
50 TRI
83.28% - 66.67% -
Returns as on 31st July 2024
Performance data upto 12 months are Absolute Returns; Performance data more than 12 months are CAGR.TWRR provided
above are post expenses. The above performance data is not verified by SEBI. Past performance may or may not be
sustained in future and does not guarantee future return.The Portfolio Manager offers the option of direct onboarding of
clients under Discretionary Services. Inception date is March 12, 2018.
Source: NSE, Internal Research
17 www.njpms.in
Portfolio Management Services
For private circulation only. This presentation contains 51 slides
and must be viewed in its entirety.
BLUECHIP PORTFOLIO (TWRR)
NJ Asset Management Private Limited
(SEBI Registration No. PM/INP000003518)
TWRR Returns(%)
STRATEGY
INVESTMENT APPROACH
NAME
AUM
(IN INR CR)
1M 3M 6M 1YR 2YRS 3YRS 4YRS 5YRS
SINCE
INCEPTION
(March 12 ,2018)
Equity
Bluechip Portfolio - Equity
Strategy 1,991.83 6.93 16.91 20.23 36.95 21.23 13.68 25.31 22.03 16.96
Benchmark: Nifty 50 TRI ** 4.00 11.07 15.72 27.84 21.89 17.88 23.96 18.90 16.07
Returns as on 31st July 2024
Past performance may or may not be sustained in future. Above performance data is not verified by
SEBI. TWRR provided above are post expenses.Please note that performance of your portfolio may
vary from that of other investors and that generated by the Investment Approach across all investors
because of
● the timing of inflows and outflows of funds; and
● differences in the portfolio composition because of restrictions and other constraints.
Performance relative to other Portfolio Managers within the selected strategy is available on the link 'https:/
/tinyurl.com/mr3ucm2v' . The above disclosure is as per
SEBI circular SEBI/HO/IMD/IMD-PoD-2/P/CIR/2022/172 dated December 16, 2022.
18 www.njpms.in
Portfolio Management Services
For private circulation only. This presentation contains 51 slides
and must be viewed in its entirety.
Past performance may or may not be sustained in future. Above performance data is not verified by SEBI. TWRR provided above
are post expenses.
Please note that performance of your portfolio may vary from that of other investors and that generated by the Investment
Approach across all investors because of
● The timing of inflows and outflows of funds; and
● Differences in the portfolio composition because of restrictions and other constraints.
Performance relative to other Portfolio Managers within the selected strategy is available on the link 'https:/
/tinyurl.com/mr3ucm2v' . The above disclosure is as
per SEBI circular SEBI/HO/IMD/IMD-PoD-2/P/CIR/2022/172 dated December 16, 2022.
BLUECHIP PORTFOLIO CALENDAR RETURNS
Period Return(%) Nifty 50 TRI(%)
CY TD 20.97 15.74
CY 2023 26.80 21.30
CY 2022 -21.65 5.69
CY 2021 58.73 25.59
CY 2020 30.96 16.14
CY 2019 4.21 13.48
CY 2018(12/03/18 to 31/12/18) 4.56 5.53
Returns as on 31st July 2024
19 www.njpms.in
Portfolio Management Services
For private circulation only. This presentation contains 51 slides
and must be viewed in its entirety.
MULTICAP PORTFOLIO
20 www.njpms.in
Portfolio Management Services
For private circulation only. This presentation contains 51 slides
and must be viewed in its entirety.
MULTICAP PORTFOLIO OBJECTIVE & INVESTMENT APPROACH
Investment Objective:
● To deliver capital appreciation over a long term from a diversified portfolio that predominantly
invests in equity and equity related instruments across various market capitalization.
The investment approach is as summarised below :
● Rule-based stock selection
● Focus on companies with superior momentum along with a volatility filter to eliminate most volatile
stocks from sample
● Additional quality filter applied to avoid loss-making companies with substantial debt
● Flexible allocation to invest across market capitalisation
● Portfolio would be reviewed for re-balancing on a quarterly basis
● Allocation would be 80% to 100% in equity and equity related securities and 0% to 20% in debt
oriented mutual funds, cash, liquid funds and arbitrage funds.
For detailed risk factors associated with investment approach, please refer to the Disclosure Document available on our website www.njpms.in
21 www.njpms.in
Portfolio Management Services
For private circulation only. This presentation contains 51 slides
and must be viewed in its entirety.
MULTICAP PORTFOLIO OBJECTIVE & INVESTMENT APPROACH
For detailed risk factors associated with investment approach, please refer to the Disclosure Document available on our website www.njpms.in
● Model portfolio based weights allocated with a maximum threshold of 8% per stock at the
time of rebalancing and 10% during the period of holding.
● Portfolio would be reviewed for re-balancing on a quarterly basis.
● This investment approach is 100% in equities and the relevant benchmark is NIFTY 50 TRI.
PORTFOLIO OF 25-35
STOCKS IS SELECTED
MOMENTUM FACTOR
PORTFOLIO
NIFTY 5OO
UNIVERSE
FILTERS OUT HIGHLY
VOLATILE STOCKS
3 years + Listed
track record
Low ROE & high
leverage stocks
are eliminated
Eliminates 25%
of most volatile
stocks
22 www.njpms.in
Portfolio Management Services
For private circulation only. This presentation contains 51 slides
and must be viewed in its entirety.
1 YEAR ROLLING RETURNS 2 YEAR ROLLING RETURNS
MULTICAP
PORTFOLIO
NIFTY 50 TRI
MULTICAP
PORTFOLIO
NIFTY 50 TRI
Count 2677 2677 2312 2312
Average Return 19.74 16.22% 13.78 14.53
Median 16.21 14.09% 15.25 14.00
Maximum 95.03 96.65% 66.16 52.18
Minimum -36.04 -32.69% -25.42 -11.60
Out Performance against
NIFTY 50 TRI
60.18% - 57.74% -
1 & 2 YEARS ROLLING RETURNS OF MULTICAP PORTFOLIO
Returns as on 31st July 2024
Performance data upto 12 months are Absolute Returns; Performance data more than 12 months are CAGR.TWRR provided
above are post expenses. The above performance data is not verified by SEBI. Past performance may or may not be
sustained in future and does not guarantee future return.The Portfolio Manager offers the option of direct onboarding of
clients under Discretionary Services. Source: NSE, Internal Research
23 www.njpms.in
Portfolio Management Services
For private circulation only. This presentation contains 51 slides
and must be viewed in its entirety.
3 & 5 YEARS ROLLING RETURNS OF MULTICAP PORTFOLIO
3 YEAR ROLLING RETURNS 5 YEAR ROLLING RETURNS
MULTICAP
PORTFOLIO
NIFTY 50 TRI
MULTICAP
PORTFOLIO
NIFTY 50 TRI
Count 1947 1947 1216 1216
Average Return 13.84 14.67 13.60 14.59
Median 19.04 15.26 11.92 14.66
Maximum 35.61 32.39 33.76 18.97
Minimum -13.89 -4.46 3.72 10.98
Out Performance against
NIFTY 50 TRI
53.36% - 26.15% -
Returns as on 31st July 2024
Performance data upto 12 months are Absolute Returns; Performance data more than 12 months are CAGR.TWRR provided
above are post expenses. The above performance data is not verified by SEBI. Past performance may or may not be
sustained in future and does not guarantee future return.The Portfolio Manager offers the option of direct onboarding of
clients under Discretionary Services. Source: NSE, Internal Research
24 www.njpms.in
Portfolio Management Services
For private circulation only. This presentation contains 51 slides
and must be viewed in its entirety.
MULTICAP PORTFOLIO (TWRR)
NJ Asset Management Private Limited
(SEBI Registration No. PM/INP000003518)
TWRR Returns(%)
STRATEGY
INVESTMENT APPROACH
NAME
AUM
(IN INR CR)
1M 3M 6M 1YR 2YRS 3YRS 4YRS 5YRS
SINCE
INCEPTION
(April 2 ,2016)
Equity
Multicap Portfolio - Equity
Strategy 722.78 4.05 17.49 29.32 71.07 46.99 29.95 39.05 33.71 18.90
Nifty 50 TRI ** 4.00 11.07 15.72 27.84 21.89 17.88 23.96 18.90 16.58
Returns as on 31st July 2024
Past performance may or may not be sustained in future. Above performance data is not verified by SEBI. TWRR
provided above are post expenses.Please note that performance of your portfolio may vary from that of other
investors and that generated by the Investment Approach across all investors because of .
● the timing of inflows and outflows of funds; and
● differences in the portfolio composition because of restrictions and other constraints.
Performance relative to other Portfolio Managers within the selected strategy is available on the link 'https:/
/tinyurl.com/mr3ucm2v' . The above disclosure is as per SEBI circular
SEBI/HO/IMD/IMD-PoD-2/P/CIR/2022/172 dated December 16, 2022.
25 www.njpms.in
Portfolio Management Services
For private circulation only. This presentation contains 51 slides
and must be viewed in its entirety.
PORTFOLIO QUALITY PARAMETERS
26 www.njpms.in
Portfolio Management Services
For private circulation only. This presentation contains 51 slides
and must be viewed in its entirety.
PORTFOLIO QUALITY PARAMETERS
Data as on July 31, 2024.
Debt on Equity calculated for non-lending companies.
Current Ratio is calculated for non-financial companies.
Dividend Payout not calculated for loss-making companies.
Return on Equity
PORTFOLIO AVERAGE
Bluechip Portfolio 31.36%
Multicap Portfolio 17.28%
Nifty 50 TRI 17.22%
Debt on Equity
PORTFOLIO AVERAGE
Bluechip Portfolio 11.58%
Multicap Portfolio 50.00%
Nifty 50 TRI 59.61%
Dividend Payout
PORTFOLIO AVERAGE
Bluechip Portfolio 55.07%
Multicap Portfolio 32.65%
Nifty 50 TRI 30.17%
Current Ratio
PORTFOLIO AVERAGE
Bluechip Portfolio 2.15
Multicap Portfolio 1.63
Nifty 50 TRI 1.66
27 www.njpms.in
Portfolio Management Services
For private circulation only. This presentation contains 51 slides
and must be viewed in its entirety.
MARKET CAPITALISATION WISE EXPOSURE
NOTE: Portfolio holdings as on 31st July 2024. Market Capitalisation is as per the latest half-yearly market
capitalisation classification shared by AMFI based as on 30th June 2024.
MARKET
CAPITALISATION
Bluechip Portfolio
No of
Companies
% of
Companies
Portfolio
Weightage
Large Cap 7 35.00% 36.03%
Mid Cap 10 50.00% 47.18%
Small Cap 3 15.00% 16.78%
TOTAL 20 100.00% 100.00%
MARKET
CAPITALISATION
Multicap Portfolio
No of
Companies
% of
Companies
Portfolio
Weightage
Large Cap 12 48.00% 53.86%
Mid Cap 9 36.00% 34.73%
Small Cap 4 16.00% 11.41%
TOTAL 25 100.00% 100.00%
28 www.njpms.in
Portfolio Management Services
For private circulation only. This presentation contains 51 slides
and must be viewed in its entirety.
PORTFOLIO OVERLAP WITH NIFTY 50 INDEX
Bluechip Portfolio Multicap Portfolio
% ACTIVE SHARE % OVERLAP % ACTIVE SHARE % OVERLAP
89.25% 10.75% 97.29% 2.71%
Source: NJ Asset Management Internal Research, CMIE, NSE. NOTE: As on 31st July 2024.
LOW OVERLAP with Nifty 50 index, giving a GENUINE DIVERSIFICATION opportunity to investors along with
rule-based style diversification..
29 www.njpms.in
Portfolio Management Services
For private circulation only. This presentation contains 51 slides
and must be viewed in its entirety.
SECTOR WISE EXPOSURE & ACTIVE WEIGHTS
.
SECTOR NIFTY 50 WEIGHT
Bluechip Portfolio Multicap Portfolio
PORTFOLIO
WEIGHT
ACTIVE
WEIGHT
PORTFOLIO
WEIGHT
ACTIVE
WEIGHT
Commodities 6.12% 10.49% 4.37% 7.02% 0.90%
Services 1.02% 0.00% -1.02% 0.00% -1.02%
Healthcare 4.15% 4.35% 0.20% 0.00% -4.15%
Consumer
Discretionary
10.62% 9.71% -0.91% 21.83% 11.21%
Financial Services 34.43% 21.97% -12.46% 22.37% -12.06%
Energy 12.57% 5.06% -7.51% 9.14% -3.43%
Source: NJ Asset Management Internal Research, AMFI, NSE, CMIE. NOTE: Portfolio Holdings as on 31st July 2024.
Sector Classification is as per the latest Macroeconomic Sector classification shared by AMFI based as on 30th April
2024.
30 www.njpms.in
Portfolio Management Services
For private circulation only. This presentation contains 51 slides
and must be viewed in its entirety.
Source: NJ Asset Management Internal Research, AMFI, NSE, CMIE. NOTE: Portfolio Holdings as on 31st July 2024.
Sector Classification is as per the latest Macroeconomic Sector classification shared by AMFI based as on 30th April
2024.
SECTOR WISE EXPOSURE & ACTIVE WEIGHTS
.
SECTOR NIFTY 50 WEIGHT
Bluechip Portfolio Multicap Portfolio
PORTFOLIO
WEIGHT
ACTIVE
WEIGHT
PORTFOLIO
WEIGHT
ACTIVE
WEIGHT
Telecommunication 3.64% 0.00% -3.64% 0.00% -3.64%
Fast Moving Consumer
Goods
7.90% 18.52% 10.62% 6.29% -1.61%
Information
Technology
12.53% 20.49% 7.96% 7.83% -4.70%
Industrials 3.91% 9.41% 5.50% 13.94% 10.03%
Utilities 3.11% 0.00% -3.11% 11.57% 8.46%
31 www.njpms.in
Portfolio Management Services
For private circulation only. This presentation contains 51 slides
and must be viewed in its entirety.
FREEDOM PORTFOLIO
32 www.njpms.in
Portfolio Management Services
For private circulation only. This presentation contains 51 slides
and must be viewed in its entirety.
FREEDOM PORTFOLIO OBJECTIVE & INVESTMENT APPROACH
Investment Objective:
● To generate capital appreciation in the long term through investments in equity oriented Mutual
Fund schemes.
The investment approach is as summarised below :
● Rule-based Mutual Fund selection with Concentrated Portfolio
● Portfolio Allocation:
● Equity oriented Mutual Fund schemes (Direct Plans) (80%-100%)
● Cash*, Debt oriented Mutual Fund schemes, Liquid Funds and Arbitrage Funds (Direct
Plans)(0%-20%)
● Portfolio would be reviewed for re-balancing on a yearly basis
● Benchmark is NIFTY 50 TRI. The basis for selection of benchmark is such that it is most suited for
comparing the performance of the portfolio.
*Marginal Cash Allocation on a/c of Portfolio rebalancing
For detailed risk factors associated with investment approach, please refer to the Disclosure Document available on our website www.njpms.in
33 www.njpms.in
Portfolio Management Services
For private circulation only. This presentation contains 51 slides
and must be viewed in its entirety.
1 YEAR ROLLING RETURNS 2 YEAR ROLLING RETURNS
FREEDOM
PORTFOLIO
NIFTY 50 TRI
FREEDOM
PORTFOLIO
NIFTY 50 TRI
Count 2069 2069 1704 1704
Average Return 16.44 15.90 15.58 15.05
Median 12.20 12.61 15.82 14.31
Maximum 86.47 96.65 48.37 52.18
Minimum -27.62 -32.69 -13.78 -11.60
Out Performance against
NIFTY 50 TRI
54.08% - 49.18% -
1 & 2 YEARS ROLLING RETURNS OF FREEDOM PORTFOLIO
Returns as on 31st July 2024
Performance data upto 12 months are Absolute Returns; Performance data more than 12 months are CAGR.TWRR provided
above are post expenses. The above performance data is not verified by SEBI. Past performance may or may not be
sustained in future and does not guarantee future return.The Portfolio Manager offers the option of direct onboarding of
clients under Discretionary Services. Source: NSE, Internal Research
34 www.njpms.in
Portfolio Management Services
For private circulation only. This presentation contains 51 slides
and must be viewed in its entirety.
3 YEARS ROLLING RETURNS OF FREEDOM PORTFOLIO
3 YEAR ROLLING RETURNS
FREEDOM
PORTFOLIO
NIFTY 50 TRI
Count 1339 1339
Average Return 17.61 17.16
Median 18.40 16.37
Maximum 29.99 32.39
Minimum 5.61 8.36
Out Performance against
NIFTY 50 TRI
68.11% -
Returns as on 31st July 2024
Performance data upto 12 months are Absolute Returns; Performance data more than 12 months are CAGR.TWRR provided
above are post expenses. The above performance data is not verified by SEBI. Past performance may or may not be
sustained in future and does not guarantee future return.The Portfolio Manager offers the option of direct onboarding of
clients under Discretionary Services.
Source: NSE, Internal Research
35 www.njpms.in
Portfolio Management Services
For private circulation only. This presentation contains 51 slides
and must be viewed in its entirety.
FREEDOM PORTFOLIO (TWRR)
NJ Asset Management Private Limited
(SEBI Registration No. PM/INP000003518)
TWRR Returns(%)
STRATEGY
INVESTMENT APPROACH
NAME
AUM
(IN INR CR)
1M 3M 6M 1YR 2YRS 3YRS 4YRS 5YRS
SINCE
INCEPTION
(December 1
,2017)
Equity
Freedom Portfolio - Equity
Strategy 157.87 5.10 15.73 24.12 45.01 31.21 20.93 28.09 23.25 16.43
Nifty 50 TRI ** 4.00 11.07 15.72 27.84 21.89 17.88 23.96 18.90 15.89
Returns as on 31st July 2024
Past performance may or may not be sustained in future. Above performance data is not verified by SEBI. TWRR
provided above are post expenses.Please note that performance of your portfolio may vary from that of other investors
and that generated by the Investment Approach across all investors because of
● the timing of inflows and outflows of funds; and
● differences in the portfolio composition because of restrictions and other constraints.
Performance relative to other Portfolio Managers within the selected strategy is available on the link 'https:/
/tinyurl.com/mr3ucm2v' . The above disclosure is as per
SEBI circular SEBI/HO/IMD/IMD-PoD-2/P/CIR/2022/172 dated December 16, 2022.
36 www.njpms.in
Portfolio Management Services
For private circulation only. This presentation contains 51 slides
and must be viewed in its entirety.
FREEDOM ETF PORTFOLIO
37 www.njpms.in
Portfolio Management Services
For private circulation only. This presentation contains 51 slides
and must be viewed in its entirety.
FREEDOM ETF PORTFOLIO OBJECTIVE & INVESTMENT APPROACH
Investment Objective:
● To generate capital appreciation over a long term through investments in equity oriented exchange
traded funds (ETFs), index funds, fund of funds and equity schemes which have underlying as Indian
indices, foreign indices and foreign stocks.
The investment approach is as summarised below :
● Equity Oriented Exchange Traded Fund/Index Fund/FoFs/Fund investing in foreign securities - 80% to
100%
● Cash, Debt Oriented Mutual Funds, Liquid Funds, and Arbitrage Funds - 0% to 20%
● Rule-based selection of 2 out of 3 Indian ETFs tracking Nifty 50, Nifty Next 50 & Nifty Midcap 150
indices
● Rule-based selection of ETFs/Fund of Funds/Equity schemes tracking foreign indices
● ETF selection and allocation currently with underlying NIFTY 50 (45%), NIFTY Midcap 150 - (30%) &
NIFTY Next 50 - (25%)
● Portfolio is rebalanced annually unless there is a significant change in allocation due to indices
performance
● Benchmark is NIFTY 50 TRI. The basis of benchmark is such that it is most suited for comparing
performance of the portfolio
For detailed risk factors associated with investment approach, please refer to the Disclosure Document available on our website www.njpms.in
38 www.njpms.in
Portfolio Management Services
For private circulation only. This presentation contains 51 slides
and must be viewed in its entirety.
DIVERSIFICATION IS THE ONLY FREE LUNCH
STATISTICS SENSEX SENSEX & NASDAQ
CAGR 13% 16%
Standard deviation 25% 20%
Downside deviation 15% 12%
Sharpe ratio 0.25 0.44
Sortino ratio 0.41 0.72
Worst drawdown -61% -60%
Worst month return -31% -18%
Best month return 42% 27%
Profitable months 58% 62%
● All the Index values are INR denominated
● All portfolios are rebalanced yearly
● Back-tested period is from January 1, 1986 to July 31, 2020 (approx. 35 yrs)
39 www.njpms.in
Portfolio Management Services
For private circulation only. This presentation contains 51 slides
and must be viewed in its entirety.
1 & 2 YEARS ROLLING RETURNS OF FREEDOM ETF PORTFOLIO
Returns as on 31st July 2024
Performance data upto 12 months are Absolute Returns; Performance data more than 12 months are CAGR.TWRR provided above
are post expenses. The above performance data is not verified by SEBI. Past performance may or may not be sustained in future
and does not guarantee future return.The Portfolio Manager offers the option of direct onboarding of clients under Discretionary
Services.
1 YEAR ROLLING RETURNS 2 YEAR ROLLING RETURNS
FREEDOM
ETF
PORTFOLIO
NIFTY 50 TRI
FREEDOM
ETF
PORTFOLIO
NIFTY 50 TRI
Count 1971 1971 1606 1606
Average Return 14.98 16.49 13.66 15.46
Median 9.54 13.13 13.75 15.00
Maximum 83.09 96.65 47.78 52.18
Minimum -30.84 -32.69 -15.17 -11.60
Out Performance against
NIFTY 50 TRI
39.62% - 25.40% -
Source: NSE, Internal Research
40 www.njpms.in
Portfolio Management Services
For private circulation only. This presentation contains 51 slides
and must be viewed in its entirety.
3 YEARS ROLLING RETURNS OF FREEDOM ETF PORTFOLIO
3 YEAR ROLLING RETURNS
FREEDOM ETF
PORTFOLIO
NIFTY 50 TRI
Count 1241 1241
Average Return 15.77 17.56
Median 16.21 16.66
Maximum 27.01 32.39
Minimum 7.40 10.41
Out Performance against
NIFTY 50 TRI
17.81% -
Returns as on 31st July 2024
Performance data upto 12 months are Absolute Returns; Performance data more than 12 months are CAGR.TWRR provided
above are post expenses. The above performance data is not verified by SEBI. Past performance may or may not be
sustained in future and does not guarantee future return.The Portfolio Manager offers the option of direct onboarding of
clients under Discretionary Services.
Source: NSE, Internal Research
41 www.njpms.in
Portfolio Management Services
For private circulation only. This presentation contains 51 slides
and must be viewed in its entirety.
FREEDOM ETF PORTFOLIO (TWRR)
NJ Asset Management Private Limited
(SEBI Registration No. PM/INP000003518)
TWRR Returns(%)
STRATEGY
INVESTMENT APPROACH
NAME
AUM
(IN INR CR)
1M 3M 6M 1YR 2YRS 3YRS 4YRS 5YRS
SINCE
INCEPTION
(March 9 ,2018)
Equity
Freedom ETF Portfolio -
Equity Strategy 216.08 4.32 13.00 19.50 37.20 25.94 17.54 24.83 19.97 14.34
Nifty 50 TRI ** 4.00 11.07 15.72 27.84 21.89 17.88 23.96 18.90 16.39
Returns as on 31st July 2024
Past performance may or may not be sustained in future. Above performance data is not verified by SEBI. TWRR
provided above are post expenses.Please note that performance of your portfolio may vary from that of other investors
and that generated by the Investment Approach across all investors because of
● the timing of inflows and outflows of funds; and
● differences in the portfolio composition because of restrictions and other constraints.
Performance relative to other Portfolio Managers within the selected strategy is available on the link 'https:/
/tinyurl.com/mr3ucm2v' . The above disclosure is as per
SEBI circular SEBI/HO/IMD/IMD-PoD-2/P/CIR/2022/172 dated December 16, 2022.
42 www.njpms.in
Portfolio Management Services
For private circulation only. This presentation contains 51 slides
and must be viewed in its entirety.
BALANCED ADVANTAGE PORTFOLIO (BAP)
43 www.njpms.in
Portfolio Management Services
For private circulation only. This presentation contains 51 slides
and must be viewed in its entirety.
BALANCED ADVANTAGE PORTFOLIO (BAP) OBJECTIVE & INVESTMENT APPROACH
Investment Objective:
● To generate capital appreciation in the long term through investments in Hybrid mutual fund schemes.
This approach shall invest in following securities:
● Rule-based Hybrid mutual fund selection with Concentrated Portfolio
Portfolio Allocation:
● Balanced Advantage / Dynamic Asset Allocation Fund (Direct Plans) (80%-100%)
● Cash, Debt oriented Mutual Fund schemes, Debt Exchange Traded Funds, Liquid Funds and
Arbitrage Funds (Direct Plans)(0%-20%)
● Portfolio would be reviewed for re-balancing on a yearly basis
● Benchmark is NIFTY 50 Hybrid Composite Debt 50:50 Index.The basis for selection of benchmark is such
that it is most suited for comparing performance of the portfolio.
For detailed risk factors associated with investment approach, please refer to the Disclosure Document available on our website www.njpms.in
*Marginal Cash Allocation on a/c of Portfolio rebalancing
44 www.njpms.in
Portfolio Management Services
For private circulation only. This presentation contains 51 slides
and must be viewed in its entirety.
1 YEAR ROLLING RETURNS OF BALANCED ADVANTAGE PORTFOLIO
1 YEAR ROLLING RETURNS
BALANCED
ADVANTAGE
PORTFOLIO
NIFTY 50 HYBRID
COMPOSITE DEBT
50:50 INDEX
Count 608 608
Average Return 14.55 11.38
Median 13.28 11.84
Maximum 28.05 20.34
Minimum 0.19 0.84
Out Performance against
NIFTY 50 TRI
64.47% -
Returns as on 31st July 2024
Performance data upto 12 months are Absolute Returns; Performance data more than 12 months are CAGR.TWRR provided above are
post expenses. The above performance data is not verified by SEBI. Past performance may or may not be sustained in future and
does not guarantee future return.The Portfolio Manager offers the option of direct onboarding of clients under Discretionary
Services. Source: NSE, Internal Research
45 www.njpms.in
Portfolio Management Services
For private circulation only. This presentation contains 51 slides
and must be viewed in its entirety.
NJ Asset Management Private Limited
(SEBI Registration No. PM/INP000003518)
TWRR Returns (%)
STRATEGY
INVESTMENT
APPROACH NAME
AUM
(IN INR CR)
1 M 3M 6M 1YR 2YRS 3YRS 4YRS 5YRS
SINCE
INCEPTION
(December 1
,2021)
Hybrid
Balanced Advantage
Portfolio - Hybrid
Strategy 181.62 3.84 7.97 13.11 26.77 19.62 - - - 14.09
Benchmark : Nifty
50 Hybrid
Composite Debt
50:50 Index ** 2.43 6.88 10.01 17.73 14.80 - - - 11.17
BALANCED ADVANTAGE PORTFOLIO (BAP) (TWRR)
Returns as on 31st July 2024
Past performance may or may not be sustained in future. Above performance data is not verified by SEBI. TWRR provided above are
post expenses.Please note that performance of your portfolio may vary from that of other investors and that generated by the
Investment Approach across all investors because of
● The timing of inflows and outflows of funds; and
● Differences in the portfolio composition because of restrictions and other constraints.
Performance relative to other Portfolio Managers within the selected strategy is available on the link 'https://tinyurl.com/mr3ucm2v' .
The above disclosure is as per SEBI circular SEBI/HO/IMD/IMD-PoD-2/P/CIR/2022/172 dated December 16, 2022.
46 www.njpms.in
Portfolio Management Services
For private circulation only. This presentation contains 51 slides
and must be viewed in its entirety.
LIQUID PORTFOLIO
47 www.njpms.in
Portfolio Management Services
For private circulation only. This presentation contains 51 slides
and must be viewed in its entirety.
LIQUID PORTFOLIO OBJECTIVE & INVESTMENT APPROACH
Investment Objective:
● To generate reasonable returns commensurate with low risk by investing in appropriate Mutual
Fund schemes.
Investment Horizon: Short Term
This approach shall invest in following securities:
● Arbitrage Funds (Direct Plans) (0-100%)
● Liquid Funds (Direct Plans) (0-100%)
● Overnight Funds (Direct Plans) (0-50%)
Portfolio Allocation:
● Schemes selected based on low credit risk and interest rate risks, consistency of performance,
lower exit load.
● Investments in any Mutual Fund scheme shall generally not be greater than 45% of portfolio
● Single AMC exposure will generally be restricted to 70% of the portfolio
● Rebalancing of portfolio reviewed annually
● Benchmark is Nifty medium to long duration debt index. The basis for selection of benchmark is
such that it is most suited for comparing performance of the portfolio.
For detailed risk factors associated with investment approach, please refer to the Disclosure Document available on our website www.njpms.in
48 www.njpms.in
Portfolio Management Services
For private circulation only. This presentation contains 51 slides
and must be viewed in its entirety.
Returns as on 31st July 2024
Past performance may or may not be sustained in future. Above performance data is not verified by SEBI. TWRR provided
above are post expenses.Please note that performance of your portfolio may vary from that of other investors and that
generated by the Investment Approach across all investors because of
● The timing of inflows and outflows of funds; and
● Differences in the portfolio composition because of restrictions and other constraints.
Performance relative to other Portfolio Managers within the selected strategy is available on the link
'https://tinyurl.com/mr3ucm2v' . The above disclosure is as per SEBI circular SEBI/HO/IMD/IMD-PoD-2/P/CIR/2022/172 dated
December 16, 2022.
LIQUID PORTFOLIO (TWRR)
NJ Asset Management Private Limited
(SEBI Registration No. PM/INP000003518)
TWRR Returns (%)
STRATEGY
INVESTMENT
APPROACH NAME
AUM
(IN INR CR)
1 M 3M 6M 1YR 2YRS 3YRS 4YRS 5YRS
SINCE
INCEPTION
(September
30 ,2020)
Debt
Liquid Portfolio -
Debt Strategy 37.42 0.59 1.79 3.63 7.15 6.83 5.67 - - 5.07
Benchmark : Nifty
Medium to Long
Duration Debt Index ** 0.96 2.67 4.52 7.87 7.75 5.77 - - 5.83
49 www.njpms.in
Portfolio Management Services
For private circulation only. This presentation contains 51 slides
and must be viewed in its entirety.
COMMON FEATURES
Minimum Investment Per Client
Minimum Investment per Investment Approach
for Bluechip and Multicap Portfolios
Minimum Investment per Investment Approach
(Excl Bluechip and Multicap Portfolios)
Additional Top Up
Mode of Investment
Exit Fees
Audit Fees
INR 50 Lakh*, Multiples of INR 1 thereafter
INR 25 Lakh, Multiples of INR 1 thereafter
INR 5 Lakh for Freedom & Freedom ETF, BAP &
Liquid IAs.
1 Lac for existing Investment Approach
Cheque, RTGS, NEFT, Security Transfer (Sell)
1% on withdrawal amount (If redeemed within 1
year) No Exit Fees on Liquid Portfolio
Upto INR 1200 Per Annum (Currently INR 590 Per
Annum)**
*Subject to change as per SEBI ( Portfolio Managers ) Regulations, 2020. | ** May change from time to time
Note: The Portfolio Manager offers the option of direct on-boarding to clients under the Discretionary Services. At the time of on-boarding of clients directly, no chargesexcept
statutory charges shall be levied for the on-boarding. The Client may download the application Form from the website of the Portfolio Manager atwww.njpms.in for availing the
Portfolio Management Services and submit the same with required details and documents for direct on-boarding at the office of the Portfolio Manager.
50 www.njpms.in
Portfolio Management Services
For private circulation only. This presentation contains 51 slides
and must be viewed in its entirety.
Investing in securities involves certain risks and considerations associated generally with making investments in securities. The value of the portfolio investments may be affected
generally by factors affecting financial markets, such as price and volume, volatility in interest rates, currency exchange rates, changes in regulatory and administrative policies of the
Government or any other appropriate authority (including tax laws) or other political and economic developments. Consequently, there can be no assurance that the objective of the
Portfolio would be achieved. The value of the portfolios may fluctuate and can go up or down. Prospective investors are advised to carefully review the Disclosure Document, Client
Agreement, and other related documents carefully and in its entirety and consult their legal, tax and financial advisors to determine possible legal, tax and financial or any other
consequences of investing under this Portfolio and to understand the risk factors, before making an investment decision. Please note that past performance of the financial products,
instruments and the portfolio does not necessarily indicate the future prospects and performance thereof. Such past performance may or may not be sustained in future. Portfolio
Manager’s investment decisions may not be always profitable, as actual market movements may be at variance with anticipated trends. The investors are not being offered any
guaranteed or assured returns. The PM may be engaged in buying/selling of such securities.
Individual returns of Clients for a particular portfolio type may vary significantly from the data on performance of the portfolios as may be depicted by the Portfolio Manager from time
to time. This is due to factors such as timing of entry and exit, timing of additional flows and redemptions, individual client mandates, specific portfolio construction characteristics or
structural parameters, which may have a bearing on individual portfolio performance. No claims may be made or entertained for any variances between the performance depictionsand
individual portfolio performance. Neither NJ Asset Management Private Limited (erstwhile NJ Advisory Services Private Limited) (the “Portfolio Manager” or “PM”) nor its Directors or
Employees shall be in any way liable for any variations noticed in the returns of individual portfolios. The Client shall not make any claim against the Portfolio Manager against any losses
(notional or real) or against any loss of opportunity for gain under various PMS Products, on account of or arising out of such circumstance/ change in market condition or for any other
reason which may specifically affect a particular sector or security.
All data/information used in the preparation of this material is dated and may or may not be relevant any time after the issuance of this material. The Portfolio Manager/ the PM takeno
responsibility of updating any data/information in this material from time to time. In the preparation of this material the PM has used information that is publicly available, including
information developed in-house. Some of the material used herein may have been obtained from members/persons other than the PM and/or its affiliates and which may have been
made available to the PM and/or to its affiliates. Information gathered and material used herein is believed to be from reliable sources. The PM however does not warrant the accuracy,
reasonableness and/or completeness of any information. For data reference to any third party in this material no such party will assume any liability for the same. We have included
statements/opinions/recommendations in this material, which contain words, or phrases such as “will”, “expect”, “should”, “believe” and also PE ratios, EPS and Earnings Growth for
forthcoming years and similar expressions or variations of such expressions that are “forward looking statements”. Actual results may differ materially from those suggested by the
forward looking statements due to risk or uncertainties associated with our expectations with respect to, but not limited to, exposure to market risks, general economic and political
conditions in India and other countries globally, the monitory and interest policies of India, inflation, unanticipated turbulence in interest rates, foreign exchange rates, equity prices, the
performance of the financial markets in India and globally, changes in domestic and foreign laws, regulations and taxes and changes in competition in the industry.
RISK FACTORS & DISCLAIMER
51 www.njpms.in
Portfolio Management Services
For private circulation only. This presentation contains 51 slides
and must be viewed in its entirety.
0261-4025000 / 0261-6155000
sales.pms@njgroup.in www.njpms.in
THANK YOU
NJ PMS CONTACT DESK

NJ-PMS-Presentation portfolio management

  • 1.
    1 www.njpms.in Portfolio ManagementServices For private circulation only. This presentation contains 51 slides and must be viewed in its entirety. A RULE-BASED PORTFOLIO MANAGER JULY 2024 Portfolio Management Services For private circulation only. This presentation contains 51 slides and must be viewed in its entirety. www.njpms.in
  • 2.
    2 www.njpms.in Portfolio ManagementServices For private circulation only. This presentation contains 51 slides and must be viewed in its entirety. ABOUT NJ GROUP ONE OF INDIA'S LARGEST MUTUAL FUND DISTRIBUTOR A BUSINESS BUILT ON TRUST Our mission is to transform the lives of people across India by ensuring their financial well-being. With a humble beginning in 1994, we are privileged today to impact the lives of countless families. A reputed name in the financial services industry, NJ Group today is expanding its horizons into diverse businesses. We are driven with the passion for transforming lives, and we value trust above everything. We are BUILT ON TRUST Started 1994 Employees 2062+ Active Distributors 41,001+ Assets Under Management ₹2,37,051*+ Crore *Asset managed by various AMCs, mobilised by NJ | As on July, 2024
  • 3.
    3 www.njpms.in Portfolio ManagementServices For private circulation only. This presentation contains 51 slides and must be viewed in its entirety. NJ Group's PMS business commenced in the year 2010. The total Assets Under Management (AUM) currently are INR 4,410+ Crores (As on July 31st, 2024) with approximately 3,420+ investors. NJ PMS NJ PMS offers to investors an array of products investing across Equities, Mutual Funds and ETFs. NJ PMS follows the 'Rule-Based Investing' strategy for the framework of its Portfolio Management proposition.
  • 4.
    4 www.njpms.in Portfolio ManagementServices For private circulation only. This presentation contains 51 slides and must be viewed in its entirety. A different approach to investing RULE-BASED INVESTING DISCIPLINED ACTIVE RETURN PASSIVE INVESTING TRADITIONAL ACTIVE INVESTING DISCIPLINED MARKET RETURN DISCRETIONARY MANAGEMENT ACTIVE RETURN
  • 5.
    5 www.njpms.in Portfolio ManagementServices For private circulation only. This presentation contains 51 slides and must be viewed in its entirety. UNDERSTANDING RULE-BASED INVESTING Select time tested attributes Determine criteria to identify these attributes Specify measures and limits Test and validate rules for efficiency Combine complementary rules to form a protocol Use the protocol to allocate assets, select stocks and assign weights DEFINE RULES
  • 6.
    6 www.njpms.in Portfolio ManagementServices For private circulation only. This presentation contains 51 slides and must be viewed in its entirety. NJ's INVESTMENT PROCESS - STOCK SELECTION FACTOR BASED SELECTION Market Factor Momentum Volatility Value Quality Fundamental Factor PORTFOLIO
  • 7.
    7 www.njpms.in Portfolio ManagementServices For private circulation only. This presentation contains 51 slides and must be viewed in its entirety. BENEFITS OF RULE-BASED INVESTING Selection of securities is on a predefined set of rules, eliminating human bias. The investment process is pre-tested for performance and volatility in various scenarios. The Portfolio stays "True to Label" at all times.
  • 8.
    8 www.njpms.in Portfolio ManagementServices For private circulation only. This presentation contains 51 slides and must be viewed in its entirety. NJ PORTFOLIO MANAGEMENT SERVICES
  • 9.
    9 www.njpms.in Portfolio ManagementServices For private circulation only. This presentation contains 51 slides and must be viewed in its entirety. CONVENTIONAL PMS MECHANISM Single Product Approach Return Focused Equity or Debt Orientation Discretionary Management Expensive Proposition
  • 10.
    10 www.njpms.in Portfolio ManagementServices For private circulation only. This presentation contains 51 slides and must be viewed in its entirety. 5 PILLARS OF INVESTING AT NJ PMS CUSTOMIZABLE Solution oriented RISK AWARE Manages risk efficiently DIVERSIFIED Offers multiple asset classes RULE-BASED Disciplined investing COST EFFECTIVE Offers flexible cost solutions
  • 11.
    11 www.njpms.in Portfolio ManagementServices For private circulation only. This presentation contains 51 slides and must be viewed in its entirety. NJ PMS PLATFORM NJ PMS BASKET STOCK Bluechip Multicap MUTUAL FUNDS Freedom Balanced Advantage Portfolio ETF Freedom ETF DEBT Liquid Dynamic Asset allocation 100% Equity
  • 12.
    12 www.njpms.in Portfolio ManagementServices For private circulation only. This presentation contains 51 slides and must be viewed in its entirety. BLUECHIP PORTFOLIO
  • 13.
    13 www.njpms.in Portfolio ManagementServices For private circulation only. This presentation contains 51 slides and must be viewed in its entirety. BLUECHIP PORTFOLIO - OBJECTIVE & INVESTMENT APPROACH Investment Objective: ● To generate capital appreciation over a long term by investing in equity and equity related instruments. The investment approach is as summarised below : ● Rule-based stock selection ● Focus on companies with superior quality over a long period with high ROE and cash rich companies with high dividend paying capabilities ● Preference for companies with lower volatility in returns and avoid loss making companies ● Portfolio would be reviewed for re-balancing on a yearly basis ● Allocation would be 80% to 100% in equity and equity related securities and 0% to 20% in debt oriented mutual funds, cash, liquid funds and arbitrage funds. For detailed risk factors associated with investment approach, please refer to the Disclosure Document available on our website www.njpms.in
  • 14.
    14 www.njpms.in Portfolio ManagementServices For private circulation only. This presentation contains 51 slides and must be viewed in its entirety. BLUECHIP PORTFOLIO - SELECTION & ALLOCATION NIFTY 500 Universe Eliminate Bottom Companies with Highest Volatility Select High Quality Companies with high ROE and Dividend Payout Ratio Select Top 20 Reasonably Priced Companies ● Model portfolio based weights allocated with a maximum threshold of 8% per stock at the time of rebalancing and 10% during the period of holding ● Portfolio would be reviewed for re-balancing on a yearly basis which would reduce churn while still providing high risk-adjusted returns based on model backtesting results ● This investment approach is 100% equity and the relevant benchmark is NIFTY 50 TRI.
  • 15.
    15 www.njpms.in Portfolio ManagementServices For private circulation only. This presentation contains 51 slides and must be viewed in its entirety. 1 YEAR ROLLING RETURNS 3 YEAR ROLLING RETURNS BLUECHIP PORTFOLIO NIFTY 50 TRI BLUECHIP PORTFOLIO NIFTY 50 TRI Count 1968 1968 1238 1238 Average Return 17.87 16.50% 20.09 17.56 Median 10.49 13.14% 19.71 16.66 Maximum 94.71 96.65% 32.08 32.39 Minimum -22.40 -32.69% 10.43 10.41 Out Performance against NIFTY 50 TRI 51.27% - 63.25% - 1 & 3 YEARS ROLLING RETURNS OF BLUECHIP PORTFOLIO Returns as on 31st July 2024 Performance data upto 12 months are Absolute Returns; Performance data more than 12 months are CAGR.TWRR provided above are post expenses. The above performance data is not verified by SEBI. Past performance may or may not be sustained in future and does not guarantee future return.The Portfolio Manager offers the option of direct onboarding of clients under Discretionary Services. Inception date is March 12, 2018. Source: NSE, Internal Research
  • 16.
    16 www.njpms.in Portfolio ManagementServices For private circulation only. This presentation contains 51 slides and must be viewed in its entirety. 4 & 5 YEARS ROLLING RETURNS OF BLUECHIP PORTFOLIO 4 YEAR ROLLING RETURNS 5 YEAR ROLLING RETURNS BLUECHIP PORTFOLIO NIFTY 50 TRI BLUECHIP PORTFOLIO NIFTY 50 TRI Count 873 873 507 507 Average Return 17.86 16.46 15.25 14.61 Median 17.14 15.24 15.42 14.84 Maximum 28.21 32.01 22.26 18.92 Minimum 11.75 10.40 10.45 11.73 Out Performance against NIFTY 50 TRI 83.28% - 66.67% - Returns as on 31st July 2024 Performance data upto 12 months are Absolute Returns; Performance data more than 12 months are CAGR.TWRR provided above are post expenses. The above performance data is not verified by SEBI. Past performance may or may not be sustained in future and does not guarantee future return.The Portfolio Manager offers the option of direct onboarding of clients under Discretionary Services. Inception date is March 12, 2018. Source: NSE, Internal Research
  • 17.
    17 www.njpms.in Portfolio ManagementServices For private circulation only. This presentation contains 51 slides and must be viewed in its entirety. BLUECHIP PORTFOLIO (TWRR) NJ Asset Management Private Limited (SEBI Registration No. PM/INP000003518) TWRR Returns(%) STRATEGY INVESTMENT APPROACH NAME AUM (IN INR CR) 1M 3M 6M 1YR 2YRS 3YRS 4YRS 5YRS SINCE INCEPTION (March 12 ,2018) Equity Bluechip Portfolio - Equity Strategy 1,991.83 6.93 16.91 20.23 36.95 21.23 13.68 25.31 22.03 16.96 Benchmark: Nifty 50 TRI ** 4.00 11.07 15.72 27.84 21.89 17.88 23.96 18.90 16.07 Returns as on 31st July 2024 Past performance may or may not be sustained in future. Above performance data is not verified by SEBI. TWRR provided above are post expenses.Please note that performance of your portfolio may vary from that of other investors and that generated by the Investment Approach across all investors because of ● the timing of inflows and outflows of funds; and ● differences in the portfolio composition because of restrictions and other constraints. Performance relative to other Portfolio Managers within the selected strategy is available on the link 'https:/ /tinyurl.com/mr3ucm2v' . The above disclosure is as per SEBI circular SEBI/HO/IMD/IMD-PoD-2/P/CIR/2022/172 dated December 16, 2022.
  • 18.
    18 www.njpms.in Portfolio ManagementServices For private circulation only. This presentation contains 51 slides and must be viewed in its entirety. Past performance may or may not be sustained in future. Above performance data is not verified by SEBI. TWRR provided above are post expenses. Please note that performance of your portfolio may vary from that of other investors and that generated by the Investment Approach across all investors because of ● The timing of inflows and outflows of funds; and ● Differences in the portfolio composition because of restrictions and other constraints. Performance relative to other Portfolio Managers within the selected strategy is available on the link 'https:/ /tinyurl.com/mr3ucm2v' . The above disclosure is as per SEBI circular SEBI/HO/IMD/IMD-PoD-2/P/CIR/2022/172 dated December 16, 2022. BLUECHIP PORTFOLIO CALENDAR RETURNS Period Return(%) Nifty 50 TRI(%) CY TD 20.97 15.74 CY 2023 26.80 21.30 CY 2022 -21.65 5.69 CY 2021 58.73 25.59 CY 2020 30.96 16.14 CY 2019 4.21 13.48 CY 2018(12/03/18 to 31/12/18) 4.56 5.53 Returns as on 31st July 2024
  • 19.
    19 www.njpms.in Portfolio ManagementServices For private circulation only. This presentation contains 51 slides and must be viewed in its entirety. MULTICAP PORTFOLIO
  • 20.
    20 www.njpms.in Portfolio ManagementServices For private circulation only. This presentation contains 51 slides and must be viewed in its entirety. MULTICAP PORTFOLIO OBJECTIVE & INVESTMENT APPROACH Investment Objective: ● To deliver capital appreciation over a long term from a diversified portfolio that predominantly invests in equity and equity related instruments across various market capitalization. The investment approach is as summarised below : ● Rule-based stock selection ● Focus on companies with superior momentum along with a volatility filter to eliminate most volatile stocks from sample ● Additional quality filter applied to avoid loss-making companies with substantial debt ● Flexible allocation to invest across market capitalisation ● Portfolio would be reviewed for re-balancing on a quarterly basis ● Allocation would be 80% to 100% in equity and equity related securities and 0% to 20% in debt oriented mutual funds, cash, liquid funds and arbitrage funds. For detailed risk factors associated with investment approach, please refer to the Disclosure Document available on our website www.njpms.in
  • 21.
    21 www.njpms.in Portfolio ManagementServices For private circulation only. This presentation contains 51 slides and must be viewed in its entirety. MULTICAP PORTFOLIO OBJECTIVE & INVESTMENT APPROACH For detailed risk factors associated with investment approach, please refer to the Disclosure Document available on our website www.njpms.in ● Model portfolio based weights allocated with a maximum threshold of 8% per stock at the time of rebalancing and 10% during the period of holding. ● Portfolio would be reviewed for re-balancing on a quarterly basis. ● This investment approach is 100% in equities and the relevant benchmark is NIFTY 50 TRI. PORTFOLIO OF 25-35 STOCKS IS SELECTED MOMENTUM FACTOR PORTFOLIO NIFTY 5OO UNIVERSE FILTERS OUT HIGHLY VOLATILE STOCKS 3 years + Listed track record Low ROE & high leverage stocks are eliminated Eliminates 25% of most volatile stocks
  • 22.
    22 www.njpms.in Portfolio ManagementServices For private circulation only. This presentation contains 51 slides and must be viewed in its entirety. 1 YEAR ROLLING RETURNS 2 YEAR ROLLING RETURNS MULTICAP PORTFOLIO NIFTY 50 TRI MULTICAP PORTFOLIO NIFTY 50 TRI Count 2677 2677 2312 2312 Average Return 19.74 16.22% 13.78 14.53 Median 16.21 14.09% 15.25 14.00 Maximum 95.03 96.65% 66.16 52.18 Minimum -36.04 -32.69% -25.42 -11.60 Out Performance against NIFTY 50 TRI 60.18% - 57.74% - 1 & 2 YEARS ROLLING RETURNS OF MULTICAP PORTFOLIO Returns as on 31st July 2024 Performance data upto 12 months are Absolute Returns; Performance data more than 12 months are CAGR.TWRR provided above are post expenses. The above performance data is not verified by SEBI. Past performance may or may not be sustained in future and does not guarantee future return.The Portfolio Manager offers the option of direct onboarding of clients under Discretionary Services. Source: NSE, Internal Research
  • 23.
    23 www.njpms.in Portfolio ManagementServices For private circulation only. This presentation contains 51 slides and must be viewed in its entirety. 3 & 5 YEARS ROLLING RETURNS OF MULTICAP PORTFOLIO 3 YEAR ROLLING RETURNS 5 YEAR ROLLING RETURNS MULTICAP PORTFOLIO NIFTY 50 TRI MULTICAP PORTFOLIO NIFTY 50 TRI Count 1947 1947 1216 1216 Average Return 13.84 14.67 13.60 14.59 Median 19.04 15.26 11.92 14.66 Maximum 35.61 32.39 33.76 18.97 Minimum -13.89 -4.46 3.72 10.98 Out Performance against NIFTY 50 TRI 53.36% - 26.15% - Returns as on 31st July 2024 Performance data upto 12 months are Absolute Returns; Performance data more than 12 months are CAGR.TWRR provided above are post expenses. The above performance data is not verified by SEBI. Past performance may or may not be sustained in future and does not guarantee future return.The Portfolio Manager offers the option of direct onboarding of clients under Discretionary Services. Source: NSE, Internal Research
  • 24.
    24 www.njpms.in Portfolio ManagementServices For private circulation only. This presentation contains 51 slides and must be viewed in its entirety. MULTICAP PORTFOLIO (TWRR) NJ Asset Management Private Limited (SEBI Registration No. PM/INP000003518) TWRR Returns(%) STRATEGY INVESTMENT APPROACH NAME AUM (IN INR CR) 1M 3M 6M 1YR 2YRS 3YRS 4YRS 5YRS SINCE INCEPTION (April 2 ,2016) Equity Multicap Portfolio - Equity Strategy 722.78 4.05 17.49 29.32 71.07 46.99 29.95 39.05 33.71 18.90 Nifty 50 TRI ** 4.00 11.07 15.72 27.84 21.89 17.88 23.96 18.90 16.58 Returns as on 31st July 2024 Past performance may or may not be sustained in future. Above performance data is not verified by SEBI. TWRR provided above are post expenses.Please note that performance of your portfolio may vary from that of other investors and that generated by the Investment Approach across all investors because of . ● the timing of inflows and outflows of funds; and ● differences in the portfolio composition because of restrictions and other constraints. Performance relative to other Portfolio Managers within the selected strategy is available on the link 'https:/ /tinyurl.com/mr3ucm2v' . The above disclosure is as per SEBI circular SEBI/HO/IMD/IMD-PoD-2/P/CIR/2022/172 dated December 16, 2022.
  • 25.
    25 www.njpms.in Portfolio ManagementServices For private circulation only. This presentation contains 51 slides and must be viewed in its entirety. PORTFOLIO QUALITY PARAMETERS
  • 26.
    26 www.njpms.in Portfolio ManagementServices For private circulation only. This presentation contains 51 slides and must be viewed in its entirety. PORTFOLIO QUALITY PARAMETERS Data as on July 31, 2024. Debt on Equity calculated for non-lending companies. Current Ratio is calculated for non-financial companies. Dividend Payout not calculated for loss-making companies. Return on Equity PORTFOLIO AVERAGE Bluechip Portfolio 31.36% Multicap Portfolio 17.28% Nifty 50 TRI 17.22% Debt on Equity PORTFOLIO AVERAGE Bluechip Portfolio 11.58% Multicap Portfolio 50.00% Nifty 50 TRI 59.61% Dividend Payout PORTFOLIO AVERAGE Bluechip Portfolio 55.07% Multicap Portfolio 32.65% Nifty 50 TRI 30.17% Current Ratio PORTFOLIO AVERAGE Bluechip Portfolio 2.15 Multicap Portfolio 1.63 Nifty 50 TRI 1.66
  • 27.
    27 www.njpms.in Portfolio ManagementServices For private circulation only. This presentation contains 51 slides and must be viewed in its entirety. MARKET CAPITALISATION WISE EXPOSURE NOTE: Portfolio holdings as on 31st July 2024. Market Capitalisation is as per the latest half-yearly market capitalisation classification shared by AMFI based as on 30th June 2024. MARKET CAPITALISATION Bluechip Portfolio No of Companies % of Companies Portfolio Weightage Large Cap 7 35.00% 36.03% Mid Cap 10 50.00% 47.18% Small Cap 3 15.00% 16.78% TOTAL 20 100.00% 100.00% MARKET CAPITALISATION Multicap Portfolio No of Companies % of Companies Portfolio Weightage Large Cap 12 48.00% 53.86% Mid Cap 9 36.00% 34.73% Small Cap 4 16.00% 11.41% TOTAL 25 100.00% 100.00%
  • 28.
    28 www.njpms.in Portfolio ManagementServices For private circulation only. This presentation contains 51 slides and must be viewed in its entirety. PORTFOLIO OVERLAP WITH NIFTY 50 INDEX Bluechip Portfolio Multicap Portfolio % ACTIVE SHARE % OVERLAP % ACTIVE SHARE % OVERLAP 89.25% 10.75% 97.29% 2.71% Source: NJ Asset Management Internal Research, CMIE, NSE. NOTE: As on 31st July 2024. LOW OVERLAP with Nifty 50 index, giving a GENUINE DIVERSIFICATION opportunity to investors along with rule-based style diversification..
  • 29.
    29 www.njpms.in Portfolio ManagementServices For private circulation only. This presentation contains 51 slides and must be viewed in its entirety. SECTOR WISE EXPOSURE & ACTIVE WEIGHTS . SECTOR NIFTY 50 WEIGHT Bluechip Portfolio Multicap Portfolio PORTFOLIO WEIGHT ACTIVE WEIGHT PORTFOLIO WEIGHT ACTIVE WEIGHT Commodities 6.12% 10.49% 4.37% 7.02% 0.90% Services 1.02% 0.00% -1.02% 0.00% -1.02% Healthcare 4.15% 4.35% 0.20% 0.00% -4.15% Consumer Discretionary 10.62% 9.71% -0.91% 21.83% 11.21% Financial Services 34.43% 21.97% -12.46% 22.37% -12.06% Energy 12.57% 5.06% -7.51% 9.14% -3.43% Source: NJ Asset Management Internal Research, AMFI, NSE, CMIE. NOTE: Portfolio Holdings as on 31st July 2024. Sector Classification is as per the latest Macroeconomic Sector classification shared by AMFI based as on 30th April 2024.
  • 30.
    30 www.njpms.in Portfolio ManagementServices For private circulation only. This presentation contains 51 slides and must be viewed in its entirety. Source: NJ Asset Management Internal Research, AMFI, NSE, CMIE. NOTE: Portfolio Holdings as on 31st July 2024. Sector Classification is as per the latest Macroeconomic Sector classification shared by AMFI based as on 30th April 2024. SECTOR WISE EXPOSURE & ACTIVE WEIGHTS . SECTOR NIFTY 50 WEIGHT Bluechip Portfolio Multicap Portfolio PORTFOLIO WEIGHT ACTIVE WEIGHT PORTFOLIO WEIGHT ACTIVE WEIGHT Telecommunication 3.64% 0.00% -3.64% 0.00% -3.64% Fast Moving Consumer Goods 7.90% 18.52% 10.62% 6.29% -1.61% Information Technology 12.53% 20.49% 7.96% 7.83% -4.70% Industrials 3.91% 9.41% 5.50% 13.94% 10.03% Utilities 3.11% 0.00% -3.11% 11.57% 8.46%
  • 31.
    31 www.njpms.in Portfolio ManagementServices For private circulation only. This presentation contains 51 slides and must be viewed in its entirety. FREEDOM PORTFOLIO
  • 32.
    32 www.njpms.in Portfolio ManagementServices For private circulation only. This presentation contains 51 slides and must be viewed in its entirety. FREEDOM PORTFOLIO OBJECTIVE & INVESTMENT APPROACH Investment Objective: ● To generate capital appreciation in the long term through investments in equity oriented Mutual Fund schemes. The investment approach is as summarised below : ● Rule-based Mutual Fund selection with Concentrated Portfolio ● Portfolio Allocation: ● Equity oriented Mutual Fund schemes (Direct Plans) (80%-100%) ● Cash*, Debt oriented Mutual Fund schemes, Liquid Funds and Arbitrage Funds (Direct Plans)(0%-20%) ● Portfolio would be reviewed for re-balancing on a yearly basis ● Benchmark is NIFTY 50 TRI. The basis for selection of benchmark is such that it is most suited for comparing the performance of the portfolio. *Marginal Cash Allocation on a/c of Portfolio rebalancing For detailed risk factors associated with investment approach, please refer to the Disclosure Document available on our website www.njpms.in
  • 33.
    33 www.njpms.in Portfolio ManagementServices For private circulation only. This presentation contains 51 slides and must be viewed in its entirety. 1 YEAR ROLLING RETURNS 2 YEAR ROLLING RETURNS FREEDOM PORTFOLIO NIFTY 50 TRI FREEDOM PORTFOLIO NIFTY 50 TRI Count 2069 2069 1704 1704 Average Return 16.44 15.90 15.58 15.05 Median 12.20 12.61 15.82 14.31 Maximum 86.47 96.65 48.37 52.18 Minimum -27.62 -32.69 -13.78 -11.60 Out Performance against NIFTY 50 TRI 54.08% - 49.18% - 1 & 2 YEARS ROLLING RETURNS OF FREEDOM PORTFOLIO Returns as on 31st July 2024 Performance data upto 12 months are Absolute Returns; Performance data more than 12 months are CAGR.TWRR provided above are post expenses. The above performance data is not verified by SEBI. Past performance may or may not be sustained in future and does not guarantee future return.The Portfolio Manager offers the option of direct onboarding of clients under Discretionary Services. Source: NSE, Internal Research
  • 34.
    34 www.njpms.in Portfolio ManagementServices For private circulation only. This presentation contains 51 slides and must be viewed in its entirety. 3 YEARS ROLLING RETURNS OF FREEDOM PORTFOLIO 3 YEAR ROLLING RETURNS FREEDOM PORTFOLIO NIFTY 50 TRI Count 1339 1339 Average Return 17.61 17.16 Median 18.40 16.37 Maximum 29.99 32.39 Minimum 5.61 8.36 Out Performance against NIFTY 50 TRI 68.11% - Returns as on 31st July 2024 Performance data upto 12 months are Absolute Returns; Performance data more than 12 months are CAGR.TWRR provided above are post expenses. The above performance data is not verified by SEBI. Past performance may or may not be sustained in future and does not guarantee future return.The Portfolio Manager offers the option of direct onboarding of clients under Discretionary Services. Source: NSE, Internal Research
  • 35.
    35 www.njpms.in Portfolio ManagementServices For private circulation only. This presentation contains 51 slides and must be viewed in its entirety. FREEDOM PORTFOLIO (TWRR) NJ Asset Management Private Limited (SEBI Registration No. PM/INP000003518) TWRR Returns(%) STRATEGY INVESTMENT APPROACH NAME AUM (IN INR CR) 1M 3M 6M 1YR 2YRS 3YRS 4YRS 5YRS SINCE INCEPTION (December 1 ,2017) Equity Freedom Portfolio - Equity Strategy 157.87 5.10 15.73 24.12 45.01 31.21 20.93 28.09 23.25 16.43 Nifty 50 TRI ** 4.00 11.07 15.72 27.84 21.89 17.88 23.96 18.90 15.89 Returns as on 31st July 2024 Past performance may or may not be sustained in future. Above performance data is not verified by SEBI. TWRR provided above are post expenses.Please note that performance of your portfolio may vary from that of other investors and that generated by the Investment Approach across all investors because of ● the timing of inflows and outflows of funds; and ● differences in the portfolio composition because of restrictions and other constraints. Performance relative to other Portfolio Managers within the selected strategy is available on the link 'https:/ /tinyurl.com/mr3ucm2v' . The above disclosure is as per SEBI circular SEBI/HO/IMD/IMD-PoD-2/P/CIR/2022/172 dated December 16, 2022.
  • 36.
    36 www.njpms.in Portfolio ManagementServices For private circulation only. This presentation contains 51 slides and must be viewed in its entirety. FREEDOM ETF PORTFOLIO
  • 37.
    37 www.njpms.in Portfolio ManagementServices For private circulation only. This presentation contains 51 slides and must be viewed in its entirety. FREEDOM ETF PORTFOLIO OBJECTIVE & INVESTMENT APPROACH Investment Objective: ● To generate capital appreciation over a long term through investments in equity oriented exchange traded funds (ETFs), index funds, fund of funds and equity schemes which have underlying as Indian indices, foreign indices and foreign stocks. The investment approach is as summarised below : ● Equity Oriented Exchange Traded Fund/Index Fund/FoFs/Fund investing in foreign securities - 80% to 100% ● Cash, Debt Oriented Mutual Funds, Liquid Funds, and Arbitrage Funds - 0% to 20% ● Rule-based selection of 2 out of 3 Indian ETFs tracking Nifty 50, Nifty Next 50 & Nifty Midcap 150 indices ● Rule-based selection of ETFs/Fund of Funds/Equity schemes tracking foreign indices ● ETF selection and allocation currently with underlying NIFTY 50 (45%), NIFTY Midcap 150 - (30%) & NIFTY Next 50 - (25%) ● Portfolio is rebalanced annually unless there is a significant change in allocation due to indices performance ● Benchmark is NIFTY 50 TRI. The basis of benchmark is such that it is most suited for comparing performance of the portfolio For detailed risk factors associated with investment approach, please refer to the Disclosure Document available on our website www.njpms.in
  • 38.
    38 www.njpms.in Portfolio ManagementServices For private circulation only. This presentation contains 51 slides and must be viewed in its entirety. DIVERSIFICATION IS THE ONLY FREE LUNCH STATISTICS SENSEX SENSEX & NASDAQ CAGR 13% 16% Standard deviation 25% 20% Downside deviation 15% 12% Sharpe ratio 0.25 0.44 Sortino ratio 0.41 0.72 Worst drawdown -61% -60% Worst month return -31% -18% Best month return 42% 27% Profitable months 58% 62% ● All the Index values are INR denominated ● All portfolios are rebalanced yearly ● Back-tested period is from January 1, 1986 to July 31, 2020 (approx. 35 yrs)
  • 39.
    39 www.njpms.in Portfolio ManagementServices For private circulation only. This presentation contains 51 slides and must be viewed in its entirety. 1 & 2 YEARS ROLLING RETURNS OF FREEDOM ETF PORTFOLIO Returns as on 31st July 2024 Performance data upto 12 months are Absolute Returns; Performance data more than 12 months are CAGR.TWRR provided above are post expenses. The above performance data is not verified by SEBI. Past performance may or may not be sustained in future and does not guarantee future return.The Portfolio Manager offers the option of direct onboarding of clients under Discretionary Services. 1 YEAR ROLLING RETURNS 2 YEAR ROLLING RETURNS FREEDOM ETF PORTFOLIO NIFTY 50 TRI FREEDOM ETF PORTFOLIO NIFTY 50 TRI Count 1971 1971 1606 1606 Average Return 14.98 16.49 13.66 15.46 Median 9.54 13.13 13.75 15.00 Maximum 83.09 96.65 47.78 52.18 Minimum -30.84 -32.69 -15.17 -11.60 Out Performance against NIFTY 50 TRI 39.62% - 25.40% - Source: NSE, Internal Research
  • 40.
    40 www.njpms.in Portfolio ManagementServices For private circulation only. This presentation contains 51 slides and must be viewed in its entirety. 3 YEARS ROLLING RETURNS OF FREEDOM ETF PORTFOLIO 3 YEAR ROLLING RETURNS FREEDOM ETF PORTFOLIO NIFTY 50 TRI Count 1241 1241 Average Return 15.77 17.56 Median 16.21 16.66 Maximum 27.01 32.39 Minimum 7.40 10.41 Out Performance against NIFTY 50 TRI 17.81% - Returns as on 31st July 2024 Performance data upto 12 months are Absolute Returns; Performance data more than 12 months are CAGR.TWRR provided above are post expenses. The above performance data is not verified by SEBI. Past performance may or may not be sustained in future and does not guarantee future return.The Portfolio Manager offers the option of direct onboarding of clients under Discretionary Services. Source: NSE, Internal Research
  • 41.
    41 www.njpms.in Portfolio ManagementServices For private circulation only. This presentation contains 51 slides and must be viewed in its entirety. FREEDOM ETF PORTFOLIO (TWRR) NJ Asset Management Private Limited (SEBI Registration No. PM/INP000003518) TWRR Returns(%) STRATEGY INVESTMENT APPROACH NAME AUM (IN INR CR) 1M 3M 6M 1YR 2YRS 3YRS 4YRS 5YRS SINCE INCEPTION (March 9 ,2018) Equity Freedom ETF Portfolio - Equity Strategy 216.08 4.32 13.00 19.50 37.20 25.94 17.54 24.83 19.97 14.34 Nifty 50 TRI ** 4.00 11.07 15.72 27.84 21.89 17.88 23.96 18.90 16.39 Returns as on 31st July 2024 Past performance may or may not be sustained in future. Above performance data is not verified by SEBI. TWRR provided above are post expenses.Please note that performance of your portfolio may vary from that of other investors and that generated by the Investment Approach across all investors because of ● the timing of inflows and outflows of funds; and ● differences in the portfolio composition because of restrictions and other constraints. Performance relative to other Portfolio Managers within the selected strategy is available on the link 'https:/ /tinyurl.com/mr3ucm2v' . The above disclosure is as per SEBI circular SEBI/HO/IMD/IMD-PoD-2/P/CIR/2022/172 dated December 16, 2022.
  • 42.
    42 www.njpms.in Portfolio ManagementServices For private circulation only. This presentation contains 51 slides and must be viewed in its entirety. BALANCED ADVANTAGE PORTFOLIO (BAP)
  • 43.
    43 www.njpms.in Portfolio ManagementServices For private circulation only. This presentation contains 51 slides and must be viewed in its entirety. BALANCED ADVANTAGE PORTFOLIO (BAP) OBJECTIVE & INVESTMENT APPROACH Investment Objective: ● To generate capital appreciation in the long term through investments in Hybrid mutual fund schemes. This approach shall invest in following securities: ● Rule-based Hybrid mutual fund selection with Concentrated Portfolio Portfolio Allocation: ● Balanced Advantage / Dynamic Asset Allocation Fund (Direct Plans) (80%-100%) ● Cash, Debt oriented Mutual Fund schemes, Debt Exchange Traded Funds, Liquid Funds and Arbitrage Funds (Direct Plans)(0%-20%) ● Portfolio would be reviewed for re-balancing on a yearly basis ● Benchmark is NIFTY 50 Hybrid Composite Debt 50:50 Index.The basis for selection of benchmark is such that it is most suited for comparing performance of the portfolio. For detailed risk factors associated with investment approach, please refer to the Disclosure Document available on our website www.njpms.in *Marginal Cash Allocation on a/c of Portfolio rebalancing
  • 44.
    44 www.njpms.in Portfolio ManagementServices For private circulation only. This presentation contains 51 slides and must be viewed in its entirety. 1 YEAR ROLLING RETURNS OF BALANCED ADVANTAGE PORTFOLIO 1 YEAR ROLLING RETURNS BALANCED ADVANTAGE PORTFOLIO NIFTY 50 HYBRID COMPOSITE DEBT 50:50 INDEX Count 608 608 Average Return 14.55 11.38 Median 13.28 11.84 Maximum 28.05 20.34 Minimum 0.19 0.84 Out Performance against NIFTY 50 TRI 64.47% - Returns as on 31st July 2024 Performance data upto 12 months are Absolute Returns; Performance data more than 12 months are CAGR.TWRR provided above are post expenses. The above performance data is not verified by SEBI. Past performance may or may not be sustained in future and does not guarantee future return.The Portfolio Manager offers the option of direct onboarding of clients under Discretionary Services. Source: NSE, Internal Research
  • 45.
    45 www.njpms.in Portfolio ManagementServices For private circulation only. This presentation contains 51 slides and must be viewed in its entirety. NJ Asset Management Private Limited (SEBI Registration No. PM/INP000003518) TWRR Returns (%) STRATEGY INVESTMENT APPROACH NAME AUM (IN INR CR) 1 M 3M 6M 1YR 2YRS 3YRS 4YRS 5YRS SINCE INCEPTION (December 1 ,2021) Hybrid Balanced Advantage Portfolio - Hybrid Strategy 181.62 3.84 7.97 13.11 26.77 19.62 - - - 14.09 Benchmark : Nifty 50 Hybrid Composite Debt 50:50 Index ** 2.43 6.88 10.01 17.73 14.80 - - - 11.17 BALANCED ADVANTAGE PORTFOLIO (BAP) (TWRR) Returns as on 31st July 2024 Past performance may or may not be sustained in future. Above performance data is not verified by SEBI. TWRR provided above are post expenses.Please note that performance of your portfolio may vary from that of other investors and that generated by the Investment Approach across all investors because of ● The timing of inflows and outflows of funds; and ● Differences in the portfolio composition because of restrictions and other constraints. Performance relative to other Portfolio Managers within the selected strategy is available on the link 'https://tinyurl.com/mr3ucm2v' . The above disclosure is as per SEBI circular SEBI/HO/IMD/IMD-PoD-2/P/CIR/2022/172 dated December 16, 2022.
  • 46.
    46 www.njpms.in Portfolio ManagementServices For private circulation only. This presentation contains 51 slides and must be viewed in its entirety. LIQUID PORTFOLIO
  • 47.
    47 www.njpms.in Portfolio ManagementServices For private circulation only. This presentation contains 51 slides and must be viewed in its entirety. LIQUID PORTFOLIO OBJECTIVE & INVESTMENT APPROACH Investment Objective: ● To generate reasonable returns commensurate with low risk by investing in appropriate Mutual Fund schemes. Investment Horizon: Short Term This approach shall invest in following securities: ● Arbitrage Funds (Direct Plans) (0-100%) ● Liquid Funds (Direct Plans) (0-100%) ● Overnight Funds (Direct Plans) (0-50%) Portfolio Allocation: ● Schemes selected based on low credit risk and interest rate risks, consistency of performance, lower exit load. ● Investments in any Mutual Fund scheme shall generally not be greater than 45% of portfolio ● Single AMC exposure will generally be restricted to 70% of the portfolio ● Rebalancing of portfolio reviewed annually ● Benchmark is Nifty medium to long duration debt index. The basis for selection of benchmark is such that it is most suited for comparing performance of the portfolio. For detailed risk factors associated with investment approach, please refer to the Disclosure Document available on our website www.njpms.in
  • 48.
    48 www.njpms.in Portfolio ManagementServices For private circulation only. This presentation contains 51 slides and must be viewed in its entirety. Returns as on 31st July 2024 Past performance may or may not be sustained in future. Above performance data is not verified by SEBI. TWRR provided above are post expenses.Please note that performance of your portfolio may vary from that of other investors and that generated by the Investment Approach across all investors because of ● The timing of inflows and outflows of funds; and ● Differences in the portfolio composition because of restrictions and other constraints. Performance relative to other Portfolio Managers within the selected strategy is available on the link 'https://tinyurl.com/mr3ucm2v' . The above disclosure is as per SEBI circular SEBI/HO/IMD/IMD-PoD-2/P/CIR/2022/172 dated December 16, 2022. LIQUID PORTFOLIO (TWRR) NJ Asset Management Private Limited (SEBI Registration No. PM/INP000003518) TWRR Returns (%) STRATEGY INVESTMENT APPROACH NAME AUM (IN INR CR) 1 M 3M 6M 1YR 2YRS 3YRS 4YRS 5YRS SINCE INCEPTION (September 30 ,2020) Debt Liquid Portfolio - Debt Strategy 37.42 0.59 1.79 3.63 7.15 6.83 5.67 - - 5.07 Benchmark : Nifty Medium to Long Duration Debt Index ** 0.96 2.67 4.52 7.87 7.75 5.77 - - 5.83
  • 49.
    49 www.njpms.in Portfolio ManagementServices For private circulation only. This presentation contains 51 slides and must be viewed in its entirety. COMMON FEATURES Minimum Investment Per Client Minimum Investment per Investment Approach for Bluechip and Multicap Portfolios Minimum Investment per Investment Approach (Excl Bluechip and Multicap Portfolios) Additional Top Up Mode of Investment Exit Fees Audit Fees INR 50 Lakh*, Multiples of INR 1 thereafter INR 25 Lakh, Multiples of INR 1 thereafter INR 5 Lakh for Freedom & Freedom ETF, BAP & Liquid IAs. 1 Lac for existing Investment Approach Cheque, RTGS, NEFT, Security Transfer (Sell) 1% on withdrawal amount (If redeemed within 1 year) No Exit Fees on Liquid Portfolio Upto INR 1200 Per Annum (Currently INR 590 Per Annum)** *Subject to change as per SEBI ( Portfolio Managers ) Regulations, 2020. | ** May change from time to time Note: The Portfolio Manager offers the option of direct on-boarding to clients under the Discretionary Services. At the time of on-boarding of clients directly, no chargesexcept statutory charges shall be levied for the on-boarding. The Client may download the application Form from the website of the Portfolio Manager atwww.njpms.in for availing the Portfolio Management Services and submit the same with required details and documents for direct on-boarding at the office of the Portfolio Manager.
  • 50.
    50 www.njpms.in Portfolio ManagementServices For private circulation only. This presentation contains 51 slides and must be viewed in its entirety. Investing in securities involves certain risks and considerations associated generally with making investments in securities. The value of the portfolio investments may be affected generally by factors affecting financial markets, such as price and volume, volatility in interest rates, currency exchange rates, changes in regulatory and administrative policies of the Government or any other appropriate authority (including tax laws) or other political and economic developments. Consequently, there can be no assurance that the objective of the Portfolio would be achieved. The value of the portfolios may fluctuate and can go up or down. Prospective investors are advised to carefully review the Disclosure Document, Client Agreement, and other related documents carefully and in its entirety and consult their legal, tax and financial advisors to determine possible legal, tax and financial or any other consequences of investing under this Portfolio and to understand the risk factors, before making an investment decision. Please note that past performance of the financial products, instruments and the portfolio does not necessarily indicate the future prospects and performance thereof. Such past performance may or may not be sustained in future. Portfolio Manager’s investment decisions may not be always profitable, as actual market movements may be at variance with anticipated trends. The investors are not being offered any guaranteed or assured returns. The PM may be engaged in buying/selling of such securities. Individual returns of Clients for a particular portfolio type may vary significantly from the data on performance of the portfolios as may be depicted by the Portfolio Manager from time to time. This is due to factors such as timing of entry and exit, timing of additional flows and redemptions, individual client mandates, specific portfolio construction characteristics or structural parameters, which may have a bearing on individual portfolio performance. No claims may be made or entertained for any variances between the performance depictionsand individual portfolio performance. Neither NJ Asset Management Private Limited (erstwhile NJ Advisory Services Private Limited) (the “Portfolio Manager” or “PM”) nor its Directors or Employees shall be in any way liable for any variations noticed in the returns of individual portfolios. The Client shall not make any claim against the Portfolio Manager against any losses (notional or real) or against any loss of opportunity for gain under various PMS Products, on account of or arising out of such circumstance/ change in market condition or for any other reason which may specifically affect a particular sector or security. All data/information used in the preparation of this material is dated and may or may not be relevant any time after the issuance of this material. The Portfolio Manager/ the PM takeno responsibility of updating any data/information in this material from time to time. In the preparation of this material the PM has used information that is publicly available, including information developed in-house. Some of the material used herein may have been obtained from members/persons other than the PM and/or its affiliates and which may have been made available to the PM and/or to its affiliates. Information gathered and material used herein is believed to be from reliable sources. The PM however does not warrant the accuracy, reasonableness and/or completeness of any information. For data reference to any third party in this material no such party will assume any liability for the same. We have included statements/opinions/recommendations in this material, which contain words, or phrases such as “will”, “expect”, “should”, “believe” and also PE ratios, EPS and Earnings Growth for forthcoming years and similar expressions or variations of such expressions that are “forward looking statements”. Actual results may differ materially from those suggested by the forward looking statements due to risk or uncertainties associated with our expectations with respect to, but not limited to, exposure to market risks, general economic and political conditions in India and other countries globally, the monitory and interest policies of India, inflation, unanticipated turbulence in interest rates, foreign exchange rates, equity prices, the performance of the financial markets in India and globally, changes in domestic and foreign laws, regulations and taxes and changes in competition in the industry. RISK FACTORS & DISCLAIMER
  • 51.
    51 www.njpms.in Portfolio ManagementServices For private circulation only. This presentation contains 51 slides and must be viewed in its entirety. 0261-4025000 / 0261-6155000 sales.pms@njgroup.in www.njpms.in THANK YOU NJ PMS CONTACT DESK