Taiwan Overview
MSCI EM
CountryWeights,
Dec 2021
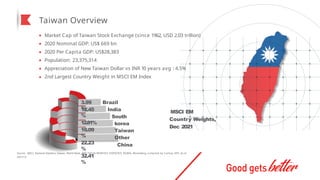
Market Cap of Taiwan Stock Exchange (since 1962, USD 2.03 trillion)
2020 Nominal GDP: US$ 669 bn
2020 Per Capita GDP: US$28,383
Population: 23,375,314
Appreciation of New Taiwan Dollar vs INR 10 years avg : 4.5%
2nd Largest Country Weight in MSCI EM Index
3.99
%
12.45
%
12.81%
16.09
%
22.23
%
32.41
%
Brazil
India
South
korea
Taiwan
Other
China
Source: MSCI, National Statistics Taiwan, World Bank, WFE FOCUS MONTHLY STATISTICS, DGBAS, Bloomberg, compiled by Cathay SITE. As of
2021/12
3.
TAIEX reflects Taiwan’sdominance in Semiconductor Market
Information Technology, 58.2%
Financials, 12.1%
Materials, 8.2%
Industrials, 8.0%
Consumer Discretionary, 5.5%
Communication Services, 2.7%
TAIEX Sector Weights
Health Care, 0.4%
Utilities, 0.1%
Real Estate, 1.2%
Energy, 1.6%
Consumer Staples, 2.0%
Source: Bloomberg, compiled by Cathay SITE. As of 2021/12
4.
Worldwide Semiconductor marketcontinues to grow..
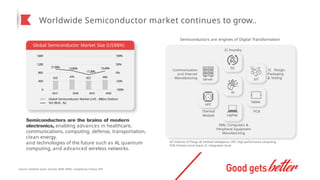
Global Semiconductor Market Size (US$BN)
422 476 422 466
21.90% 12.80%
-11.30%
10.40%
-100%
-50%
0%
50%
100%
0
400
800
1,200
1,600
2017 2018 2019 2020
Global Semiconductor Market (LHS , Billion Dollars)
YoY (RHS , %)
Communication
and Internet
Manufacturing
IC Foundry
IC Design,
Packaging
& Testing
PCB
HPC
Thermal
Module
Server IoT
Tablet
Laptop
5G
AI
Source: Goldman Sachs, Gartner, SEMI, EMDS, compiled by Cathay SITE
IoT: Internet of Things, AI: Artificial Intelligence, HPC: High performance computing,
PCB: Printed circuit board, IC: Integrated circuit
EMS, Computers &
Peripheral Equipment
Manufacturing
Semiconductors are the brains of modern
electronics, enabling advances in healthcare,
communications, computing, defense, transportation,
clean energy,
and technologies of the future such as AI, quantum
computing, and advanced wireless networks.
Semiconductors are engines of Digital Transformation
5.
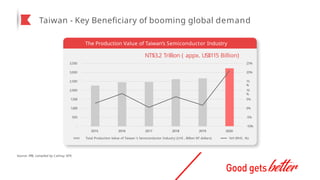
Taiwan - KeyBeneficiary of booming global demand
-10%
-5%
0%
5%
10
%
15
%
20%
25%
500
-
1,000
1,500
2,000
2,500
3,000
3,500
2020
2015 2016 2017 2018 2019
Total Production Value of Taiwan 's Semiconductor Industry (LHS , Billion NT dollars) YoY (RHS , %)
The Production Value of Taiwan’s Semiconductor Industry
NT$3.2 Trillion ( appx. US$115 Billion)
Source: ITRI, compiled by Cathay SITE
6.
Taiwan has aWell-established Semiconductor Supply Chain
EDA &
CORE IP
EQUIPMENT &
TOOL
MATERIAL
DESIGN BACK END
ASSEMBLY
& TEST
FRONT END WAFER
FABRICATION
Logic: advanced
nodes (<10nm)
Logic: mature
nodes (<=10nm)
Memory
Taiwan Dominated #1 and #2 in every semiconductor sub-sectors
MANUFACTURING
Source: “Strengthen the Global Semiconductor Supply Chain in an Uncertain
Era” by BCG and Semiconductor Industry Association, April 2021
7.
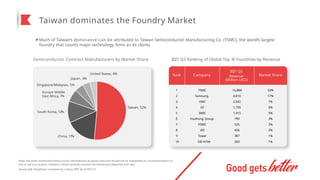
Taiwan dominates theFoundry Market
Note: Securities mentioned herein are for informational purposes only and should not be interpreted as recommendation to
buy or sell any security. Investors should carefully consider the investment objectives and risks.
Source: KGI, TrendForce, compiled by Cathay SITE. As of 2021/12
Much of Taiwan’s dominance can be attributed to Taiwan Semiconductor Manufacturing Co. (TSMC), the world’s largest
foundry that counts major technology firms as its clients
Semiconductor Contract Manufacturers by Market Share 2021 Q3 Ranking of Global Top 10 Foundries by Revenue
South Korea, 12%
China, 17%
Japan, 4%
Singapore/Malaysia, 5%
Europe Middle
East Africa, 7%
United States, 4%
(Million USD)
Rank Company
2021 Q3
Revenue Market Share
1 TSMC 14,884 53%
2 Samsung 4,810 17%
3 UMC 2,042 7%
Taiwan, 52% 4 GF 1,705 6%
5 SMIC 1,415 5%
6 Huahong Group 799 3%
7 PSMC 525 2%
8 VIS 426 2%
9 Tower 387 1%
10 DB HiTek 283 1%
8.
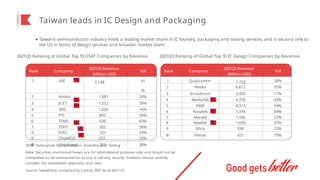
Taiwan leads inIC Design and Packaging
Taiwan’s semiconductor industry holds a leading market share in IC foundry, packaging and testing services, and is second only to
the US in terms of design services and broader market share.
2021Q3 Ranking of Global Top 10 OSAT Companies by Revenue 2021Q3 Ranking of Global Top 10 IC Design Companies by Revenue
OSAT: Outsourced Semiconductor Assembly and Testing
Note: Securities mentioned herein are for informational purposes only and should not be
interpreted as recommendation to buy or sell any security. Investors should carefully
consider the investment objectives and risks.
Source: TrendForce, compiled by Cathay SITE. As of 2021/12
Rank
1
Company
ASE
2021Q3 Revenue
(Million USD)
2,148
YoY
41
%
2 Amkor 1,681 24%
3 JCET 1,252 28%
4 SPIL 1,036 16%
5 PTI 802 24%
6 TFME 636 60%
7 TSHT 502 58%
8 KYEC 323 29%
9 ChipMOS 257 33%
1
0 Chipbond 255 30%
Rank
1
Company
Qualcomm
2021Q3 Revenue
(Million USD)
7,733
YoY
56%
2 Nvidia 6,612 55%
3 Broadcom 5,430 17%
4 MediaTek 4,703 43%
5 AMD 4,313 54%
6 Novatek 1,376 84%
7 Marvell 1,166 57%
8 Realtek 1,039 37%
9 Xilinx 936 22%
1
0 Himax 421 75%
9.
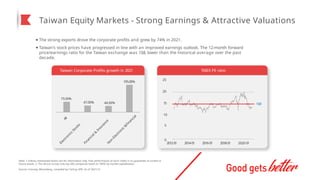
Taiwan Equity Markets- Strong Earnings & Attractive Valuations
Note: 1
. Indices mentioned herein are for information only. Past performance of each index is no guarantee of current or
future results. 2. The above survey only top 500 companies listed on TWSE by market capitalization
Source: Cmoney, Bloomberg, compiled by Cathay SITE. As of 2021/12
The strong exports drove the corporate profits and grew by 74% in 2021.
Taiwan's stock prices have progressed in line with an improved earnings outlook. The 12-month forward
price/earnings ratio for the Taiwan exchange was 13.8, lower than the historical average over the past
decade.
73.50%
47.00% 44.00%
195.00%
A
l
l
E
l
e
c
t
r
o
n
i
c
s
S
t
o
c
k
s
F
i
n
a
n
c
i
a
l
&
I
n
s
u
r
a
n
c
e
N
o
n
-
E
l
e
c
t
r
o
n
i
c
&
F
i
n
a
n
c
i
a
l
Taiwan Corporate Profits growth in 2021
10
5
0
15
20
13.8
2012-01 2014-01 2016-01 2018-01 2020-01
TAIEX PE ratio
25
10.
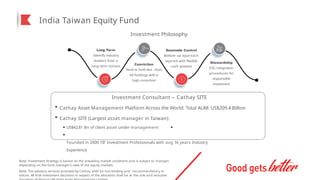
India Taiwan EquityFund
Investment Philosophy
Long Term
Identify industry
leaders from a
long term horizon
Conviction
Tend to hold less than
40 holdings with a
high conviction
Downside Control
Bottom up approach
layered with flexible
cash position
Stewardship
ESG integration
procedures for
responsible
investment
Investment Consultant – Cathay SITE
Cathay Asset Management Platform Across the World: Total AUM: US$209.4 Billion
Cathay SITE (Largest asset manager in Taiwan):
US$42.81 Bn of client asset under management
Founded in 2000 137 Investment Professionals with avg 14 years Industry
Experience
Note: Investment Strategy is based on the prevailing market conditions and is subject to changes
depending on the fund manager’s view of the equity markets
Note: The advisory services provided by Cathay shall be non-binding and recommendatory in
nature. All final investment decisions in respect of the allocation shall be at the sole and exclusive
11.
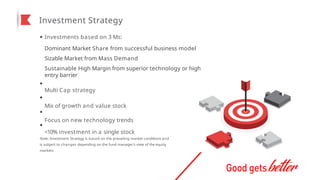
Investment Strategy
Investments basedon 3 Ms:
Dominant Market Share from successful business model
Sizable Market from Mass Demand
Sustainable High Margin from superior technology or high
entry barrier
Multi Cap strategy
Mix of growth and value stock
Focus on new technology trends
<10% investment in a single stock
Note: Investment Strategy is based on the prevailing market conditions and
is subject to changes depending on the fund manager’s view of the equity
markets