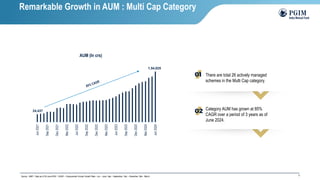
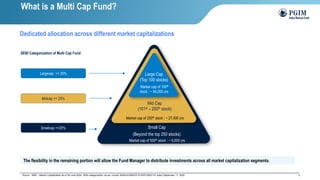
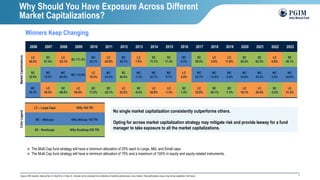
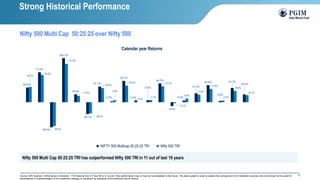
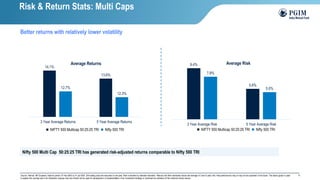
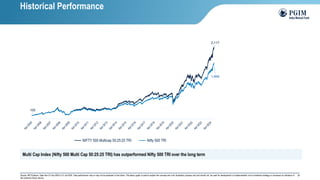
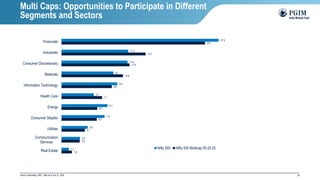
July 2024
PGIM INDIA MULTI CAP FUND
(An open ended equity scheme investing across large cap, mid cap, small cap stocks)
2
Investing in a Single Market Cap Can Limit You
The second most important question people often ask is,
‘paise kaha lagane chahiye?’
3
‘Small-cap and mid-cap froth spreading into large caps’
Investing in a Single Market Cap Can Limit You
ET Analysis: Investing in an ageing bull market
These midcap stocks with ‘strong buy’ & ‘buy’ recos can rally
over 30%, according to analysts
Investors make a beeline to large-cap funds amid higher small-
cap valuations
Mid and small-cap indices hit new highs in 2024; is it time to
move to large caps?
Here’s what top experts suggest
4
1
2
3
4
5
Active + Disciplined Management: The Fund manager strategically combines disciplined allocation of 25% in each market capitalization viz.
large, mid & small with stock picking techniques as only few companies can make the transition from small to becoming large companies.
Sector Coverage: Multi Cap fund entails a balanced approach towards investment, in both established and emerging fast-growing sectors.
This involves diversifying investments across various sectors to gain exposure within the mid and small-cap space.
Disciplined Rebalancing: As winners keep rotating across different market capitalizations, a Multi Cap fund provides disciplined exposure
across different market caps capturing ideas regardless of the size.
Risk-Adjusted Returns: Multi Caps have provided risk-adjusted returns comparable to broader markets.
Tax and cost efficiency: Investors may face tax & added cost implications by rebalancing the portfolio themselves.
Multi Caps: Seizing the Best of all Market Caps
5
24,437
1,54,025
Jun
2021
Sep
2021
Dec
2021
Mar
2022
Jun
2022
Sep
2022
Dec
2022
Mar
2023
Jun
2023
Sep
2023
Dec
2023
Mar
2024
Jun
2024
AUM (In crs)
Source : AMFI ; Data as of 30-June-2024 ; CAGR – Compounded Annual Growth Rate ; Jun – June, Sep – September, Dec – December, Mar - March
There are total 26 actively managed
schemes in the Multi Cap category.
Category AUM has grown at 85%
CAGR over a period of 3 years as of
June 2024.
Remarkable Growth in AUM : Multi Cap Category
6
Dedicated allocation across different market capitalizations
Source : AMFI ; Market Capitalization as of 30-June-2024, SEBI categorization as per circular SEBI/HO/IMD/DF3/CIR/P/2020/172 dated September 11, 2020
Mid Cap
(101st – 250th stock)
Small Cap
(Beyond the top 250 stocks)
Market cap of 250th stock : ~ 27,500 crs
SEBI Categorization of Multi Cap Fund
Midcap >= 25%
Largecap >= 25%
Smallcap >=25%
Large Cap
(Top 100 stocks)
Market cap of 100th
stock : ~ 84,000 crs
Market cap of 500th stock : ~ 9,000 crs
The flexibility in the remaining portion will allow the Fund Manager to distribute investments across all market capitalization segments.
What is a Multi Cap Fund?
7
Source: MFI Explorer; Data as from 31-Dec-05 to 31-Dec-23. It should not be construed to be indicative of scheme performance in any manner. Past performance may or may not be sustained in the future.
Market
Capitalizations
Color
Legend
2006 2007 2008 2009 2010 2011 2012 2013 2014 2015 2016 2017 2018 2019 2020 2021 2022 2023
LC
40.2%
SC
97.4%
LC
-53.1%
SC 117.4%
MC
20.1%
LC
-24.9%
MC
46.7%
LC
7.9%
SC
71.7%
SC
11.3%
MC
6.5%
SC
58.5%
LC
2.6%
LC
11.8%
SC
26.5%
SC
63.3%
LC
4.9%
SC
49.1%
SC
32.9%
MC
78.2%
MC
-64.9%
MC 113.9%
LC
19.3%
MC
-31.0%
SC
40.4%
MC
-1.3%
MC
62.7%
MC
9.7%
LC
5.0%
MC
55.7%
MC
-12.6%
MC
0.6%
MC
25.6%
MC
48.2%
MC
3.9%
MC
44.6%
MC
28.5%
LC
59.5%
SC
-68.6%
LC
84.9%
SC
17.6%
SC
-35.1%
LC
32.5%
SC
-6.4%
LC
34.9%
LC
-1.3%
SC
1.4%
LC
32.9%
SC
-26.1%
SC
-7.3%
LC
16.1%
LC
26.4%
SC
-2.6%
LC
21.2%
LC – Large Caps Nifty 100 TRI
MC – Midcaps Nifty Midcap 150 TRI
SC - Smallcaps Nifty Smallcap 250 TRI
No single market capitalization consistently outperforms others.
Opting for across market capitalization strategy may mitigate risk and provide leeway for a fund
manager to take exposure to all the market capitalizations.
➢ The Multi Cap fund strategy will have a minimum allocation of 25% each to Large, Mid, and Small caps.
➢ The Multi Cap fund strategy will have a minimum allocation of 75% and a maximum of 100% in equity and equity-related instruments.
Why Should You Have Exposure Across Different
Market Capitalizations?
Winners Keep Changing
8
Nifty 500 Multi Cap 50:25:25 TRI has outperformed Nifty 500 TRI in 11 out of last 19 years
Source: MFI Explorer; Performance is Absolute ; YTD Data as from 31-Dec-05 to 31-Jul-24. Past performance may or may not be sustained in the future; The above graph is used to explain the concept and is for illustration purpose only and should not be used for
development or implementation of an investment strategy or construed as indicative of the scheme's future returns.
34.9%
71.2%
-59.5%
104.7%
18.9%
-28.1%
37.1%
2.0%
50.7%
4.2%
4.6%
44.7%
-9.0%
4.0%
21.2%
40.6%
2.8%
33.7%
18.5%
36.2%
64.6%
-56.5%
91.0%
15.3%
-26.4%
33.5%
4.8%
39.3%
0.2%
5.1%
37.7%
-2.1%
9.0%
17.9%
31.6%
4.2%
26.9%
16.7%
Calendar year Returns
NIFTY 500 Multicap 50:25:25 TRI Nifty 500 TRI
Strong Historical Performance
Nifty 500 Multi Cap 50:25:25 over Nifty 500
9
Better returns with relatively lower volatility
Source: Internal, MFI Explorer; Data for period: 01-Apr-2005 to 31-Jul-2024. 250 trading days are assumed in one year, Risk is denoted by standard deviation. Returns and Risk mentioned above are average of 3 and 5-year rolls. Past performance may or may not be sustained in the future; The above graph is used
to explain the concept and is for illustration purpose only and should not be used for development or implementation of an investment strategy or construed as indicative of the scheme's future returns.
Nifty 500 Multi Cap 50:25:25 TRI has generated risk-adjusted returns comparable to Nifty 500 TRI
14.1%
13.6%
12.7%
12.3%
3 Year Average Returns 5 Year Average Returns
Average Returns
NIFTY 500 Multicap 50:25:25 TRI Nifty 500 TRI
9.4%
5.6%
7.8%
5.0%
3 Year Average Risk 5 Year Average Risk
Average Risk
NIFTY 500 Multicap 50:25:25 TRI Nifty 500 TRI
Risk & Return Stats: Multi Caps
10
3 Year
Rolling Returns
Nifty 500 TRI
Nifty 500 Multi Cap
50:25:25 TRI
Average 12.7% 14.1%
Median 13.2% 14.4%
Min -8.7% -10.2%
Max 38.2% 38.1%
Returns Range
Negative 6.4% 8.6%
0% to 10% 27.2% 22.4%
10% to 15% 27.5% 21.7%
15% to 20% 21.0% 17.0%
Above 20% 17.9% 30.2%
66% 69%
Source : MFI Explorer ; Data for period 01-Apr-2005 to 31-Jul-2024. 250 trading days are considered in one year. Past performance may or may not be sustained in the future; The above table is used to explain the concept and is for illustration purpose only and should not be used for development or implementation of
an investment strategy or construed as indicative of the scheme's future returns.
The average outperformance of Nifty 500 Multi Cap 50:25:25 TRI over Nifty 500
TRI is 1.4%
69% of the times Nifty 500 Multi Cap 50:25:25 TRI provided double digit returns
Multi Caps: Rolling Return Comparison
11
Ensures better diversification owing to its asset
allocation structure
Higher allocation towards Large Cap
Source: ACE MF Nxt ; Data as of June 30, 2024 ; Market Cap allocation based on average of all funds in the category
The Multi Cap category stands out for its balanced exposure across market caps, as observed in the category average allocation between Multi Cap &
Flexi Cap categories. It aims to achieve a diversified portfolio by investing across large, mid, and small-cap segments.
Large Cap
(%), 64
Mid Cap
(%), 16
Small Cap
(%), 11
Flexi Cap
Large Cap
(%), 40
Mid Cap (%),
25
Small Cap
(%), 30
Multi Cap Fund
Diversified Investment Opportunities Across Market
Capitalizations
PGIM India
Multi Cap Portfolio Positioning
13
Our investment process is based on the following pillars:
Equity Investment Process
Stock Selection
Portfolio Construction
PGIM India - Equity Investment Process
14
Fund House
Universe
Management:
➢ Good quality management.
➢ Good Capital allocation track record.
➢ Operating cash flow positive in 7 out of 10 years (ex financials) (In companies with less
than 10 years of data available, at least 70% of the years should have generated
positive operating cash flows).
Quality:
➢ Higher than peer average RoE.
➢ Sustainable RoE.
Growth:
➢ Higher than peer group growth in earnings.
➢ Sustainable earnings growth.
❑ The starting point for our fund house universe will be all companies with market cap greater than Rs.1,000 crores (including any IPOs).
❑ There are more than 1,000 companies with market capitalization greater than Rs 1000 crores*.
*Source: AMFI; Data as of 30-June-2024
Stock Selection
Criteria to build fund house universe
15
Market Cap
Valuation
Other Factors
(e.g. Liquidity, Fund
Mandate, Macro
Outlook, etc.)
Fund House Universe
(Around 160-200 Stocks)
Final Portfolio
Portfolio Construction Principles
Diversification
High Active Share
True to Mandate
Designing an Optimal Portfolio
Portfolio Construction
16
25% is the minimum allocation required to be maintained in the respective market cap as per SEBI circular SEBI/HO/IMD/DF3/CIR/P/2020/172 dated September 11, 2020
Large Cap
✓ Concentration
✓ Low churn
✓ Stable long-term
companies
✓ Diversified
✓ Medium to High
churn
✓ Growth accelerator
companies
✓ Reasonable
concentration
✓ Medium churn
✓ Steady
compounding
ideas
Minimum 25%
❑ Allocation towards companies exhibiting market share growth, challengers and disruptors
Mid Cap
Minimum 25%
Small Cap
Minimum 25%
How will PGIM India Multi Cap Portfolio Be
Positioned?
17
Source : IQVIA, Kotak Institutional Equities; Jefferies
661
731
804
915
1048
1143
1225
1355
1503
1569
1855
3050
2012 2013 2014 2015 2016 2017 2018 2019 2020 2021 2022 2027E
3.8
3.1 3 2.9
2.5
1.4
Australia Italy Spain US UK India
Beds per 1000 Population
Source: OECD, The Center For Disease Dynamics, Economics & Policy, Jefferies
Key Trends Followed by the Fund (1/5)
Healthcare : Growing and Underpenetrated Market
➢ Indian domestic pharma market is expected to grow at a healthy
clip led by rising income levels, government initiatives, increasing
life expectancy and increase in insurance coverage.
➢ US generics + Domestic formulations from >50% of revenues and
profits for most pharma companies in the listed equities space.
The US generic drug market was pegged at US$74bn in CY20.
Indian companies accounted for 47% of all generic prescriptions
in the US in 2022.
➢ Despite being home to ~1/5th of the global population, India has
only ~2.1 MN beds, translating to 1.5 beds per 1,000 persons. To
meet the WHO's guideline of 3.5 beds per 1,000 persons, India
would need to add ~3 Mn beds in the coming years.
18
Source : Broker research ; UV - Utility Vehicles ; PV - Passenger Vehicles ; EV - Electric Vehicle ; 2Ws - Two-Wheelers
➢ India has one of the lowest car penetration globally, with just ~30
cars per 1000 population. This compares to ~200+ for China, and
more than ~900+ for developed nations like USA/most European
countries.
➢ With rising disposable incomes, share of UVs in India has been
rising with UVs now 60%+ of the domestic PV industry.
➢ Meanwhile, penetration of 2Ws looks optically higher, it is still
much lower vs Asian peers like Indonesia/Thailand and Vietnam.
While the volume growth runway for 2Ws is lower vs PVs, we
believe premiumisation trend in 2Ws provides scope for continued
value growth.
➢ Beyond penetration growth and premiumisation, trends like
electrification are gaining foothold in the domestic auto space.
594 583
559
526
495 489
389
351
280 276
183
26 17
70 51 45 31 40 46 35
13 10 8 13 3 4
cars per 1,000 ppulation (LHS) GDP per capita (RHS)
0.2 0.6 1.3 2.3 2.3
9.3
30.8
EV penetration estimated to reach 9% by FY29E
FY21 FY22 FY23 FY24 FY25 E FY29 E FY35 E
Key Trends Followed by the Fund (2/5)
Mobility and Innovation : A Growing Frontier
Global country wise car penetration and GDP per capita
CY2021 (units per thousand population, ‘000USD)
19
Source :Broker research
➢ Rising per capita income is leading to higher household savings.
➢ From being underserved, underbanked and new to financial systems – today average Indian has adequate access to the financial system through Jan
dhan and normal bank accounts, Micro finance and affordable housing, UPI and many such modes
➢ From being traditionally being invested in real estate, gold, physical cash or bank we are seeing movement to risk assets either directly or through
professionally managed entities.
➢ Inflows in financial instruments like equities have seen a phenomenal rise and are led by a) Direct retail trading in the stock market b) Discretionary flows
into MFs (i.e., inflows into MFs ex-SIP); c) Flows into MFs via SIPs; and d) Flows via other sources such as equity component of insurance, etc.
Key Trends Followed by the Fund (3/5)
Financialization : Rising at a Brisk Pace, Expected to Continue
20
Source : Broker research
➢ Out of total population in India, middle class segment was at 31% which is expected to see exponential rise to 47% in 2031 and 61% in 2047 due to rise in
Income per capita. When there is such an exponential rise in middle class population, it leads to significant rise in disposable income leading to rise in
discretionary spends.
➢ Over FY18-23, India saw a 7.2% CAGR in Per capita income, which is expected to accelerate to 9.3% in FY23-29, while China’s per capita income growth
is expected to slow down from 8.7% (2018-23) to 7.2% (2023-29). Rise in per capita income at an accelerated pace will aid in increasing disposable
income for the Indian population.
➢ In 2000, median age was 21.6 in India which has increased to 28.2 in 2023 with a total population of 145cr, which depicts that India has the largest young
working population in the world. Median age is expected to go to 38.1 by 2050, thus, for the next 16 years, working population mix will continuously be
high leading to very high productivity.
28.2
38.1
1955
1960
1965
1970
1975
1980
1985
1990
1995
2000
2005
2010
2015
2020
2022
2023
2025
2030
2035
2040
2045
2050
India Median Age (Yrs)
8.7% 7.2%
7.2% 9.3%
6.0% 6.0%
2018-23 2023-29
Growth in Per capita income (5yr CAGR)
China India Emerging and Developing Asia (RHS)
0 200 400 600 800 1000 1200
> INR 3Mn
INR 0.5 - 3Mn
INR 0.125 - 0.5Mn
< 0.125Mn
Rich
Middle
Class
Aspirers
Destitutes
(Population in Mn)
India's Income Pyramid
2015-16 2020-21 2030-31 (P) 2046-47 (P)
Key Trends Followed by the Fund (4/5)
Consumption: Higher per capita income to give a J- Curve for demand
21
Source : MNRE ; GW – gigawatt ; COP26 - 26th Conference of the Parties
Key Trends Followed by the Fund (5/5)
New Energy: Expanding at a Scorching Pace
➢ Inspite of being a relative late starter, India has already become the
4th largest renewable energy installed capacity country.
➢ The country has set an enhanced target at the COP26 of 500 GW
of non-fossil fuel-based energy by 2030. This is the world's largest
expansion plan in renewable energy.
➢ India’s installed non-fossil fuel capacity has increased 396% in the
last 8.5 years and stands at more than 203.19 GW (including large
Hydro and nuclear), about 45.5% of the country’s total capacity (as
of Jun 2024) .
➢ India aims to produce 5 Mn Tonnes of green hydrogen by 2030.
➢ India has set a target to reduce the carbon intensity of the nation’s
economy by less than 45% by the end of the decade, achieve 50
percent cumulative electric power installed by 2030 from
renewables, and achieve net-zero carbon emissions by 2070.
35.8
4.1 7.1 11.5 12.1 8.8 8.8 7.5
14.1 15.3 18.5
148.1
Total
FY14
FY15 FY16 FY17 FY18 FY19 FY20 FY21 FY22 FY23 FY24 Total
FY24
Renewable Capacity (ex-hydro projects) (GW)
Total
FY15 – FY24
22
3S framework for stock picking: Scalable, Sustainable, Structural :
➢ Scalable : Focus on companies with the potential to continue growing their revenue at an accelerated pace.
➢ Sustainable : Prioritize companies achieving above-average growth at comparatively lower costs as they scale.
➢ Structural : Seek companies with a longer runway for above-average growth and profitability, driven by clear, visible triggers
The portfolio construction approach is bottoms-up and well-diversified.
Growth at a Reasonable Price (GARP) focused strategy with flexibility to adjust between short, medium and long-term growth
opportunities based on market conditions.
May allocate to turnaround ideas, event-driven opportunities, and stocks showing momentum driven by earnings growth in the medium to
long term.
These are based on the Fund Managers’ outlook and are subject to change. The scheme may or may not invest in above themes. These themes may change depending upon the market conditions.
1
2
3
4
Themes / Styles in the Fund
About
PGIM India
Multi Cap Fund
24
Scheme Name PGIM India Multi Cap Fund
Type of scheme An open-ended equity scheme investing across large cap, mid cap, small cap stocks.
Investment
objective
The investment objective of the scheme is to seek to generate long-term capital appreciation by investing in a portfolio of equity and equity
related securities across large cap, mid cap, small cap stocks.
However, there can be no assurance that the investment objective of the Scheme will be achieved. The Scheme does not guarantee/
indicate any returns.
Plan / Options
IDCW** (Payout of Income Distribution cum Capital Withdrawal option / Reinvestment of Income Distribution cum Capital Withdrawal option)
and Growth.
Minimum
Application Amount
Initial Purchase/ Switch-in - Minimum of Rs. 5,000/- and in multiples of Re. 1/-thereafter.
Additional Purchase - Minimum of Rs. 1,000/- and in multiples of Re. 1/-thereafter.
For SIPs - Minimum no. of 5 installments and Minimum amount per installment - Rs. 1,000/- each and in multiples of Rs.1/- thereafter.
Exit Load
For Exits within 90 days from date of allotment of units : 0.50%.
For Exits beyond 90 days from date of allotment of units : NIL
Fund Manager
Mr. Vivek Sharma (Equity Portion)
Mr. Anandha Padmanabhan Anjeneyan (Equity Portion)
Mr. Utsav Mehta (Equity Portion)
Mr. Puneet Pal (Debt Portion)
Benchmark Index Nifty 500 Multi Cap 50:25:25 TRI
**Income Distribution cum Capital Withdrawal option
About PGIM India Multi Cap Fund
25
The Product labeling assigned during the NFO is
based on internal assessment of the scheme
characteristics or model portfolio and the same may
vary post NFO when actual investments are made.
PGIM India Multi Cap Fund
(An open-ended equity scheme investing across large cap, mid cap, small cap stocks.)
The information contained herein is provided by PGIM India Asset Management Private Limited (the AMC) on the basis of publicly available information, internally developed data and other third party sources believed to be reliable.
However, the AMC cannot guarantee the accuracy of such information, assure its completeness, or warrant such information will not be changed. The information contained herein is current as of the date of issuance* (or such earlier
date as referenced herein) and is subject to change without notice. The AMC has no obligation to update any or all of such information; nor does the AMC make any express or implied warranties or representations as to its
completeness or accuracy. There can be no assurance that any forecast made herein will be actually realized. These materials do not take into account individual investor's objectives, needs or circumstances or the suitability of any
securities, financial instruments or investment strategies described herein for particular investor. Hence, each investor is advised to consult his or her own professional investment / tax advisor / consultant for advice in this regard.
The information contained herein is provided on the basis of and subject to the explanations, caveats and warnings set out elsewhere herein. The views of the Fund Manager should not be construed as an advice and investors must
make their own investment decisions regarding investment/ disinvestment in securities market and/or suitability of the fund based on their specific investment objectives and financial positions and using such independent advisors as
they believe necessary. © 2024 Prudential Financial, Inc. (PFI) and its related entities. PGIM, the PGIM logo, and the Rock symbol are service marks of Prudential Financial, Inc., and its related entities, registered in many
jurisdictions worldwide.
Mutual fund investments are subject to market risks, read all scheme related documents carefully.
Compliance no. 94/2024-25
Riskometer and Important Disclosures
*Investors should consult their financial advisers if in
doubt about whether the product is suitable for them.
Annexure
27
Source: Niftyindices, BSE. *YTD. Data as of 31-Jul-24 MoM represents Nifty 200 Momentum 30 TRI, Low vol represents BSE Low Volatility TRI. Quality represents BSE Quality TRI, Value represents BSE Enhanced value TRI, Nifty 200 in the table is Total
Return Index. It should not be construed to be indicative of scheme performance in any manner. Past performance may or may not be sustained in the future.
Is a Style Rotation Underway?
✓ While Value has led in recent years, the latest 1- and 3-month data suggest a potential shift, with Quality outperforming other styles
2020 2021 2022 2023 2024*
Low Vol
26.8%
Value
56.9%
Value
26.3%
Value
62.2%
Value
40.5%
Quality
26.0%
Mom.
53.8%
Quality
13.0%
Mom.
41.7%
Mom.
36.2%
Mom.
20.0%
Nifty 200
28.9%
Nifty 200
4.9%
Quality
34.4%
Quality
34.4%
Nifty 200
16.8%
Quality
19.4%
Low Vol
4.5%
Low Vol
30.8%
Low Vol
20.8%
Value
12.8%
Low Vol
19.3%
Mom.
-5.4%
Nifty 200
24.7%
Nifty 200
20.9%
1 Months 3 Months
Quality
7.6%
Quality
20.8%
Value
6.8%
MoM.
14.0%
MoM.
5.0%
Nifty 200
12.4%
Low Vol
4.4%
Value
11.3%
Nifty 200
4.4%
Low Vol
10.5%
28
Source: MFI Explorer, Internal data for period : 01-Apr-2005 to 31-Jul-2024. 250 trading days are considered in one-year. Past performance may or may not be sustained in the future; The above graph is used to explain the concept and is for illustration purpose only and should not be used for development or
implementation of an investment strategy or construed as indicative of the scheme's future returns.
On a 3-year rolling returns basis, Nifty 500 Multi Cap 50:25:25 TRI has outperformed Nifty 500 TRI 69% of times. The average outperformance is 1.4%
Relative Outperformance
Nifty 500 Multi Cap 50:25:25 TRI over Nifty 500 TRI
-6%
-4%
-2%
0%
2%
4%
6%
8%
Relative outperformance on a 3 years Rolling returns basis
Excess Returns Average Outperformance
29
Multi Cap Index (Nifty 500 Multi Cap 50:25:25 TRI) has outperformed Nifty 500 TRI over the long term
Source: MFI Explorer. Data from 01-Apr-2005 to 31-Jul-2024. Past performance may or may not be sustained in the future; The above graph is used to explain the concept and is for illustration purpose only and should not be used for development or implementation of an investment strategy or construed as indicative of
the scheme's future returns.
2,117
100
1,604
NIFTY 500 Multicap 50:25:25 TRI Nifty 500 TRI
Historical Performance
30
Source: Bloomberg, NSE ; Data as of July 31, 2024
1.8
3.2
4.1
6.2
6.3
7.1
8.8
10.8
11.9
14.7
25.1
1.3
3.3
4.6
7.5
8.1
5.7
9.8
9.1
11.6
11.7
27.5
Real Estate
Communication
Services
Utilities
Consumer Staples
Energy
Health Care
Information Technology
Materials
Consumer Discretionary
Industrials
Financials
Nifty 500 Nifty 500 Multicap 50:25:25
Multi Caps: Opportunities to Participate in Different
Segments and Sectors
31
Flexi Cap Category Multi Cap Category
Meaning
No restriction on investing in large, mid, or
small cap stocks.
Mandatorily allocate at least 25% each to
large, mid, and small-cap stocks.
Nature
Balanced with flexibility in allocating based on
the fund manager's outlook.
Disciplined, with mandatory allocation in each
market cap irrespective of outlook.
Active management
A fund manager can allocate the majority in
any size of the company based on their outlook
A fund manager must mandatorily allocate at
least 25% in each market cap irrespective of
his outlook
Risk
Higher risk due to flexibility in allocating a
majority to small caps
Lower risk due to mandatory allocation in
each market cap.
Category Allocation
As of 30 June 2024, the category average
allocation of Flexicap is skewed toward large
caps i.e., 64% and the rest in mid and small
caps
As of 30 June 2024, the category average
allocation of Multi Cap is more diversified
across market caps with the allocation of
40%, 25%, and 30% in large, mid, and small
caps respectively
Source: ACE MF Nxt ; Data as of June 30, 2024 ; Market Cap allocation based on average of all funds in the category
Difference between Flexi Cap and Multi Cap
Category
32
Multi Caps: Combination of Large, Mid & Small caps
Risk Probability
Return
Potential
Large Cap Funds
Flexi Cap Funds
Large & Midcap
Funds
Multi Cap Funds
Mid Cap Funds
Small Cap Funds
The above graph is used to explain the concept and is for explanatory purpose only and should not used for development or implementation of an investment strategy
Mid cap: 0%-100%
Small cap: 0%-100%
Mid cap: 35% - 65%
Mid cap 25%-50%
Small cap 25%-50%
Mid Cap: 65%-100%
Small Cap: 65%-100%
Risk Return Positioning
Large cap: 80%-100%
33
➢ The Indian aviation market is highly underpenetrated with one of the lowest domestic and international seats per capita in the world. This provides huge
headroom for growth with only 6.5% Indians holding a valid passport.
➢ Aviation research firm CAPA estimates that the Indian aviation passenger traffic will increase from 225m in FY24 (70m international) to 510m by FY30 (160m
international).
➢ This growth would be enabled by accelerated infrastructure expansions, with the number of airports likely to reach 220 from 140 in CY19.
➢ Indian players also have robust aircraft addition plans, with domestic players accounting for ~32% of the total aircraft orders placed in CY23 (only for Boeing and
Airbus). India is expected to be the third-largest country in terms of fleet size by CY35.
Large Cap : Aviation
57.9 60.7
70.1
85.2
103.7
123.3
140.3 141.2
53.3
84.2
136.0
40.3 43.1 45.7 49.8 54.7 60.6 63.9 60.8
8.8
21.2
54.6
98.2 103.7
115.8
135.0
158.4
183.9
204.2 202.0
62.1
105.4
190.6
-----Passengers
(In
Million)-----
Domestic Passengers International Passengers Total Passengers
Passenger traffic carried by scheduled carriers over last ten years
Source : CAPA
Understanding Stock Categories (1/3)
34
Source : Broker Research
Healthy growth of Indian market
Mid Cap : Electronics Manufacturing
4.6
5.6
6.6 6.9 7.3
9
10.9
12.7
15.3
19
23.5
28.8
FY17 FY18 FY19 FY20 FY21 FY22 FY23 FY24 FY25 FY26 FY27 FY28
Indian Electronics Market (INR trn)
Understanding Stock Categories (2/3)
➢ Government has implemented a comprehensive set of incentives
aimed at improving critical infrastructure and reducing
manufacturing and capital expenditure costs.
➢ These initiatives are poised to propel strong growth (expected at
30% or more) in India’s nascent Electronics Manufacturing Services
(EMS) industry, potentially elevating its share in the global EMS
market from 2% to 7%.
➢ This growth is underpinned by several factors, including (1) large
captive demand (with per capita consumption of electronics only a
quarter of the global average); (2) the proliferation of electronics in
everyday products; (3) import substitution strategies; and (4) rising
exports. Moreover, concerted efforts are being made to develop the
entire EMS value chain, fostering increased value addition and the
creation of a local component ecosystem, which could further
enhance the industry’s cost competitiveness
35
➢ While we are positive on consumer discretionary sector, with that sector travel and tourism offers sustainable growth prospects.
➢ Sustained tailwinds of travel, reducing replacement cycles, mindset change (utility to fashion) and unbranded to branded shift have driven and will continue
driving growth for branded players.
➢ Players with good return ratios and the ones gaining market share have done well.
Source : Broker Research
Small Cap : Travel
39 44 48 50 52 54 56 58 60
61 56 52 50 48 46 44 42 40
CY19 CY20 CY21 CY22 CY23 CY24 E CY25 E CY26 E CY27 E
Market Split
Branded Unbranded
Understanding Stock Categories (3/3)
THANK YOU!

PGIM India Multi Cap NFO PDF ppt presentation

  • 1.
    July 2024 PGIM INDIAMULTI CAP FUND (An open ended equity scheme investing across large cap, mid cap, small cap stocks)
  • 2.
    2 Investing in aSingle Market Cap Can Limit You The second most important question people often ask is, ‘paise kaha lagane chahiye?’
  • 3.
    3 ‘Small-cap and mid-capfroth spreading into large caps’ Investing in a Single Market Cap Can Limit You ET Analysis: Investing in an ageing bull market These midcap stocks with ‘strong buy’ & ‘buy’ recos can rally over 30%, according to analysts Investors make a beeline to large-cap funds amid higher small- cap valuations Mid and small-cap indices hit new highs in 2024; is it time to move to large caps? Here’s what top experts suggest
  • 4.
    4 1 2 3 4 5 Active + DisciplinedManagement: The Fund manager strategically combines disciplined allocation of 25% in each market capitalization viz. large, mid & small with stock picking techniques as only few companies can make the transition from small to becoming large companies. Sector Coverage: Multi Cap fund entails a balanced approach towards investment, in both established and emerging fast-growing sectors. This involves diversifying investments across various sectors to gain exposure within the mid and small-cap space. Disciplined Rebalancing: As winners keep rotating across different market capitalizations, a Multi Cap fund provides disciplined exposure across different market caps capturing ideas regardless of the size. Risk-Adjusted Returns: Multi Caps have provided risk-adjusted returns comparable to broader markets. Tax and cost efficiency: Investors may face tax & added cost implications by rebalancing the portfolio themselves. Multi Caps: Seizing the Best of all Market Caps
  • 5.
    5 24,437 1,54,025 Jun 2021 Sep 2021 Dec 2021 Mar 2022 Jun 2022 Sep 2022 Dec 2022 Mar 2023 Jun 2023 Sep 2023 Dec 2023 Mar 2024 Jun 2024 AUM (In crs) Source: AMFI ; Data as of 30-June-2024 ; CAGR – Compounded Annual Growth Rate ; Jun – June, Sep – September, Dec – December, Mar - March There are total 26 actively managed schemes in the Multi Cap category. Category AUM has grown at 85% CAGR over a period of 3 years as of June 2024. Remarkable Growth in AUM : Multi Cap Category
  • 6.
    6 Dedicated allocation acrossdifferent market capitalizations Source : AMFI ; Market Capitalization as of 30-June-2024, SEBI categorization as per circular SEBI/HO/IMD/DF3/CIR/P/2020/172 dated September 11, 2020 Mid Cap (101st – 250th stock) Small Cap (Beyond the top 250 stocks) Market cap of 250th stock : ~ 27,500 crs SEBI Categorization of Multi Cap Fund Midcap >= 25% Largecap >= 25% Smallcap >=25% Large Cap (Top 100 stocks) Market cap of 100th stock : ~ 84,000 crs Market cap of 500th stock : ~ 9,000 crs The flexibility in the remaining portion will allow the Fund Manager to distribute investments across all market capitalization segments. What is a Multi Cap Fund?
  • 7.
    7 Source: MFI Explorer;Data as from 31-Dec-05 to 31-Dec-23. It should not be construed to be indicative of scheme performance in any manner. Past performance may or may not be sustained in the future. Market Capitalizations Color Legend 2006 2007 2008 2009 2010 2011 2012 2013 2014 2015 2016 2017 2018 2019 2020 2021 2022 2023 LC 40.2% SC 97.4% LC -53.1% SC 117.4% MC 20.1% LC -24.9% MC 46.7% LC 7.9% SC 71.7% SC 11.3% MC 6.5% SC 58.5% LC 2.6% LC 11.8% SC 26.5% SC 63.3% LC 4.9% SC 49.1% SC 32.9% MC 78.2% MC -64.9% MC 113.9% LC 19.3% MC -31.0% SC 40.4% MC -1.3% MC 62.7% MC 9.7% LC 5.0% MC 55.7% MC -12.6% MC 0.6% MC 25.6% MC 48.2% MC 3.9% MC 44.6% MC 28.5% LC 59.5% SC -68.6% LC 84.9% SC 17.6% SC -35.1% LC 32.5% SC -6.4% LC 34.9% LC -1.3% SC 1.4% LC 32.9% SC -26.1% SC -7.3% LC 16.1% LC 26.4% SC -2.6% LC 21.2% LC – Large Caps Nifty 100 TRI MC – Midcaps Nifty Midcap 150 TRI SC - Smallcaps Nifty Smallcap 250 TRI No single market capitalization consistently outperforms others. Opting for across market capitalization strategy may mitigate risk and provide leeway for a fund manager to take exposure to all the market capitalizations. ➢ The Multi Cap fund strategy will have a minimum allocation of 25% each to Large, Mid, and Small caps. ➢ The Multi Cap fund strategy will have a minimum allocation of 75% and a maximum of 100% in equity and equity-related instruments. Why Should You Have Exposure Across Different Market Capitalizations? Winners Keep Changing
  • 8.
    8 Nifty 500 MultiCap 50:25:25 TRI has outperformed Nifty 500 TRI in 11 out of last 19 years Source: MFI Explorer; Performance is Absolute ; YTD Data as from 31-Dec-05 to 31-Jul-24. Past performance may or may not be sustained in the future; The above graph is used to explain the concept and is for illustration purpose only and should not be used for development or implementation of an investment strategy or construed as indicative of the scheme's future returns. 34.9% 71.2% -59.5% 104.7% 18.9% -28.1% 37.1% 2.0% 50.7% 4.2% 4.6% 44.7% -9.0% 4.0% 21.2% 40.6% 2.8% 33.7% 18.5% 36.2% 64.6% -56.5% 91.0% 15.3% -26.4% 33.5% 4.8% 39.3% 0.2% 5.1% 37.7% -2.1% 9.0% 17.9% 31.6% 4.2% 26.9% 16.7% Calendar year Returns NIFTY 500 Multicap 50:25:25 TRI Nifty 500 TRI Strong Historical Performance Nifty 500 Multi Cap 50:25:25 over Nifty 500
  • 9.
    9 Better returns withrelatively lower volatility Source: Internal, MFI Explorer; Data for period: 01-Apr-2005 to 31-Jul-2024. 250 trading days are assumed in one year, Risk is denoted by standard deviation. Returns and Risk mentioned above are average of 3 and 5-year rolls. Past performance may or may not be sustained in the future; The above graph is used to explain the concept and is for illustration purpose only and should not be used for development or implementation of an investment strategy or construed as indicative of the scheme's future returns. Nifty 500 Multi Cap 50:25:25 TRI has generated risk-adjusted returns comparable to Nifty 500 TRI 14.1% 13.6% 12.7% 12.3% 3 Year Average Returns 5 Year Average Returns Average Returns NIFTY 500 Multicap 50:25:25 TRI Nifty 500 TRI 9.4% 5.6% 7.8% 5.0% 3 Year Average Risk 5 Year Average Risk Average Risk NIFTY 500 Multicap 50:25:25 TRI Nifty 500 TRI Risk & Return Stats: Multi Caps
  • 10.
    10 3 Year Rolling Returns Nifty500 TRI Nifty 500 Multi Cap 50:25:25 TRI Average 12.7% 14.1% Median 13.2% 14.4% Min -8.7% -10.2% Max 38.2% 38.1% Returns Range Negative 6.4% 8.6% 0% to 10% 27.2% 22.4% 10% to 15% 27.5% 21.7% 15% to 20% 21.0% 17.0% Above 20% 17.9% 30.2% 66% 69% Source : MFI Explorer ; Data for period 01-Apr-2005 to 31-Jul-2024. 250 trading days are considered in one year. Past performance may or may not be sustained in the future; The above table is used to explain the concept and is for illustration purpose only and should not be used for development or implementation of an investment strategy or construed as indicative of the scheme's future returns. The average outperformance of Nifty 500 Multi Cap 50:25:25 TRI over Nifty 500 TRI is 1.4% 69% of the times Nifty 500 Multi Cap 50:25:25 TRI provided double digit returns Multi Caps: Rolling Return Comparison
  • 11.
    11 Ensures better diversificationowing to its asset allocation structure Higher allocation towards Large Cap Source: ACE MF Nxt ; Data as of June 30, 2024 ; Market Cap allocation based on average of all funds in the category The Multi Cap category stands out for its balanced exposure across market caps, as observed in the category average allocation between Multi Cap & Flexi Cap categories. It aims to achieve a diversified portfolio by investing across large, mid, and small-cap segments. Large Cap (%), 64 Mid Cap (%), 16 Small Cap (%), 11 Flexi Cap Large Cap (%), 40 Mid Cap (%), 25 Small Cap (%), 30 Multi Cap Fund Diversified Investment Opportunities Across Market Capitalizations
  • 12.
    PGIM India Multi CapPortfolio Positioning
  • 13.
    13 Our investment processis based on the following pillars: Equity Investment Process Stock Selection Portfolio Construction PGIM India - Equity Investment Process
  • 14.
    14 Fund House Universe Management: ➢ Goodquality management. ➢ Good Capital allocation track record. ➢ Operating cash flow positive in 7 out of 10 years (ex financials) (In companies with less than 10 years of data available, at least 70% of the years should have generated positive operating cash flows). Quality: ➢ Higher than peer average RoE. ➢ Sustainable RoE. Growth: ➢ Higher than peer group growth in earnings. ➢ Sustainable earnings growth. ❑ The starting point for our fund house universe will be all companies with market cap greater than Rs.1,000 crores (including any IPOs). ❑ There are more than 1,000 companies with market capitalization greater than Rs 1000 crores*. *Source: AMFI; Data as of 30-June-2024 Stock Selection Criteria to build fund house universe
  • 15.
    15 Market Cap Valuation Other Factors (e.g.Liquidity, Fund Mandate, Macro Outlook, etc.) Fund House Universe (Around 160-200 Stocks) Final Portfolio Portfolio Construction Principles Diversification High Active Share True to Mandate Designing an Optimal Portfolio Portfolio Construction
  • 16.
    16 25% is theminimum allocation required to be maintained in the respective market cap as per SEBI circular SEBI/HO/IMD/DF3/CIR/P/2020/172 dated September 11, 2020 Large Cap ✓ Concentration ✓ Low churn ✓ Stable long-term companies ✓ Diversified ✓ Medium to High churn ✓ Growth accelerator companies ✓ Reasonable concentration ✓ Medium churn ✓ Steady compounding ideas Minimum 25% ❑ Allocation towards companies exhibiting market share growth, challengers and disruptors Mid Cap Minimum 25% Small Cap Minimum 25% How will PGIM India Multi Cap Portfolio Be Positioned?
  • 17.
    17 Source : IQVIA,Kotak Institutional Equities; Jefferies 661 731 804 915 1048 1143 1225 1355 1503 1569 1855 3050 2012 2013 2014 2015 2016 2017 2018 2019 2020 2021 2022 2027E 3.8 3.1 3 2.9 2.5 1.4 Australia Italy Spain US UK India Beds per 1000 Population Source: OECD, The Center For Disease Dynamics, Economics & Policy, Jefferies Key Trends Followed by the Fund (1/5) Healthcare : Growing and Underpenetrated Market ➢ Indian domestic pharma market is expected to grow at a healthy clip led by rising income levels, government initiatives, increasing life expectancy and increase in insurance coverage. ➢ US generics + Domestic formulations from >50% of revenues and profits for most pharma companies in the listed equities space. The US generic drug market was pegged at US$74bn in CY20. Indian companies accounted for 47% of all generic prescriptions in the US in 2022. ➢ Despite being home to ~1/5th of the global population, India has only ~2.1 MN beds, translating to 1.5 beds per 1,000 persons. To meet the WHO's guideline of 3.5 beds per 1,000 persons, India would need to add ~3 Mn beds in the coming years.
  • 18.
    18 Source : Brokerresearch ; UV - Utility Vehicles ; PV - Passenger Vehicles ; EV - Electric Vehicle ; 2Ws - Two-Wheelers ➢ India has one of the lowest car penetration globally, with just ~30 cars per 1000 population. This compares to ~200+ for China, and more than ~900+ for developed nations like USA/most European countries. ➢ With rising disposable incomes, share of UVs in India has been rising with UVs now 60%+ of the domestic PV industry. ➢ Meanwhile, penetration of 2Ws looks optically higher, it is still much lower vs Asian peers like Indonesia/Thailand and Vietnam. While the volume growth runway for 2Ws is lower vs PVs, we believe premiumisation trend in 2Ws provides scope for continued value growth. ➢ Beyond penetration growth and premiumisation, trends like electrification are gaining foothold in the domestic auto space. 594 583 559 526 495 489 389 351 280 276 183 26 17 70 51 45 31 40 46 35 13 10 8 13 3 4 cars per 1,000 ppulation (LHS) GDP per capita (RHS) 0.2 0.6 1.3 2.3 2.3 9.3 30.8 EV penetration estimated to reach 9% by FY29E FY21 FY22 FY23 FY24 FY25 E FY29 E FY35 E Key Trends Followed by the Fund (2/5) Mobility and Innovation : A Growing Frontier Global country wise car penetration and GDP per capita CY2021 (units per thousand population, ‘000USD)
  • 19.
    19 Source :Broker research ➢Rising per capita income is leading to higher household savings. ➢ From being underserved, underbanked and new to financial systems – today average Indian has adequate access to the financial system through Jan dhan and normal bank accounts, Micro finance and affordable housing, UPI and many such modes ➢ From being traditionally being invested in real estate, gold, physical cash or bank we are seeing movement to risk assets either directly or through professionally managed entities. ➢ Inflows in financial instruments like equities have seen a phenomenal rise and are led by a) Direct retail trading in the stock market b) Discretionary flows into MFs (i.e., inflows into MFs ex-SIP); c) Flows into MFs via SIPs; and d) Flows via other sources such as equity component of insurance, etc. Key Trends Followed by the Fund (3/5) Financialization : Rising at a Brisk Pace, Expected to Continue
  • 20.
    20 Source : Brokerresearch ➢ Out of total population in India, middle class segment was at 31% which is expected to see exponential rise to 47% in 2031 and 61% in 2047 due to rise in Income per capita. When there is such an exponential rise in middle class population, it leads to significant rise in disposable income leading to rise in discretionary spends. ➢ Over FY18-23, India saw a 7.2% CAGR in Per capita income, which is expected to accelerate to 9.3% in FY23-29, while China’s per capita income growth is expected to slow down from 8.7% (2018-23) to 7.2% (2023-29). Rise in per capita income at an accelerated pace will aid in increasing disposable income for the Indian population. ➢ In 2000, median age was 21.6 in India which has increased to 28.2 in 2023 with a total population of 145cr, which depicts that India has the largest young working population in the world. Median age is expected to go to 38.1 by 2050, thus, for the next 16 years, working population mix will continuously be high leading to very high productivity. 28.2 38.1 1955 1960 1965 1970 1975 1980 1985 1990 1995 2000 2005 2010 2015 2020 2022 2023 2025 2030 2035 2040 2045 2050 India Median Age (Yrs) 8.7% 7.2% 7.2% 9.3% 6.0% 6.0% 2018-23 2023-29 Growth in Per capita income (5yr CAGR) China India Emerging and Developing Asia (RHS) 0 200 400 600 800 1000 1200 > INR 3Mn INR 0.5 - 3Mn INR 0.125 - 0.5Mn < 0.125Mn Rich Middle Class Aspirers Destitutes (Population in Mn) India's Income Pyramid 2015-16 2020-21 2030-31 (P) 2046-47 (P) Key Trends Followed by the Fund (4/5) Consumption: Higher per capita income to give a J- Curve for demand
  • 21.
    21 Source : MNRE; GW – gigawatt ; COP26 - 26th Conference of the Parties Key Trends Followed by the Fund (5/5) New Energy: Expanding at a Scorching Pace ➢ Inspite of being a relative late starter, India has already become the 4th largest renewable energy installed capacity country. ➢ The country has set an enhanced target at the COP26 of 500 GW of non-fossil fuel-based energy by 2030. This is the world's largest expansion plan in renewable energy. ➢ India’s installed non-fossil fuel capacity has increased 396% in the last 8.5 years and stands at more than 203.19 GW (including large Hydro and nuclear), about 45.5% of the country’s total capacity (as of Jun 2024) . ➢ India aims to produce 5 Mn Tonnes of green hydrogen by 2030. ➢ India has set a target to reduce the carbon intensity of the nation’s economy by less than 45% by the end of the decade, achieve 50 percent cumulative electric power installed by 2030 from renewables, and achieve net-zero carbon emissions by 2070. 35.8 4.1 7.1 11.5 12.1 8.8 8.8 7.5 14.1 15.3 18.5 148.1 Total FY14 FY15 FY16 FY17 FY18 FY19 FY20 FY21 FY22 FY23 FY24 Total FY24 Renewable Capacity (ex-hydro projects) (GW) Total FY15 – FY24
  • 22.
    22 3S framework forstock picking: Scalable, Sustainable, Structural : ➢ Scalable : Focus on companies with the potential to continue growing their revenue at an accelerated pace. ➢ Sustainable : Prioritize companies achieving above-average growth at comparatively lower costs as they scale. ➢ Structural : Seek companies with a longer runway for above-average growth and profitability, driven by clear, visible triggers The portfolio construction approach is bottoms-up and well-diversified. Growth at a Reasonable Price (GARP) focused strategy with flexibility to adjust between short, medium and long-term growth opportunities based on market conditions. May allocate to turnaround ideas, event-driven opportunities, and stocks showing momentum driven by earnings growth in the medium to long term. These are based on the Fund Managers’ outlook and are subject to change. The scheme may or may not invest in above themes. These themes may change depending upon the market conditions. 1 2 3 4 Themes / Styles in the Fund
  • 23.
  • 24.
    24 Scheme Name PGIMIndia Multi Cap Fund Type of scheme An open-ended equity scheme investing across large cap, mid cap, small cap stocks. Investment objective The investment objective of the scheme is to seek to generate long-term capital appreciation by investing in a portfolio of equity and equity related securities across large cap, mid cap, small cap stocks. However, there can be no assurance that the investment objective of the Scheme will be achieved. The Scheme does not guarantee/ indicate any returns. Plan / Options IDCW** (Payout of Income Distribution cum Capital Withdrawal option / Reinvestment of Income Distribution cum Capital Withdrawal option) and Growth. Minimum Application Amount Initial Purchase/ Switch-in - Minimum of Rs. 5,000/- and in multiples of Re. 1/-thereafter. Additional Purchase - Minimum of Rs. 1,000/- and in multiples of Re. 1/-thereafter. For SIPs - Minimum no. of 5 installments and Minimum amount per installment - Rs. 1,000/- each and in multiples of Rs.1/- thereafter. Exit Load For Exits within 90 days from date of allotment of units : 0.50%. For Exits beyond 90 days from date of allotment of units : NIL Fund Manager Mr. Vivek Sharma (Equity Portion) Mr. Anandha Padmanabhan Anjeneyan (Equity Portion) Mr. Utsav Mehta (Equity Portion) Mr. Puneet Pal (Debt Portion) Benchmark Index Nifty 500 Multi Cap 50:25:25 TRI **Income Distribution cum Capital Withdrawal option About PGIM India Multi Cap Fund
  • 25.
    25 The Product labelingassigned during the NFO is based on internal assessment of the scheme characteristics or model portfolio and the same may vary post NFO when actual investments are made. PGIM India Multi Cap Fund (An open-ended equity scheme investing across large cap, mid cap, small cap stocks.) The information contained herein is provided by PGIM India Asset Management Private Limited (the AMC) on the basis of publicly available information, internally developed data and other third party sources believed to be reliable. However, the AMC cannot guarantee the accuracy of such information, assure its completeness, or warrant such information will not be changed. The information contained herein is current as of the date of issuance* (or such earlier date as referenced herein) and is subject to change without notice. The AMC has no obligation to update any or all of such information; nor does the AMC make any express or implied warranties or representations as to its completeness or accuracy. There can be no assurance that any forecast made herein will be actually realized. These materials do not take into account individual investor's objectives, needs or circumstances or the suitability of any securities, financial instruments or investment strategies described herein for particular investor. Hence, each investor is advised to consult his or her own professional investment / tax advisor / consultant for advice in this regard. The information contained herein is provided on the basis of and subject to the explanations, caveats and warnings set out elsewhere herein. The views of the Fund Manager should not be construed as an advice and investors must make their own investment decisions regarding investment/ disinvestment in securities market and/or suitability of the fund based on their specific investment objectives and financial positions and using such independent advisors as they believe necessary. © 2024 Prudential Financial, Inc. (PFI) and its related entities. PGIM, the PGIM logo, and the Rock symbol are service marks of Prudential Financial, Inc., and its related entities, registered in many jurisdictions worldwide. Mutual fund investments are subject to market risks, read all scheme related documents carefully. Compliance no. 94/2024-25 Riskometer and Important Disclosures *Investors should consult their financial advisers if in doubt about whether the product is suitable for them.
  • 26.
  • 27.
    27 Source: Niftyindices, BSE.*YTD. Data as of 31-Jul-24 MoM represents Nifty 200 Momentum 30 TRI, Low vol represents BSE Low Volatility TRI. Quality represents BSE Quality TRI, Value represents BSE Enhanced value TRI, Nifty 200 in the table is Total Return Index. It should not be construed to be indicative of scheme performance in any manner. Past performance may or may not be sustained in the future. Is a Style Rotation Underway? ✓ While Value has led in recent years, the latest 1- and 3-month data suggest a potential shift, with Quality outperforming other styles 2020 2021 2022 2023 2024* Low Vol 26.8% Value 56.9% Value 26.3% Value 62.2% Value 40.5% Quality 26.0% Mom. 53.8% Quality 13.0% Mom. 41.7% Mom. 36.2% Mom. 20.0% Nifty 200 28.9% Nifty 200 4.9% Quality 34.4% Quality 34.4% Nifty 200 16.8% Quality 19.4% Low Vol 4.5% Low Vol 30.8% Low Vol 20.8% Value 12.8% Low Vol 19.3% Mom. -5.4% Nifty 200 24.7% Nifty 200 20.9% 1 Months 3 Months Quality 7.6% Quality 20.8% Value 6.8% MoM. 14.0% MoM. 5.0% Nifty 200 12.4% Low Vol 4.4% Value 11.3% Nifty 200 4.4% Low Vol 10.5%
  • 28.
    28 Source: MFI Explorer,Internal data for period : 01-Apr-2005 to 31-Jul-2024. 250 trading days are considered in one-year. Past performance may or may not be sustained in the future; The above graph is used to explain the concept and is for illustration purpose only and should not be used for development or implementation of an investment strategy or construed as indicative of the scheme's future returns. On a 3-year rolling returns basis, Nifty 500 Multi Cap 50:25:25 TRI has outperformed Nifty 500 TRI 69% of times. The average outperformance is 1.4% Relative Outperformance Nifty 500 Multi Cap 50:25:25 TRI over Nifty 500 TRI -6% -4% -2% 0% 2% 4% 6% 8% Relative outperformance on a 3 years Rolling returns basis Excess Returns Average Outperformance
  • 29.
    29 Multi Cap Index(Nifty 500 Multi Cap 50:25:25 TRI) has outperformed Nifty 500 TRI over the long term Source: MFI Explorer. Data from 01-Apr-2005 to 31-Jul-2024. Past performance may or may not be sustained in the future; The above graph is used to explain the concept and is for illustration purpose only and should not be used for development or implementation of an investment strategy or construed as indicative of the scheme's future returns. 2,117 100 1,604 NIFTY 500 Multicap 50:25:25 TRI Nifty 500 TRI Historical Performance
  • 30.
    30 Source: Bloomberg, NSE; Data as of July 31, 2024 1.8 3.2 4.1 6.2 6.3 7.1 8.8 10.8 11.9 14.7 25.1 1.3 3.3 4.6 7.5 8.1 5.7 9.8 9.1 11.6 11.7 27.5 Real Estate Communication Services Utilities Consumer Staples Energy Health Care Information Technology Materials Consumer Discretionary Industrials Financials Nifty 500 Nifty 500 Multicap 50:25:25 Multi Caps: Opportunities to Participate in Different Segments and Sectors
  • 31.
    31 Flexi Cap CategoryMulti Cap Category Meaning No restriction on investing in large, mid, or small cap stocks. Mandatorily allocate at least 25% each to large, mid, and small-cap stocks. Nature Balanced with flexibility in allocating based on the fund manager's outlook. Disciplined, with mandatory allocation in each market cap irrespective of outlook. Active management A fund manager can allocate the majority in any size of the company based on their outlook A fund manager must mandatorily allocate at least 25% in each market cap irrespective of his outlook Risk Higher risk due to flexibility in allocating a majority to small caps Lower risk due to mandatory allocation in each market cap. Category Allocation As of 30 June 2024, the category average allocation of Flexicap is skewed toward large caps i.e., 64% and the rest in mid and small caps As of 30 June 2024, the category average allocation of Multi Cap is more diversified across market caps with the allocation of 40%, 25%, and 30% in large, mid, and small caps respectively Source: ACE MF Nxt ; Data as of June 30, 2024 ; Market Cap allocation based on average of all funds in the category Difference between Flexi Cap and Multi Cap Category
  • 32.
    32 Multi Caps: Combinationof Large, Mid & Small caps Risk Probability Return Potential Large Cap Funds Flexi Cap Funds Large & Midcap Funds Multi Cap Funds Mid Cap Funds Small Cap Funds The above graph is used to explain the concept and is for explanatory purpose only and should not used for development or implementation of an investment strategy Mid cap: 0%-100% Small cap: 0%-100% Mid cap: 35% - 65% Mid cap 25%-50% Small cap 25%-50% Mid Cap: 65%-100% Small Cap: 65%-100% Risk Return Positioning Large cap: 80%-100%
  • 33.
    33 ➢ The Indianaviation market is highly underpenetrated with one of the lowest domestic and international seats per capita in the world. This provides huge headroom for growth with only 6.5% Indians holding a valid passport. ➢ Aviation research firm CAPA estimates that the Indian aviation passenger traffic will increase from 225m in FY24 (70m international) to 510m by FY30 (160m international). ➢ This growth would be enabled by accelerated infrastructure expansions, with the number of airports likely to reach 220 from 140 in CY19. ➢ Indian players also have robust aircraft addition plans, with domestic players accounting for ~32% of the total aircraft orders placed in CY23 (only for Boeing and Airbus). India is expected to be the third-largest country in terms of fleet size by CY35. Large Cap : Aviation 57.9 60.7 70.1 85.2 103.7 123.3 140.3 141.2 53.3 84.2 136.0 40.3 43.1 45.7 49.8 54.7 60.6 63.9 60.8 8.8 21.2 54.6 98.2 103.7 115.8 135.0 158.4 183.9 204.2 202.0 62.1 105.4 190.6 -----Passengers (In Million)----- Domestic Passengers International Passengers Total Passengers Passenger traffic carried by scheduled carriers over last ten years Source : CAPA Understanding Stock Categories (1/3)
  • 34.
    34 Source : BrokerResearch Healthy growth of Indian market Mid Cap : Electronics Manufacturing 4.6 5.6 6.6 6.9 7.3 9 10.9 12.7 15.3 19 23.5 28.8 FY17 FY18 FY19 FY20 FY21 FY22 FY23 FY24 FY25 FY26 FY27 FY28 Indian Electronics Market (INR trn) Understanding Stock Categories (2/3) ➢ Government has implemented a comprehensive set of incentives aimed at improving critical infrastructure and reducing manufacturing and capital expenditure costs. ➢ These initiatives are poised to propel strong growth (expected at 30% or more) in India’s nascent Electronics Manufacturing Services (EMS) industry, potentially elevating its share in the global EMS market from 2% to 7%. ➢ This growth is underpinned by several factors, including (1) large captive demand (with per capita consumption of electronics only a quarter of the global average); (2) the proliferation of electronics in everyday products; (3) import substitution strategies; and (4) rising exports. Moreover, concerted efforts are being made to develop the entire EMS value chain, fostering increased value addition and the creation of a local component ecosystem, which could further enhance the industry’s cost competitiveness
  • 35.
    35 ➢ While weare positive on consumer discretionary sector, with that sector travel and tourism offers sustainable growth prospects. ➢ Sustained tailwinds of travel, reducing replacement cycles, mindset change (utility to fashion) and unbranded to branded shift have driven and will continue driving growth for branded players. ➢ Players with good return ratios and the ones gaining market share have done well. Source : Broker Research Small Cap : Travel 39 44 48 50 52 54 56 58 60 61 56 52 50 48 46 44 42 40 CY19 CY20 CY21 CY22 CY23 CY24 E CY25 E CY26 E CY27 E Market Split Branded Unbranded Understanding Stock Categories (3/3)
  • 36.