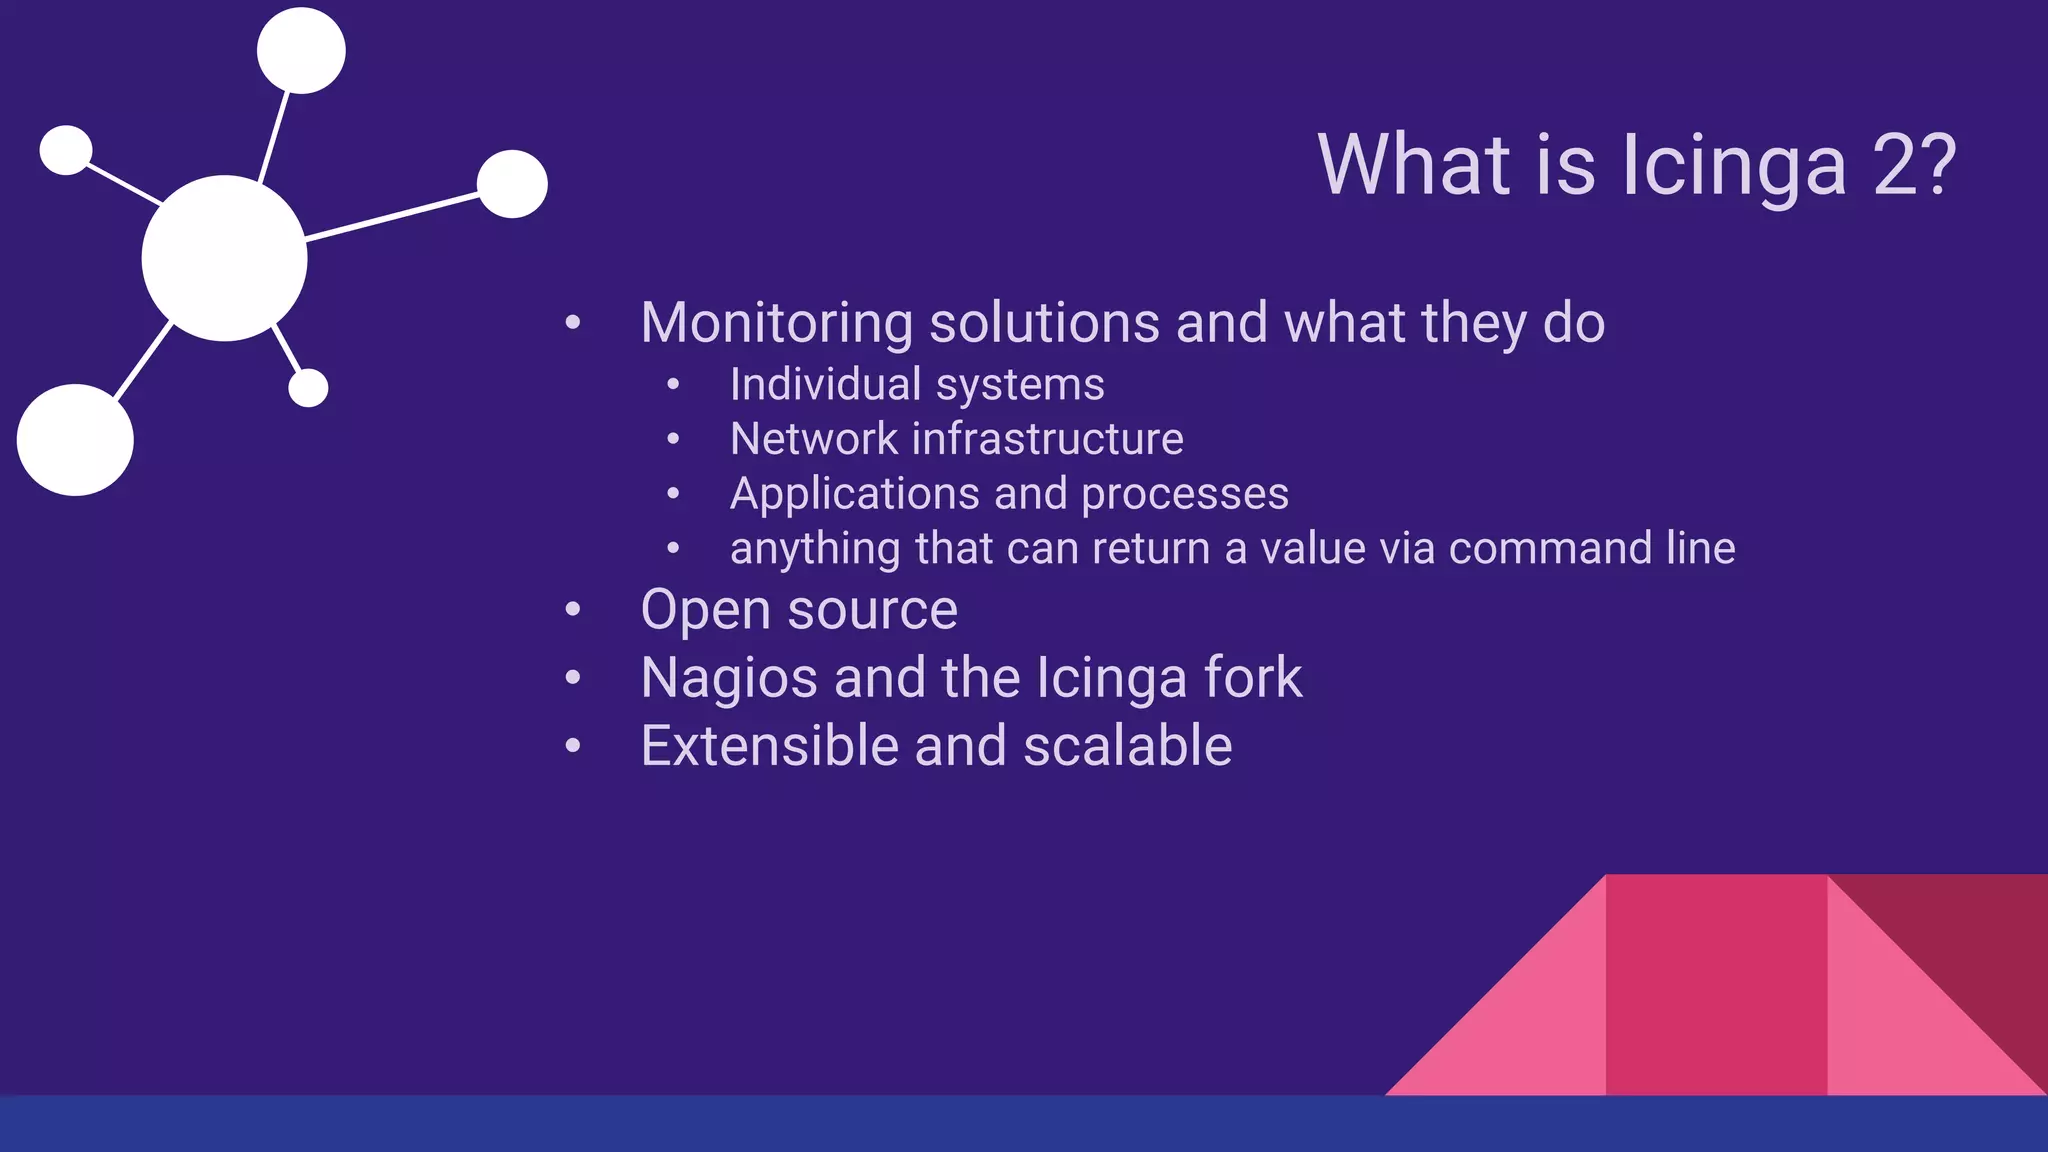
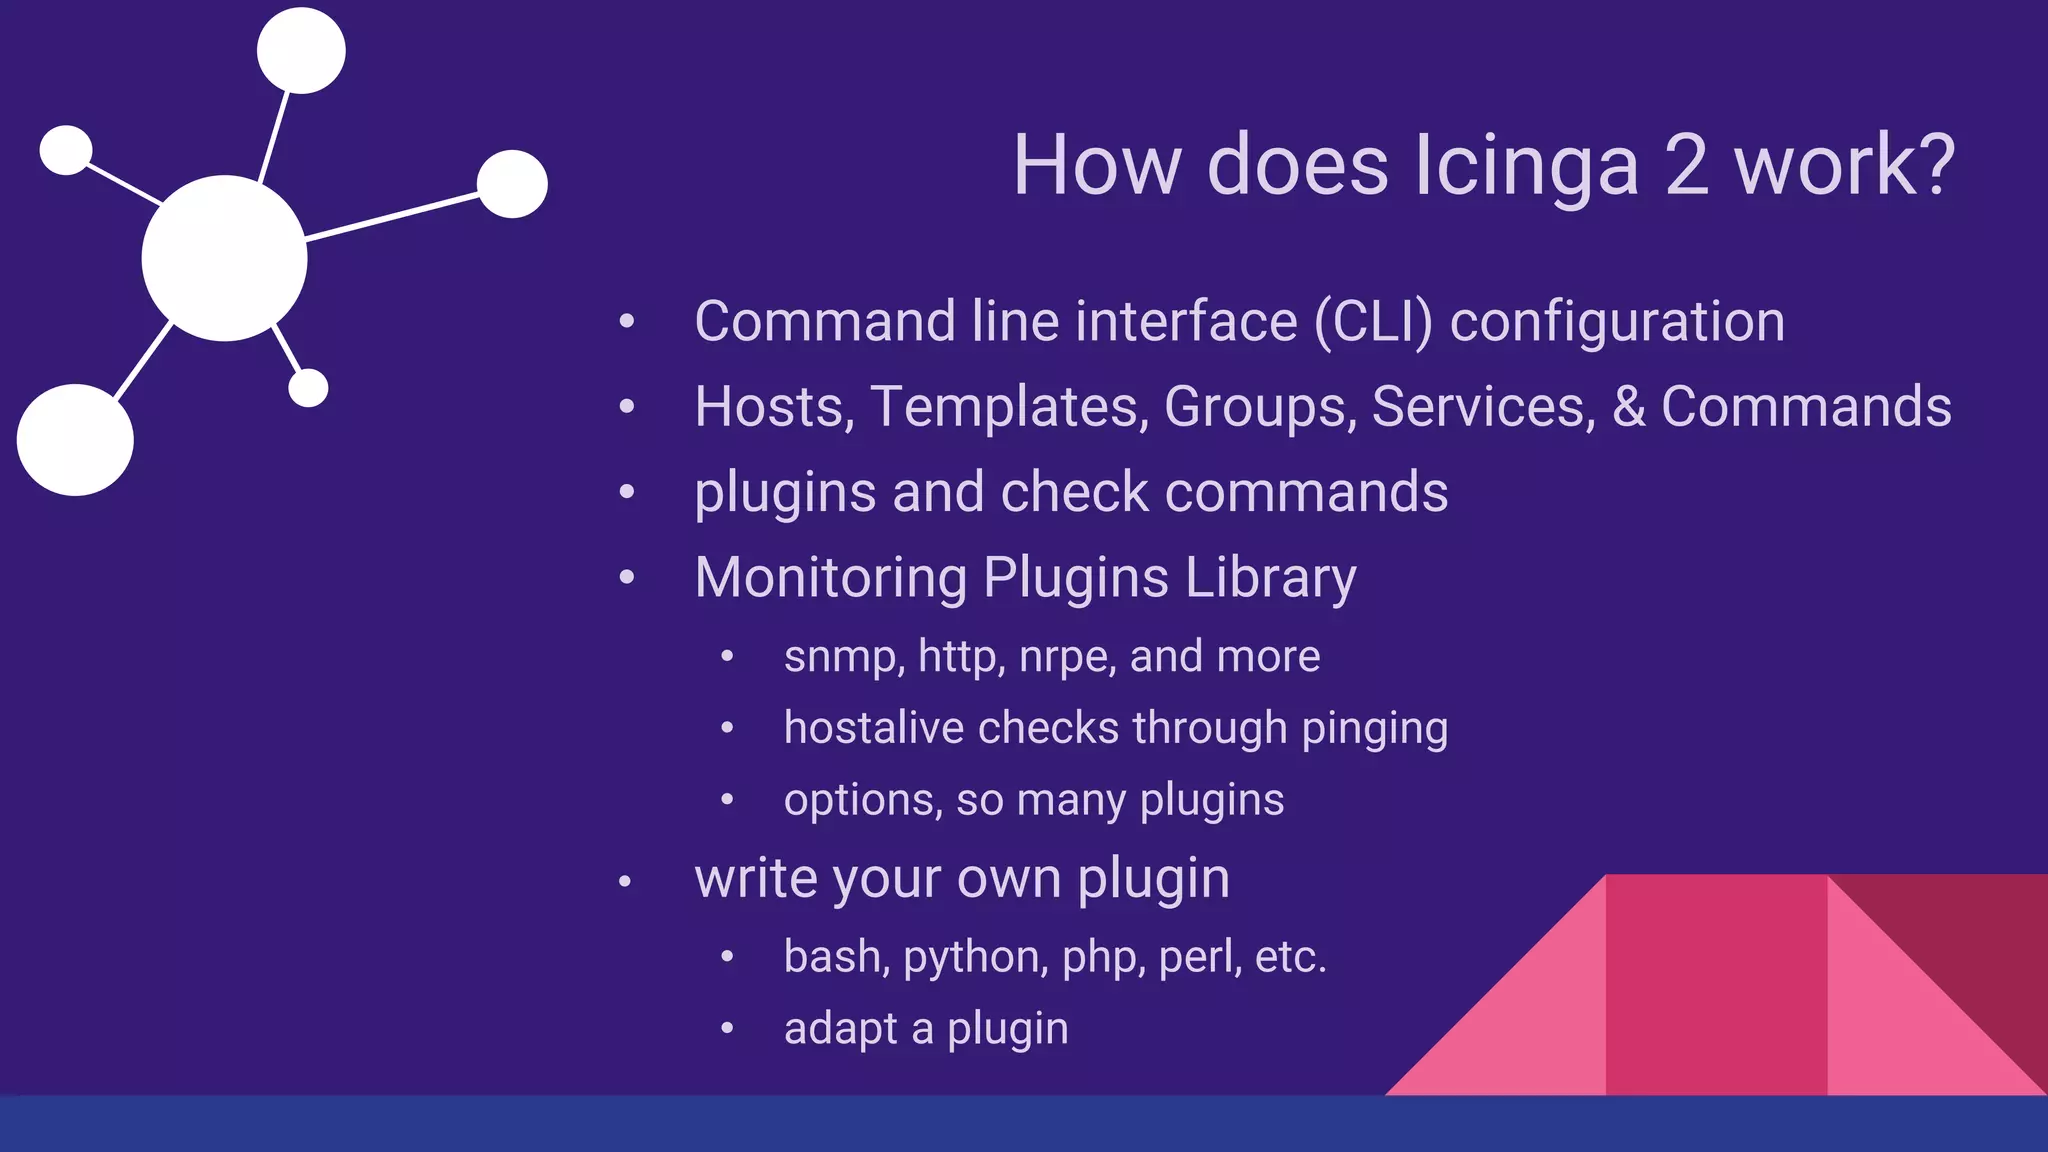
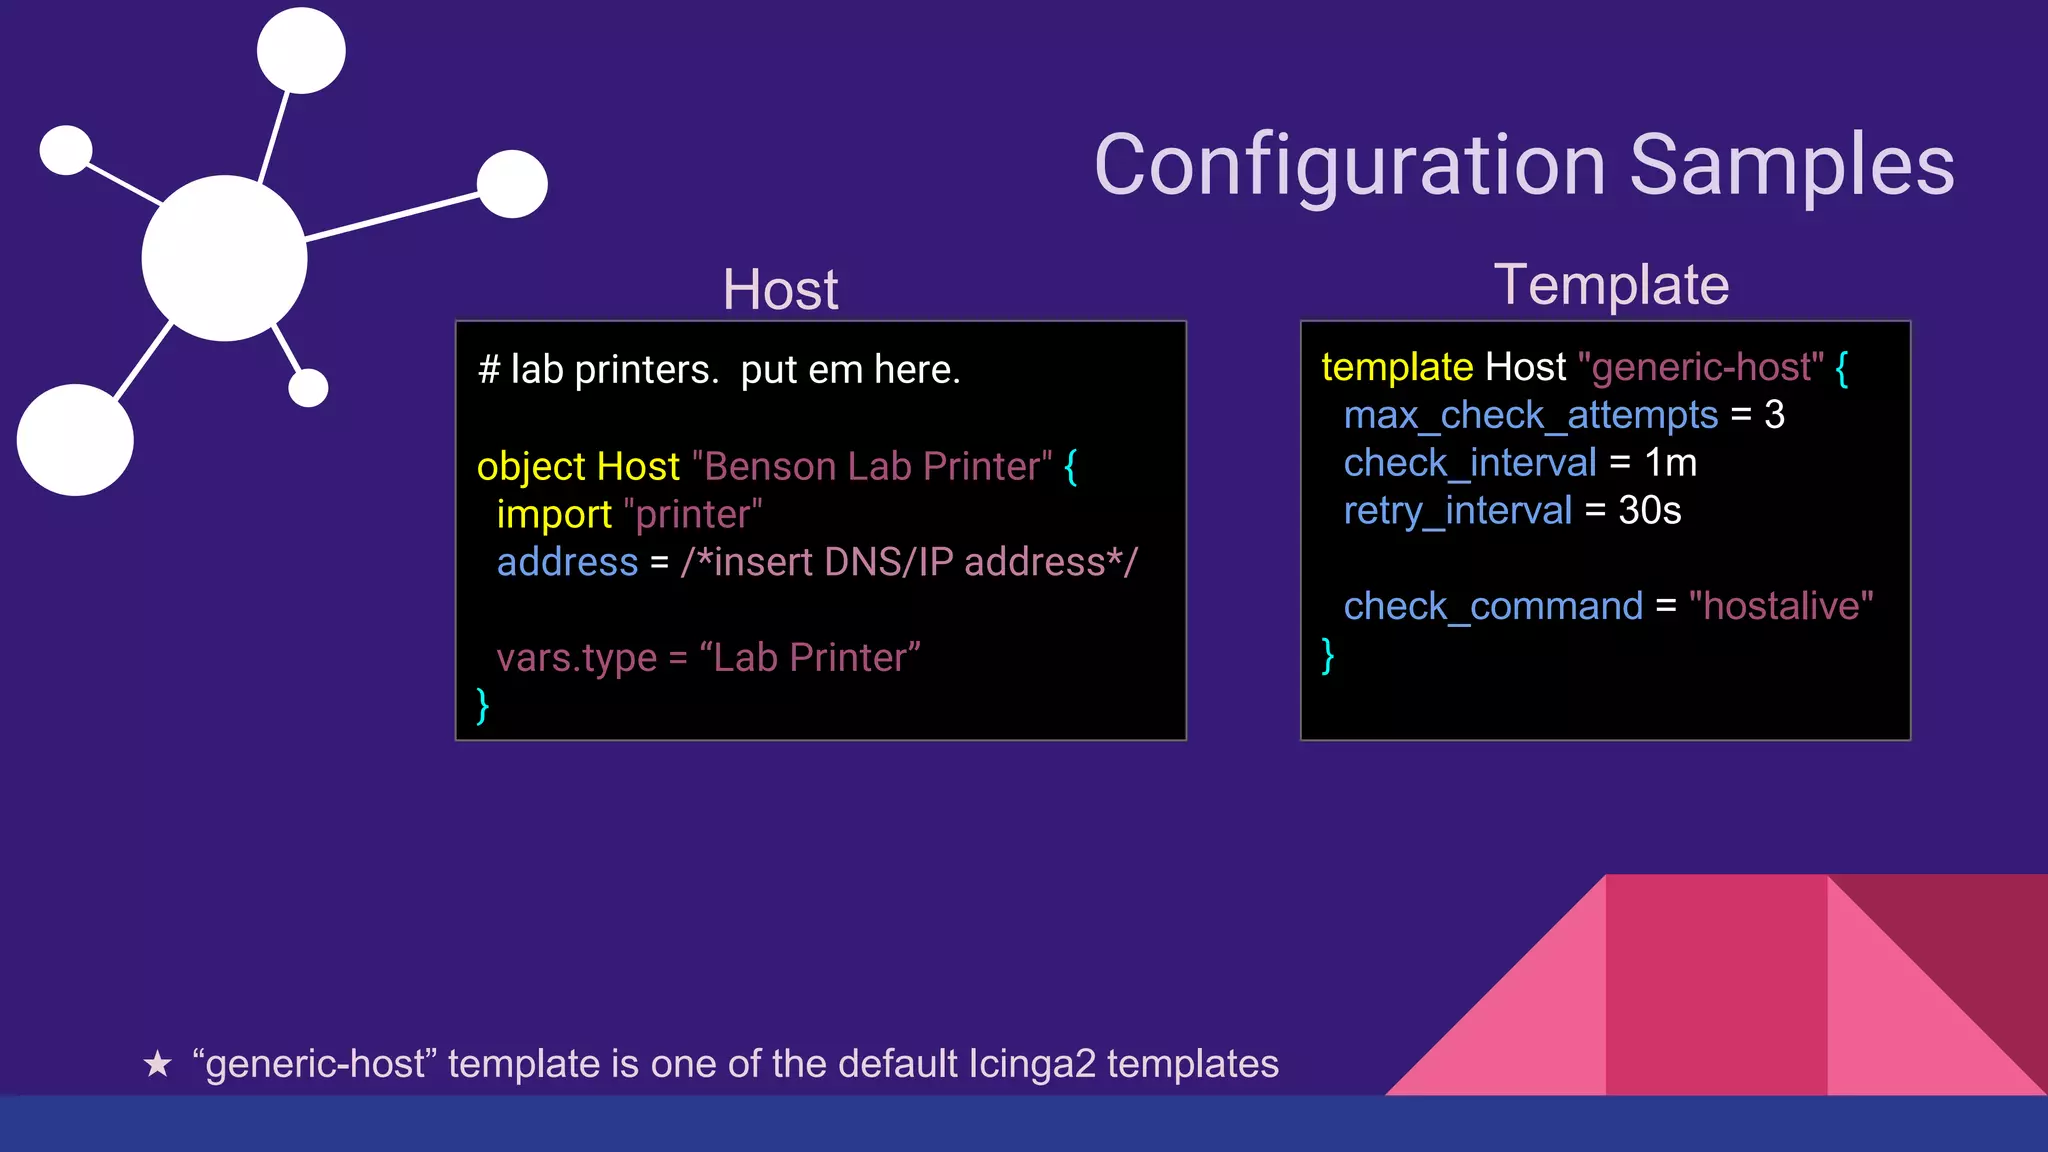
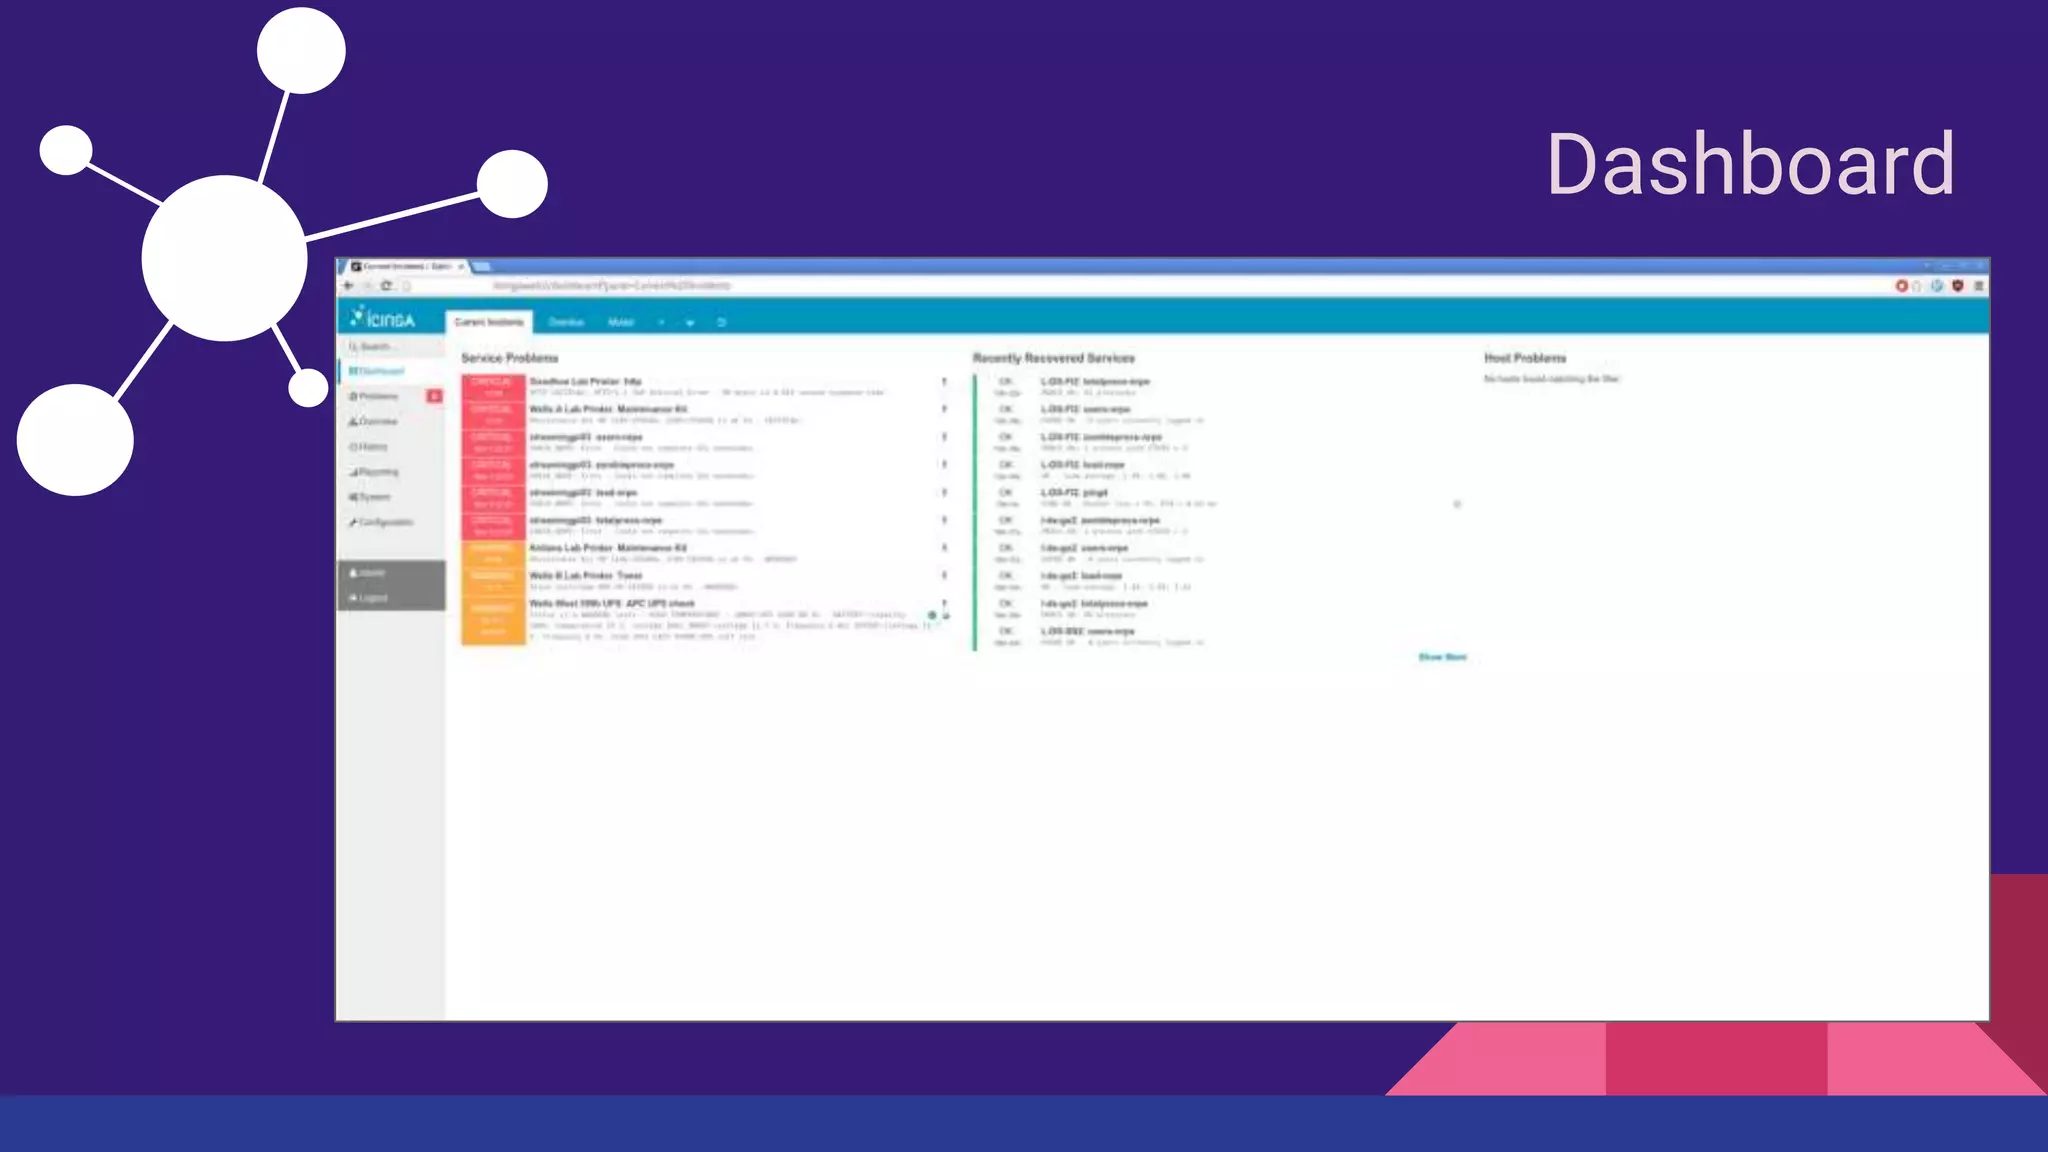
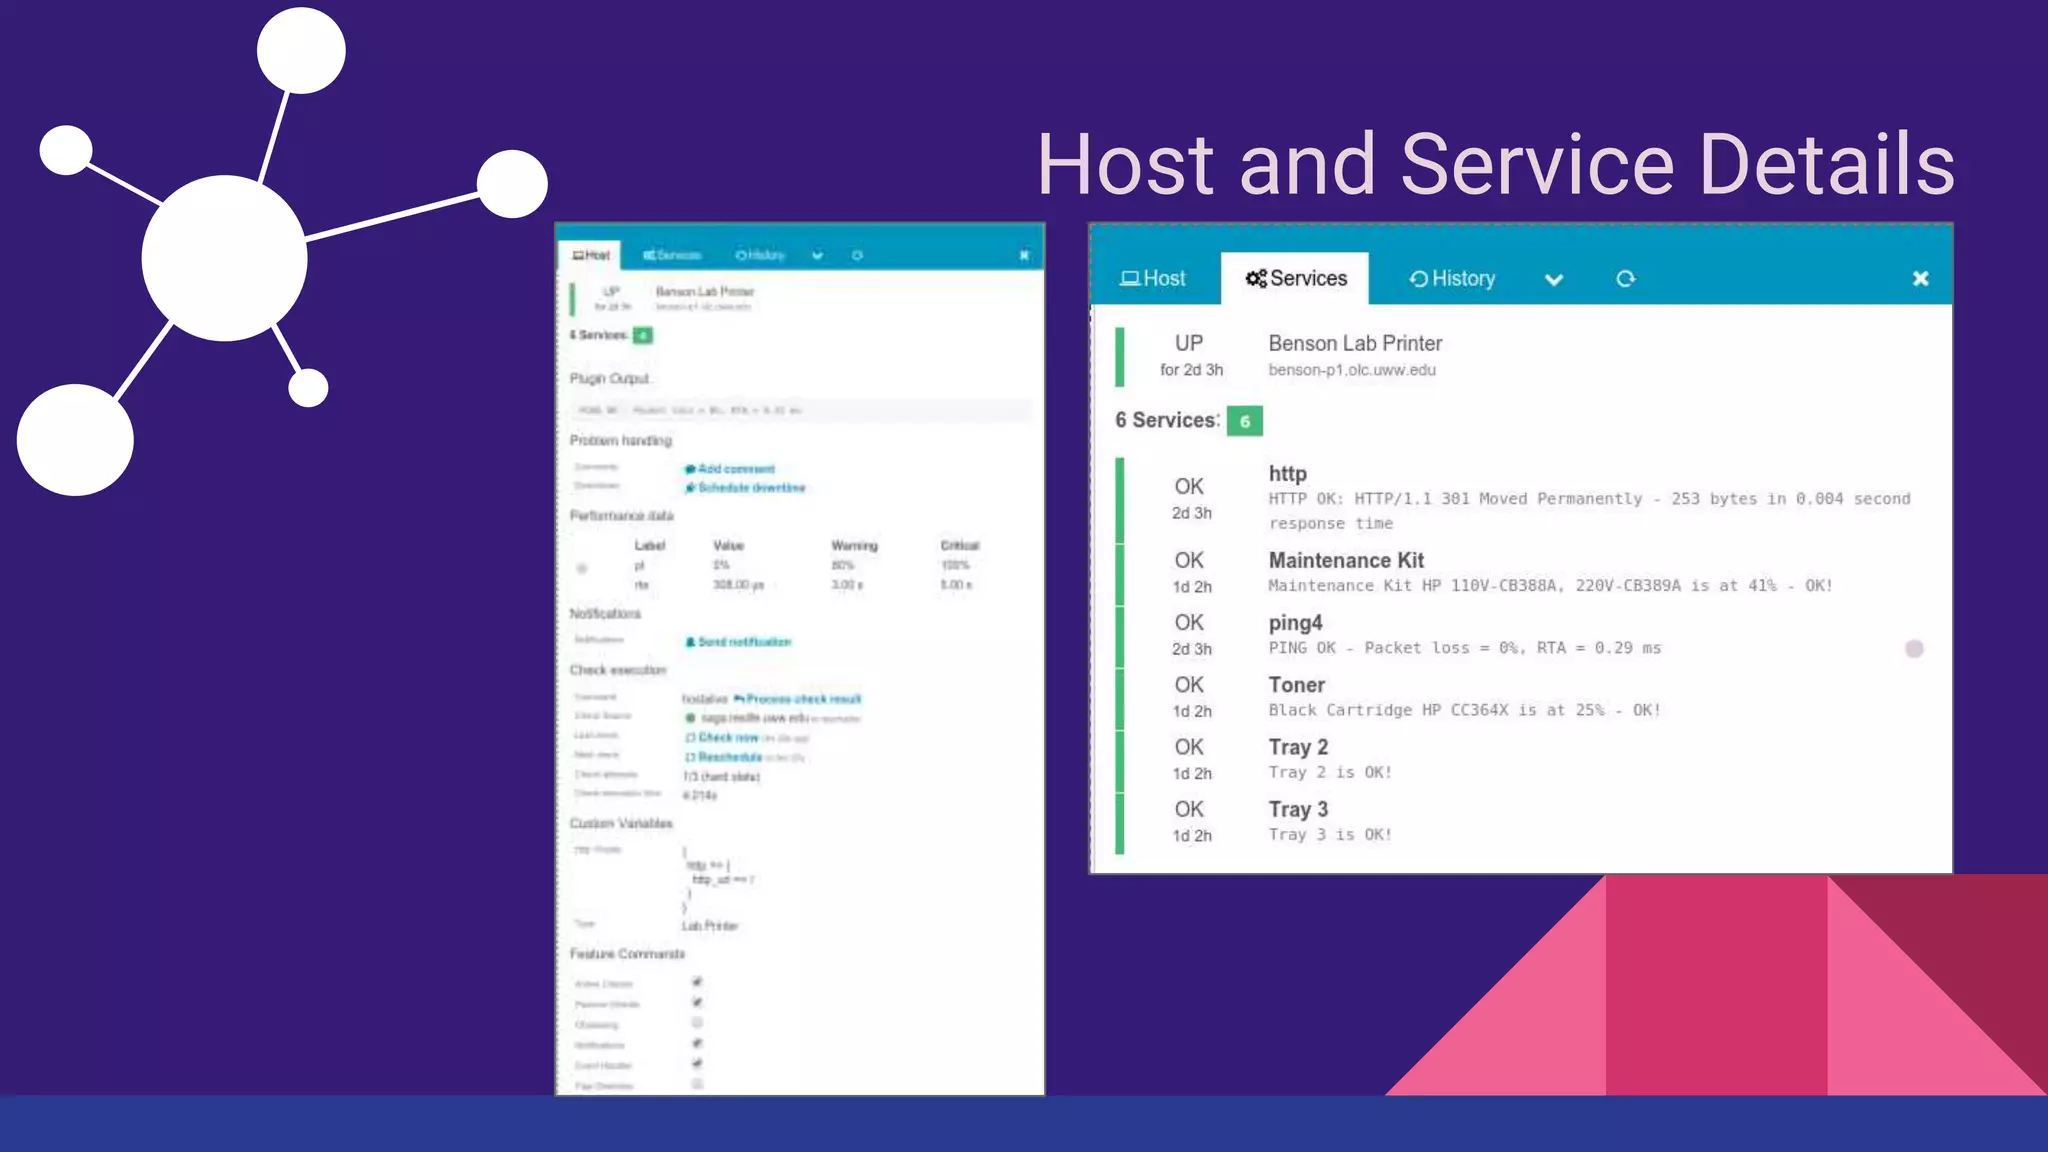
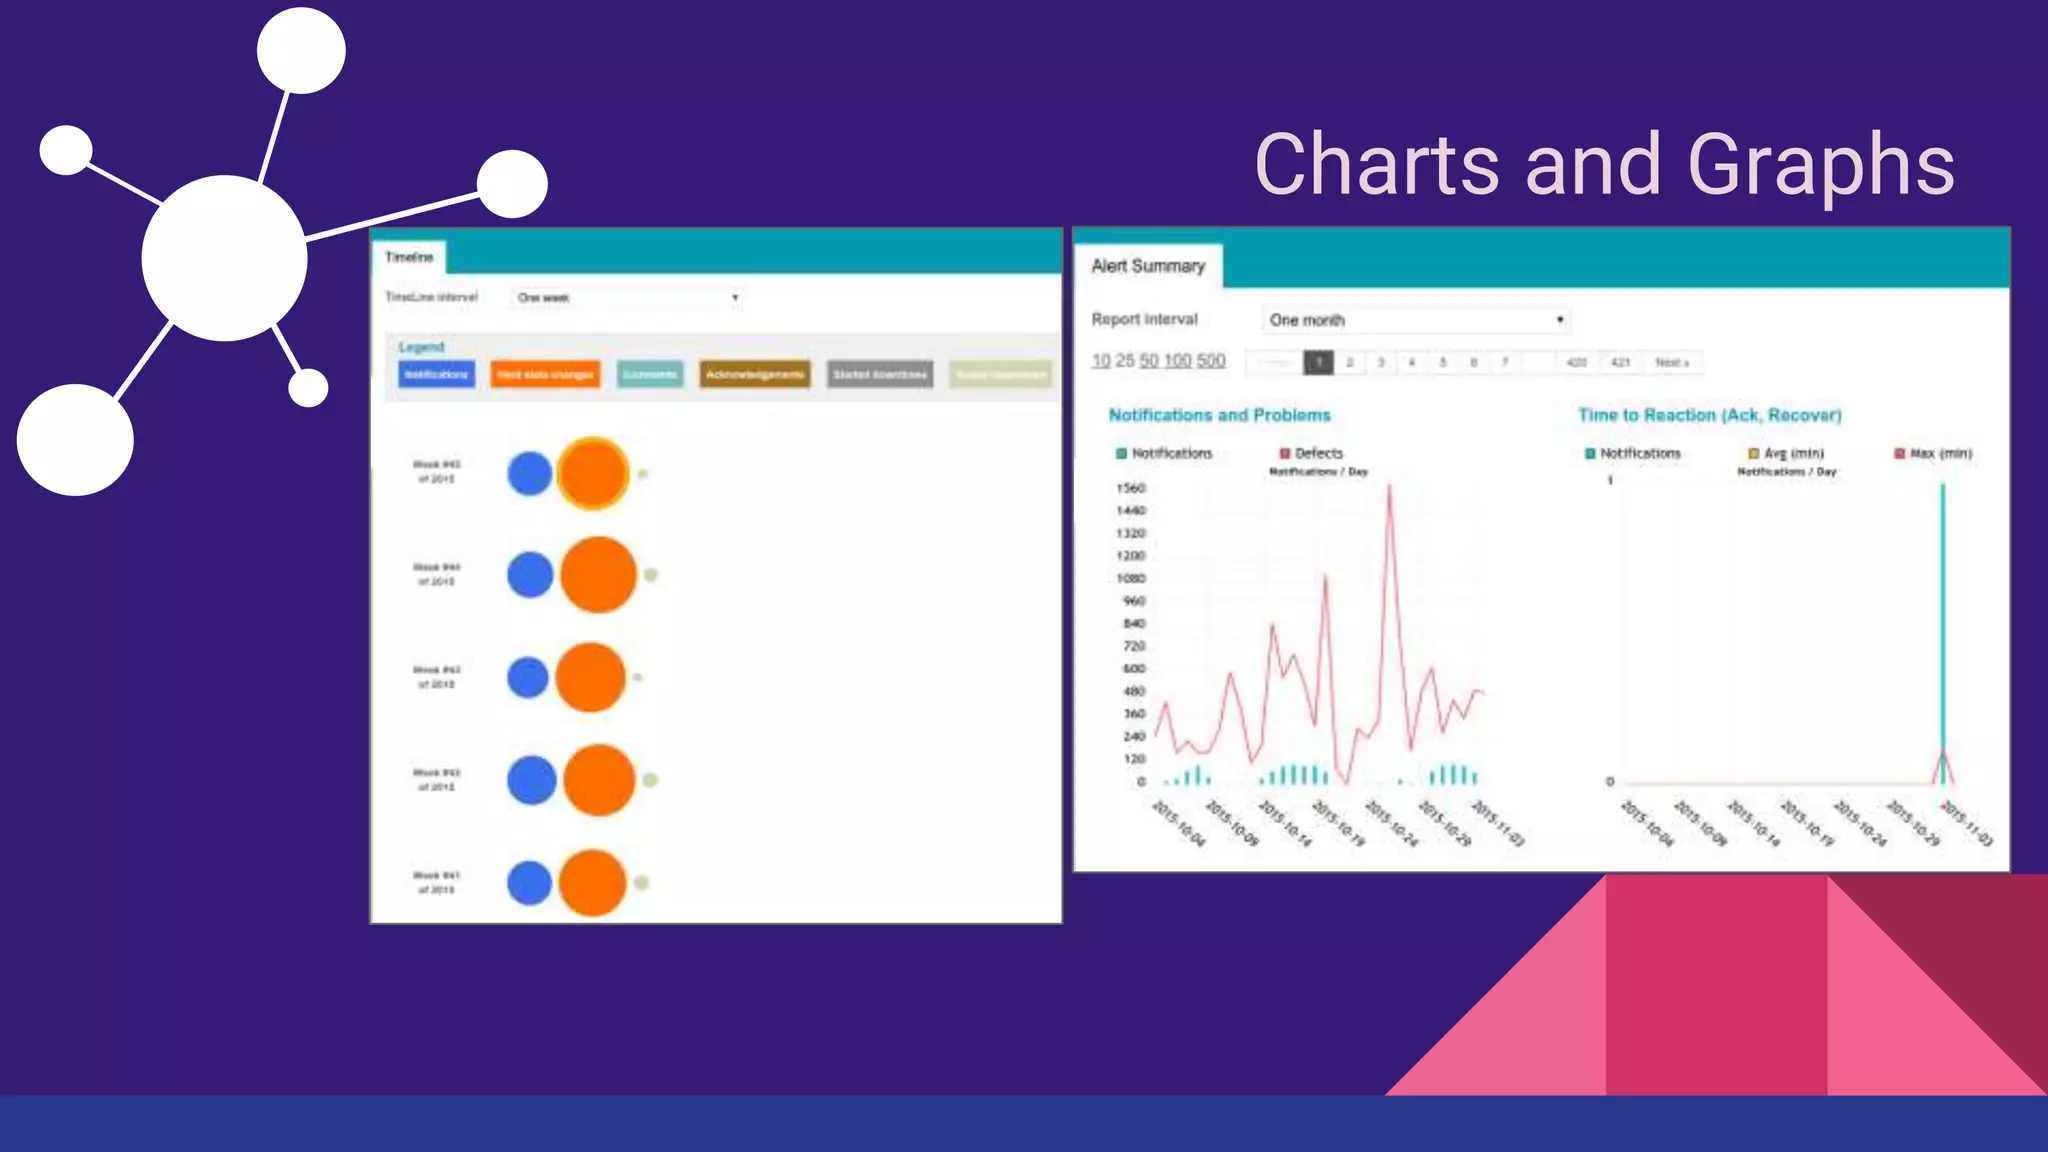
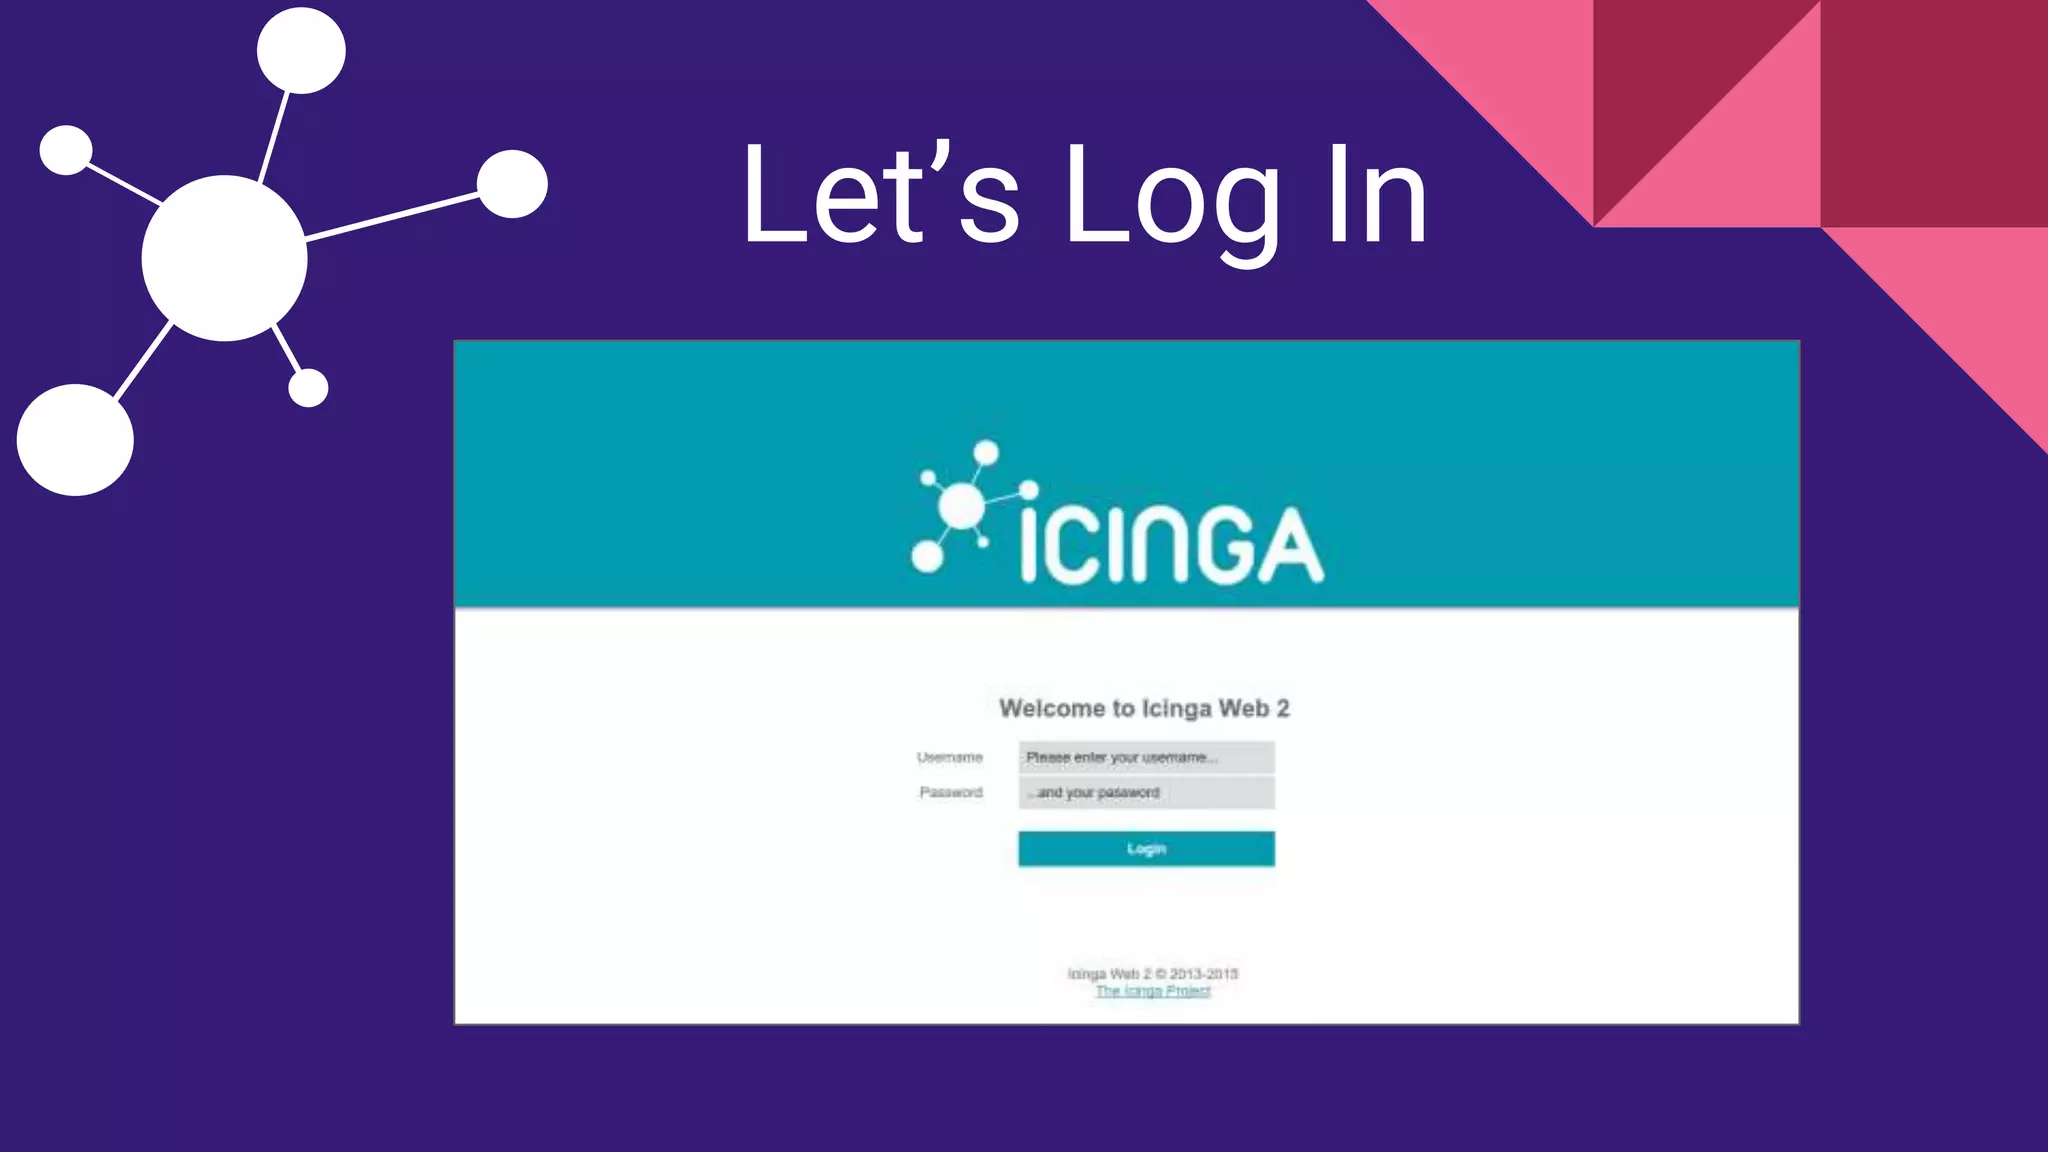
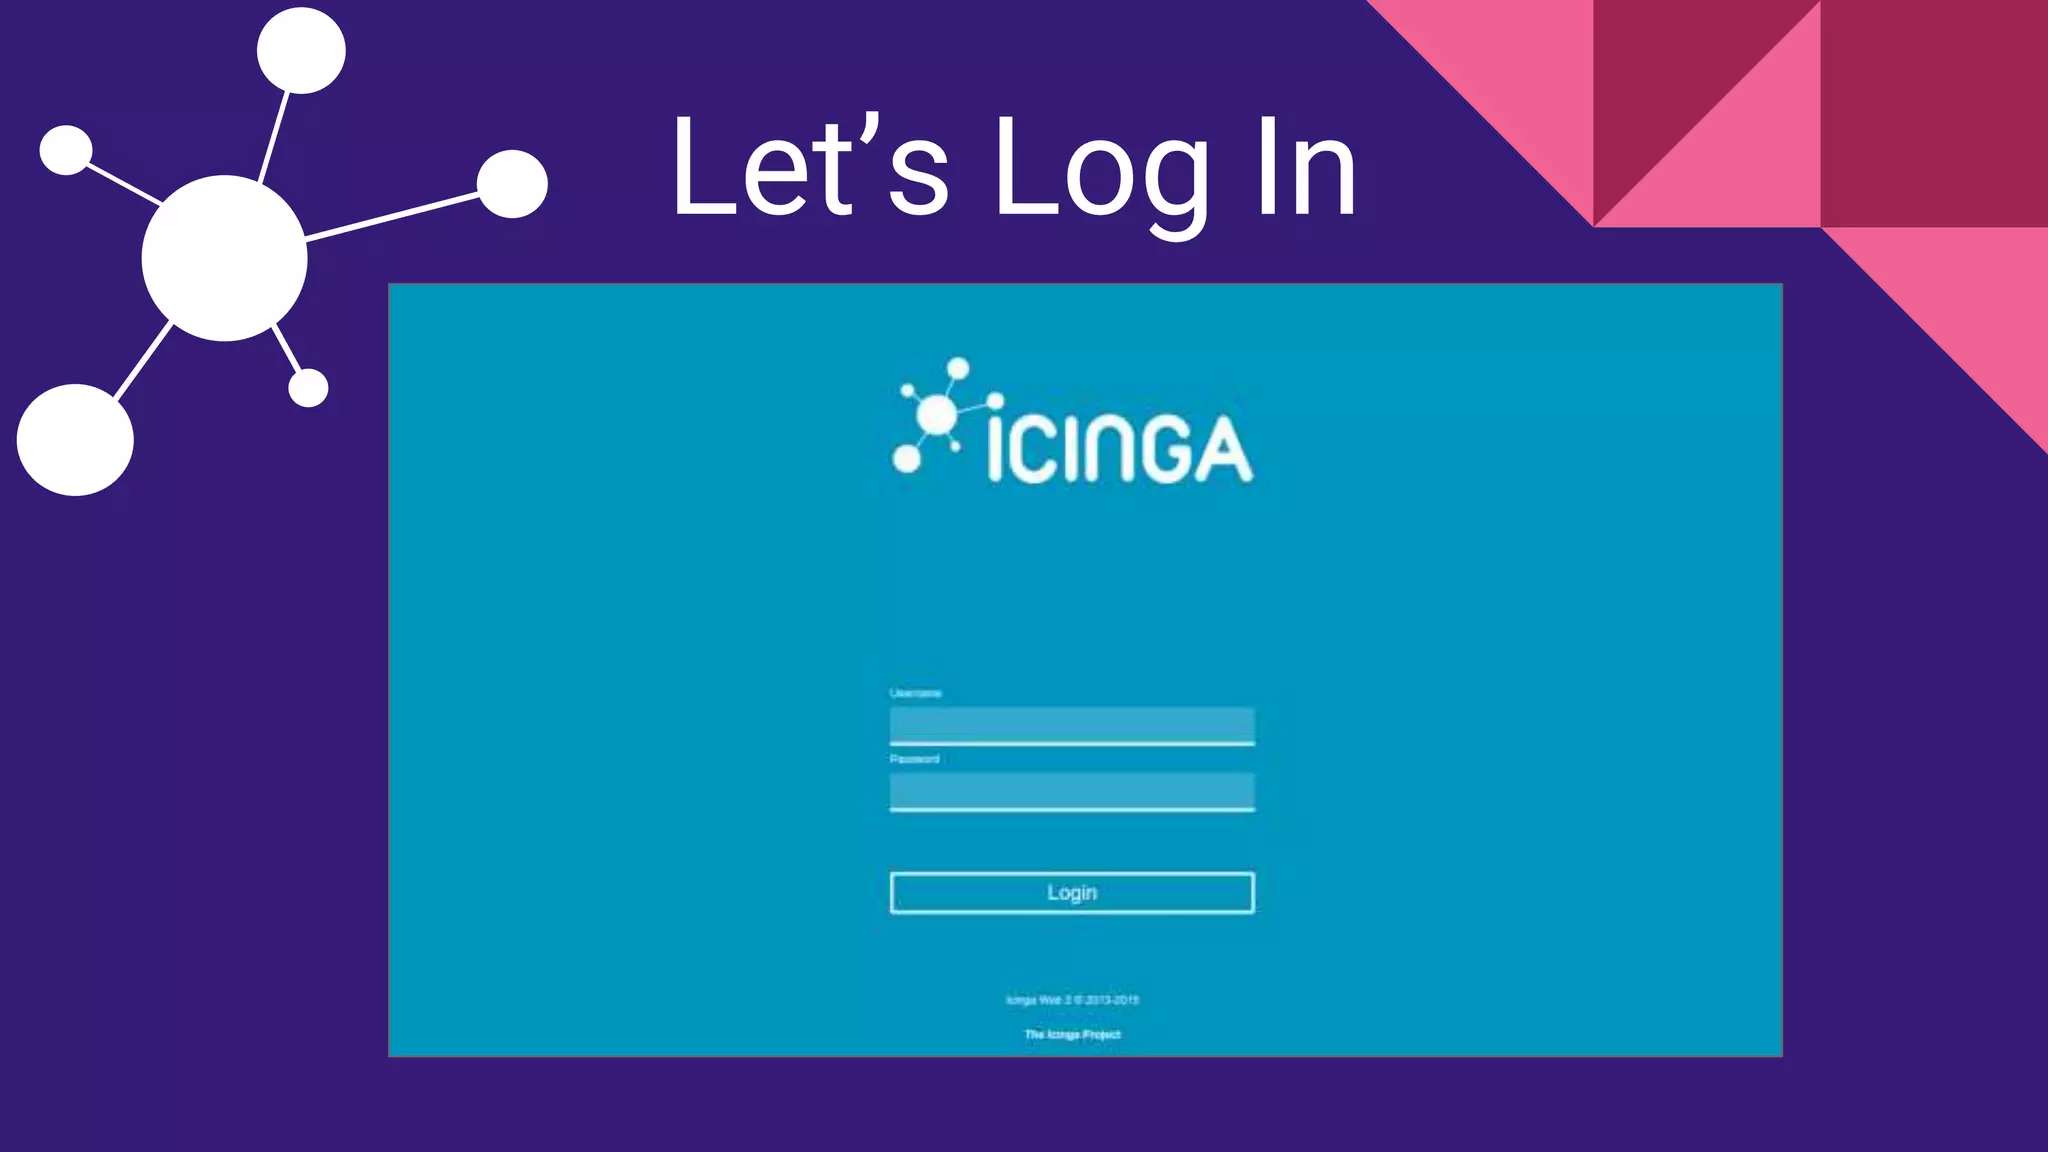
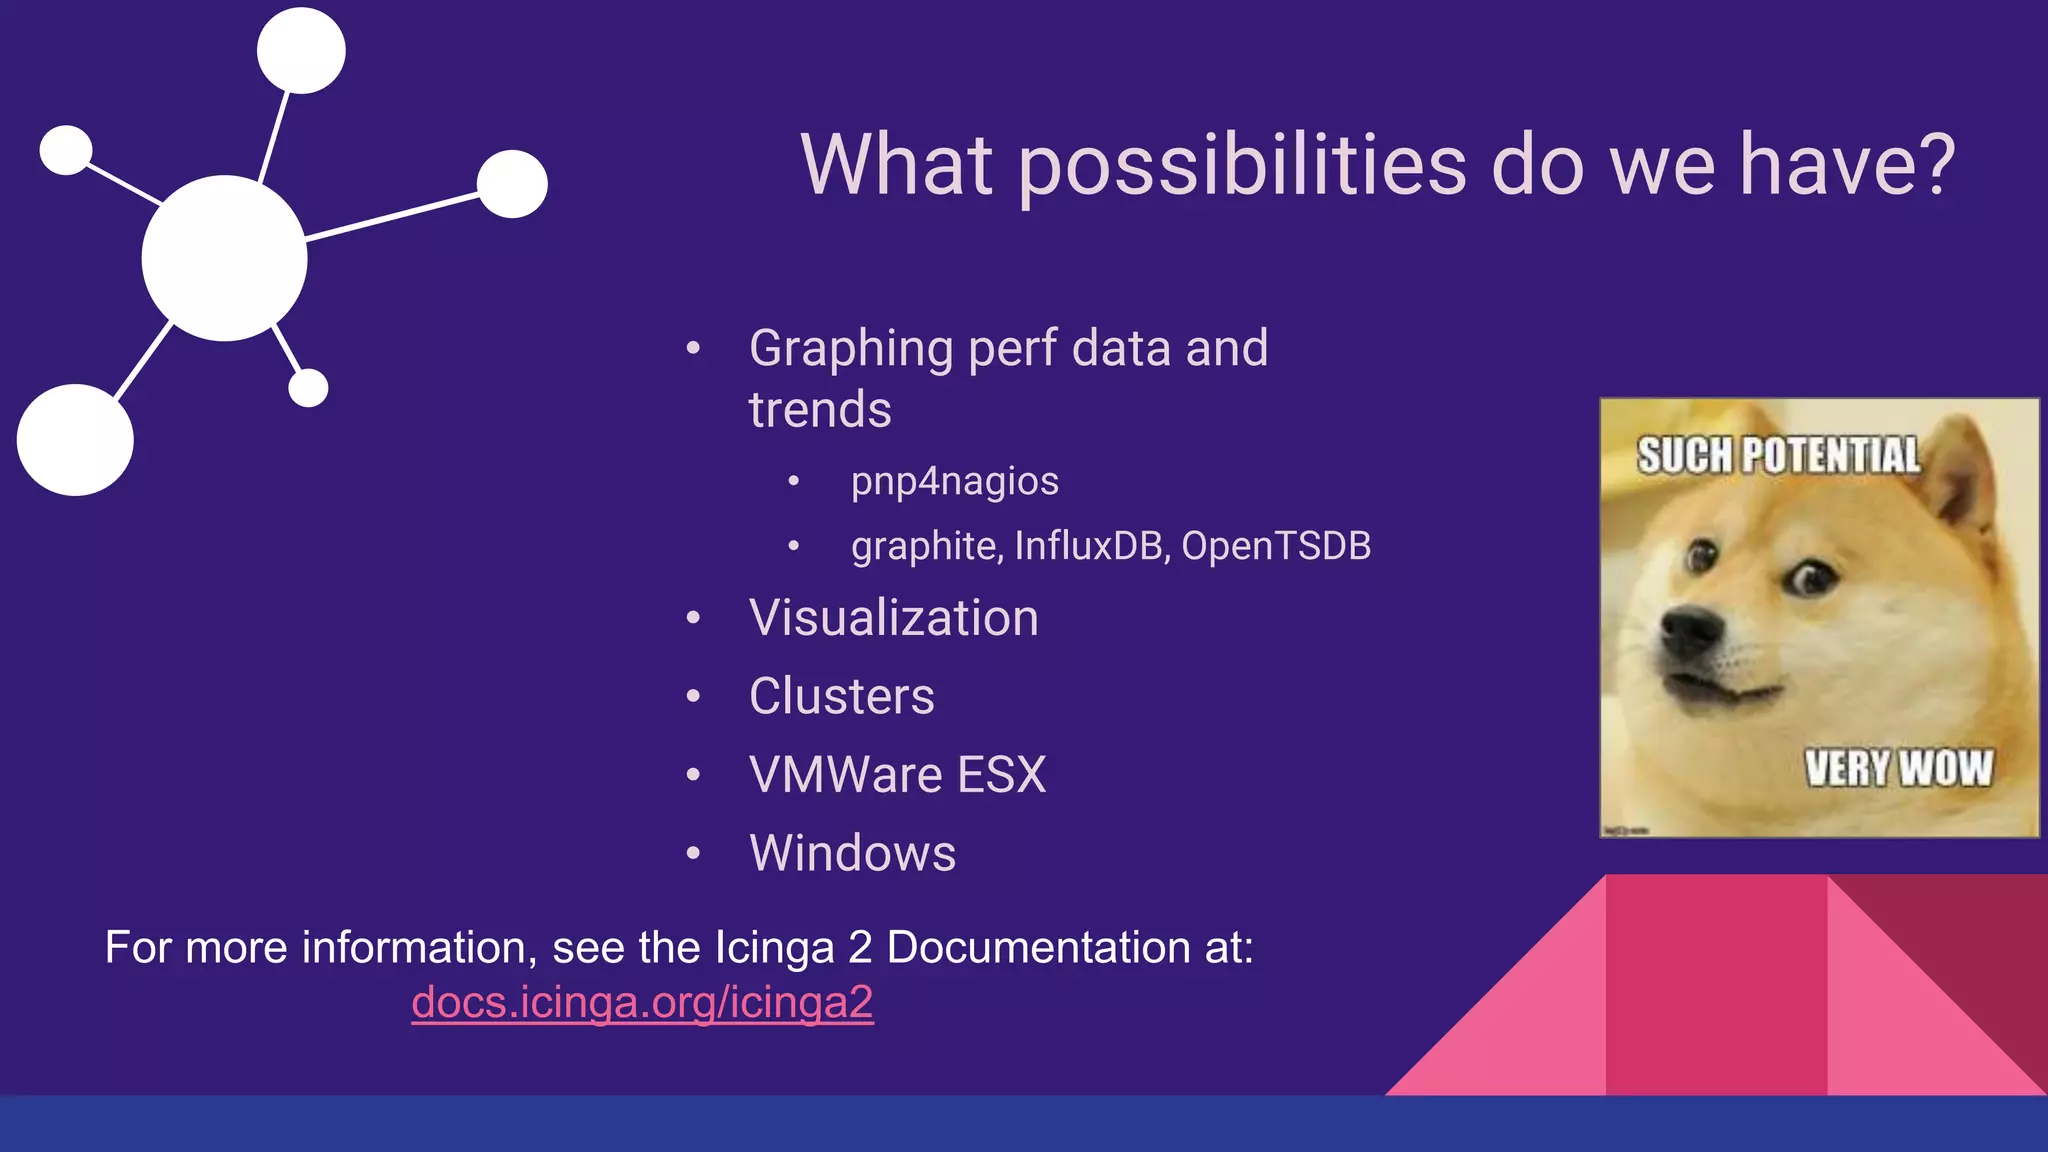
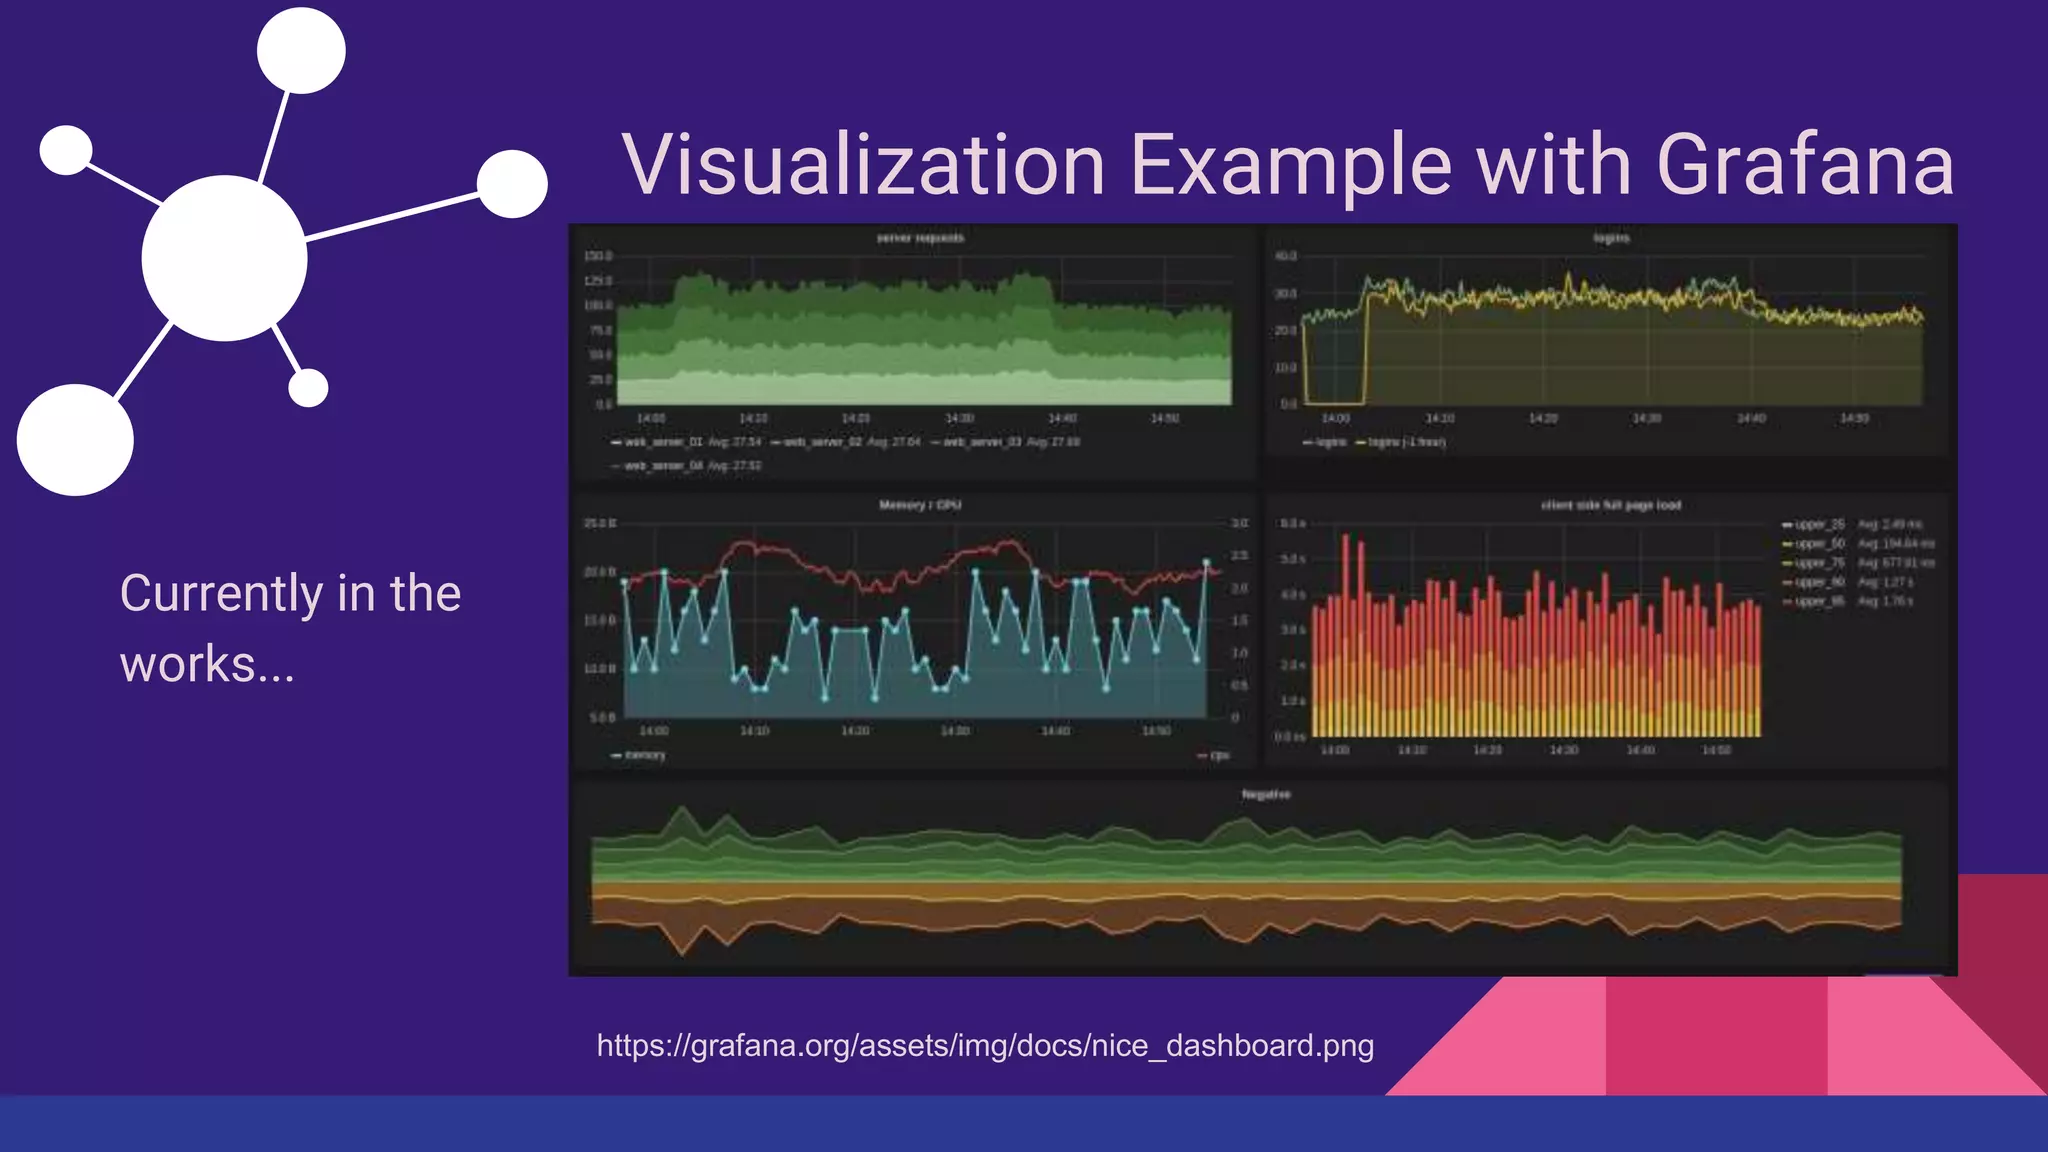
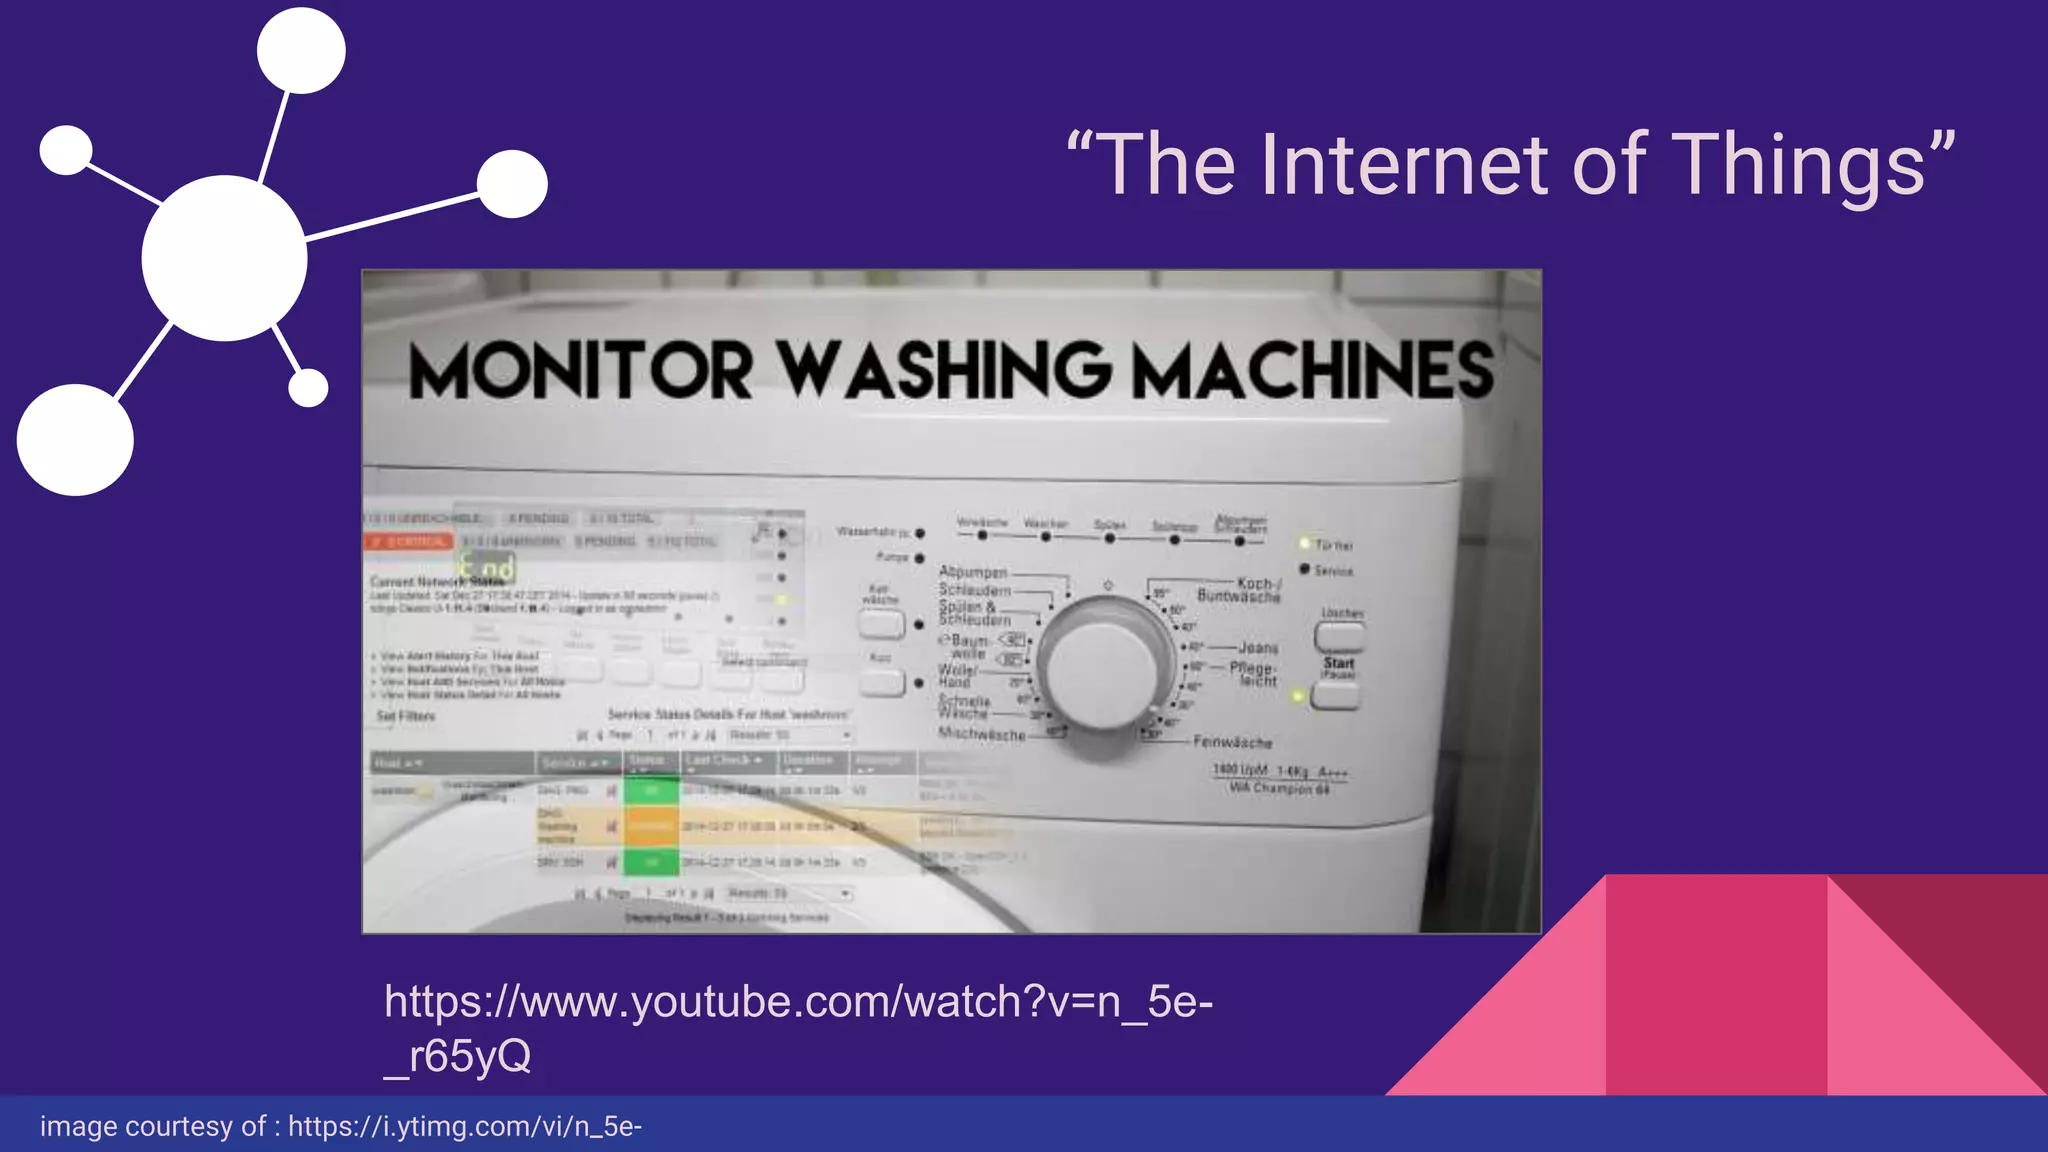
Let’s Monitor All The Things
A Presentation by: Nicole Neumann
Systems Administrator - University Housing Technology (ResNET)
University of Wisconsin - Whitewater
Key Topics and Points
• What is Icinga 2 and why should we use it?
• My relationship with Icinga 2
• How Icinga 2 works
• Icinga 2 appearance
• Live Demonstration
• So much potential
What is Icinga 2?
https://pbs.twimg.com/media/BxRv8CvCQAACJGy.jpg:large
What is Icinga 2?
• Monitoring solutions and what they do
• Individual systems
• Network infrastructure
• Applications and processes
• anything that can return a value via command line
• Open source
• Nagios and the Icinga fork
• Extensible and scalable
My relationship with Icinga 2
• Replacement for outdated web application
• Proof of Concept through Icinga 2 beta
• Configuration and development
• Enjoyed quiet evenings together
Fantastic! ...how does it work?
How does Icinga 2 work?
• Command line interface (CLI) configuration
• Hosts, Templates, Groups, Services, & Commands
• plugins and check commands
• Monitoring Plugins Library
• snmp, http, nrpe, and more
• hostalive checks through pinging
• options, so many plugins
• write your own plugin
• bash, python, php, perl, etc.
• adapt a plugin
What does it look like?
Configuration Samples
# lab printers. put em here.
object Host "Benson Lab Printer" {
import "printer"
address = /*insert DNS/IP address*/
vars.type = “Lab Printer”
}
template Host "generic-host" {
max_check_attempts = 3
check_interval = 1m
retry_interval = 30s
check_command = "hostalive"
}
Host Template
★ “generic-host” template is one of the default Icinga2 templates
Dashboard
Host and Service Details
Charts and Graphs
Let’s Log In
Let’s Log In
The possibilities…
What possibilities do we have?
• Graphing perf data and
trends
• pnp4nagios
• graphite, InfluxDB, OpenTSDB
• Visualization
• Clusters
• VMWare ESX
• Windows
For more information, see the Icinga 2 Documentation at:
docs.icinga.org/icinga2
Visualization Example with Grafana
Currently in the
works...
https://grafana.org/assets/img/docs/nice_dashboard.png
“The Internet of Things”
image courtesy of : https://i.ytimg.com/vi/n_5e-
https://www.youtube.com/watch?v=n_5e-
_r65yQ
Wrap-up
● What is Icinga 2 and why should we
use it?
● My relationship with Icinga 2
● How Icinga 2 works
● Icinga 2 appearance
● Live Demonstration
● So much potential
Thank You.
https://s-media-cache-ak0.pinimg.com/736x/be/aa/ca/beaaca5a40821d347750b64bd9ed73a9.jpg
Valuable Resources:
The Icinga website:
www.icinga.org
Icinga 2 Docs:
http://docs.icinga.org/icinga2
Icinga Exchange:
https://exchange.icinga.org/

Nicole Neumann - Let’s Monitor All The Things

  • 1.
    Let’s Monitor AllThe Things A Presentation by: Nicole Neumann Systems Administrator - University Housing Technology (ResNET) University of Wisconsin - Whitewater
  • 2.
    Key Topics andPoints • What is Icinga 2 and why should we use it? • My relationship with Icinga 2 • How Icinga 2 works • Icinga 2 appearance • Live Demonstration • So much potential
  • 3.
    What is Icinga2? https://pbs.twimg.com/media/BxRv8CvCQAACJGy.jpg:large
  • 4.
    What is Icinga2? • Monitoring solutions and what they do • Individual systems • Network infrastructure • Applications and processes • anything that can return a value via command line • Open source • Nagios and the Icinga fork • Extensible and scalable
  • 5.
    My relationship withIcinga 2 • Replacement for outdated web application • Proof of Concept through Icinga 2 beta • Configuration and development • Enjoyed quiet evenings together
  • 6.
  • 7.
    How does Icinga2 work? • Command line interface (CLI) configuration • Hosts, Templates, Groups, Services, & Commands • plugins and check commands • Monitoring Plugins Library • snmp, http, nrpe, and more • hostalive checks through pinging • options, so many plugins • write your own plugin • bash, python, php, perl, etc. • adapt a plugin
  • 8.
    What does itlook like?
  • 9.
    Configuration Samples # labprinters. put em here. object Host "Benson Lab Printer" { import "printer" address = /*insert DNS/IP address*/ vars.type = “Lab Printer” } template Host "generic-host" { max_check_attempts = 3 check_interval = 1m retry_interval = 30s check_command = "hostalive" } Host Template ★ “generic-host” template is one of the default Icinga2 templates
  • 10.
  • 11.
  • 12.
  • 13.
  • 14.
  • 15.
  • 16.
    What possibilities dowe have? • Graphing perf data and trends • pnp4nagios • graphite, InfluxDB, OpenTSDB • Visualization • Clusters • VMWare ESX • Windows For more information, see the Icinga 2 Documentation at: docs.icinga.org/icinga2
  • 17.
    Visualization Example withGrafana Currently in the works... https://grafana.org/assets/img/docs/nice_dashboard.png
  • 18.
    “The Internet ofThings” image courtesy of : https://i.ytimg.com/vi/n_5e- https://www.youtube.com/watch?v=n_5e- _r65yQ
  • 19.
    Wrap-up ● What isIcinga 2 and why should we use it? ● My relationship with Icinga 2 ● How Icinga 2 works ● Icinga 2 appearance ● Live Demonstration ● So much potential
  • 20.
    Thank You. https://s-media-cache-ak0.pinimg.com/736x/be/aa/ca/beaaca5a40821d347750b64bd9ed73a9.jpg Valuable Resources: TheIcinga website: www.icinga.org Icinga 2 Docs: http://docs.icinga.org/icinga2 Icinga Exchange: https://exchange.icinga.org/

Editor's Notes

  • #5 What does the name Icinga mean? How is it pronounced? Icinga is a Zulu word meaning ‘it looks for’, ‘it browses’, ‘it examines’. As far as we can tell, it is pronounced with one of the famous Zulu click consonants that require some practice. See: https://www.icinga.org/2010/11/03/a-lesson-in-zulu-icinga/ Icinga2, and its previous iteration, Icinga, are monitoring solutions. Monitoring solutions, to use broad terms, checks anything that can return a value via command line. wget a web page and look for a certain element like wget woot.com to check for a wootoff I'm looking into writing a plugin to control an hdhomerun box to check signal stats. wget a cable modem's status page and pull out the signal blob This means we can monitor individual systems, network infrastructure, as well as applications and processes. Icinga2 is open source. Icinga 2 and the Icinga 2 documentation are licensed under the terms of the GNU General Public License Version 2. Icinga is a fork of Nagios. Basically, Nagios (a very widely used open-source monitoring solution) had ceased development and improvement. Some of the developers for Nagios wanted to improve upon the code and software they devoted so much time to, and ended up being forced to fork into Icinga. That being said, Icinga can utilize Nagios plugins with very little effort. In fact, Icinga has many Nagios plugins pre-built into the configuration. Nagios, typically, could only handle a few thousand checks, ever 3-5 minutes, whereas Icinga 2 can do millions per minute “Thanks to its multithreaded design we’ve seen one instance run 1 million active checks a minute to monitor 60,000 hosts without a creak.” this means you can do multiple updates a minute, and catch transient events better, like a printer randomly jamming, then recovering 30 seconds later Icinga supports clustering (nearly impossible with Nagios; required much duct tape) Icinga is also scalable and extensible, meaning that it can monitor large, complex environments across multiple locations.
  • #6 This started as a mission to find a replacement for an older web application (Printer TV), which functioned great in its time, but didn't work or play as nicely with the newer printer models we were implementing. This led to us having to open a browser page for each printer to check statuses. As you could imagine, this was not only time-consuming, but frustrating. I had heard of Icinga through a couple friends who were then using Nagios on an enterprise level, but were having some problems with the extensibility and scalability of the solution, and were looking at ways to ensure what was being reported was accurate. After some research myself, I jumped head-first into the proof-of-concept. Looking back to a year ago, Icinga2 was first being released as a beta. The configuration language was not fully established, the documentation was incredibly lacking, and initial setup was a nightmare, but I was determined. Keep in mind, I had only begun using Linux as my main operating system for a year, and was still learning how to use it, while trying to implement Icinga on an old R61 ThinkPad running Ubuntu 14.04. So, needless to say, Icinga and I spent many a quiet evening together, sharing lots of energy drinks, snacks, and a fair bit of frustration, but also a lot of elation when something actually worked.
  • #14 This image links to the development instance of Icinga.
  • #15 This image links to the production instance of Icinga.
  • #17 Icinga also collects perf data (it just needs to be enabled), which can be used in conjunction with add-ons to graph data and see trends. Visualization through Icinga Reporting (the web interface), and NagVis to create customized network maps based on the monitoring configuration. using perf data to monitor consumable consumption over time, and how you could use grafana (with stacked graphs) to compare buildings Configuration for Clusters, VMWare ESX, and Windows are fairly new, but highly documented. I am hoping to work with these more in the near future. For more detailed information, go to: docs.icinga.org/icinga2/latest/
  • #18 When I said visualization of perf data, I didn't mean something boring...data is beautiful.
  • #19 Before you ask, yes, this is a German washing machine (obviously a higher-tech washing machine). The image overlay you are seeing is a section of the Icinga (Icinga 1) dashboard monitoring that washing machine. Christian Stankowic accomplished this using a Raspberry Pi + PIR sensor + Icinga. So, if a washing machine can be monitored, then we should think about all the potential things we could monitor.
  • #20 We talked about what Icinga is, and why it's awesome and should be used. My crazy relationship with this project. How Icinga 2 works. We saw what Icinga 2 looks like, both the current stable release, and the beta from a year ago, which you saw through a live view of our current setup. And just scratched the surface in thinking about all of the monitoring potential.