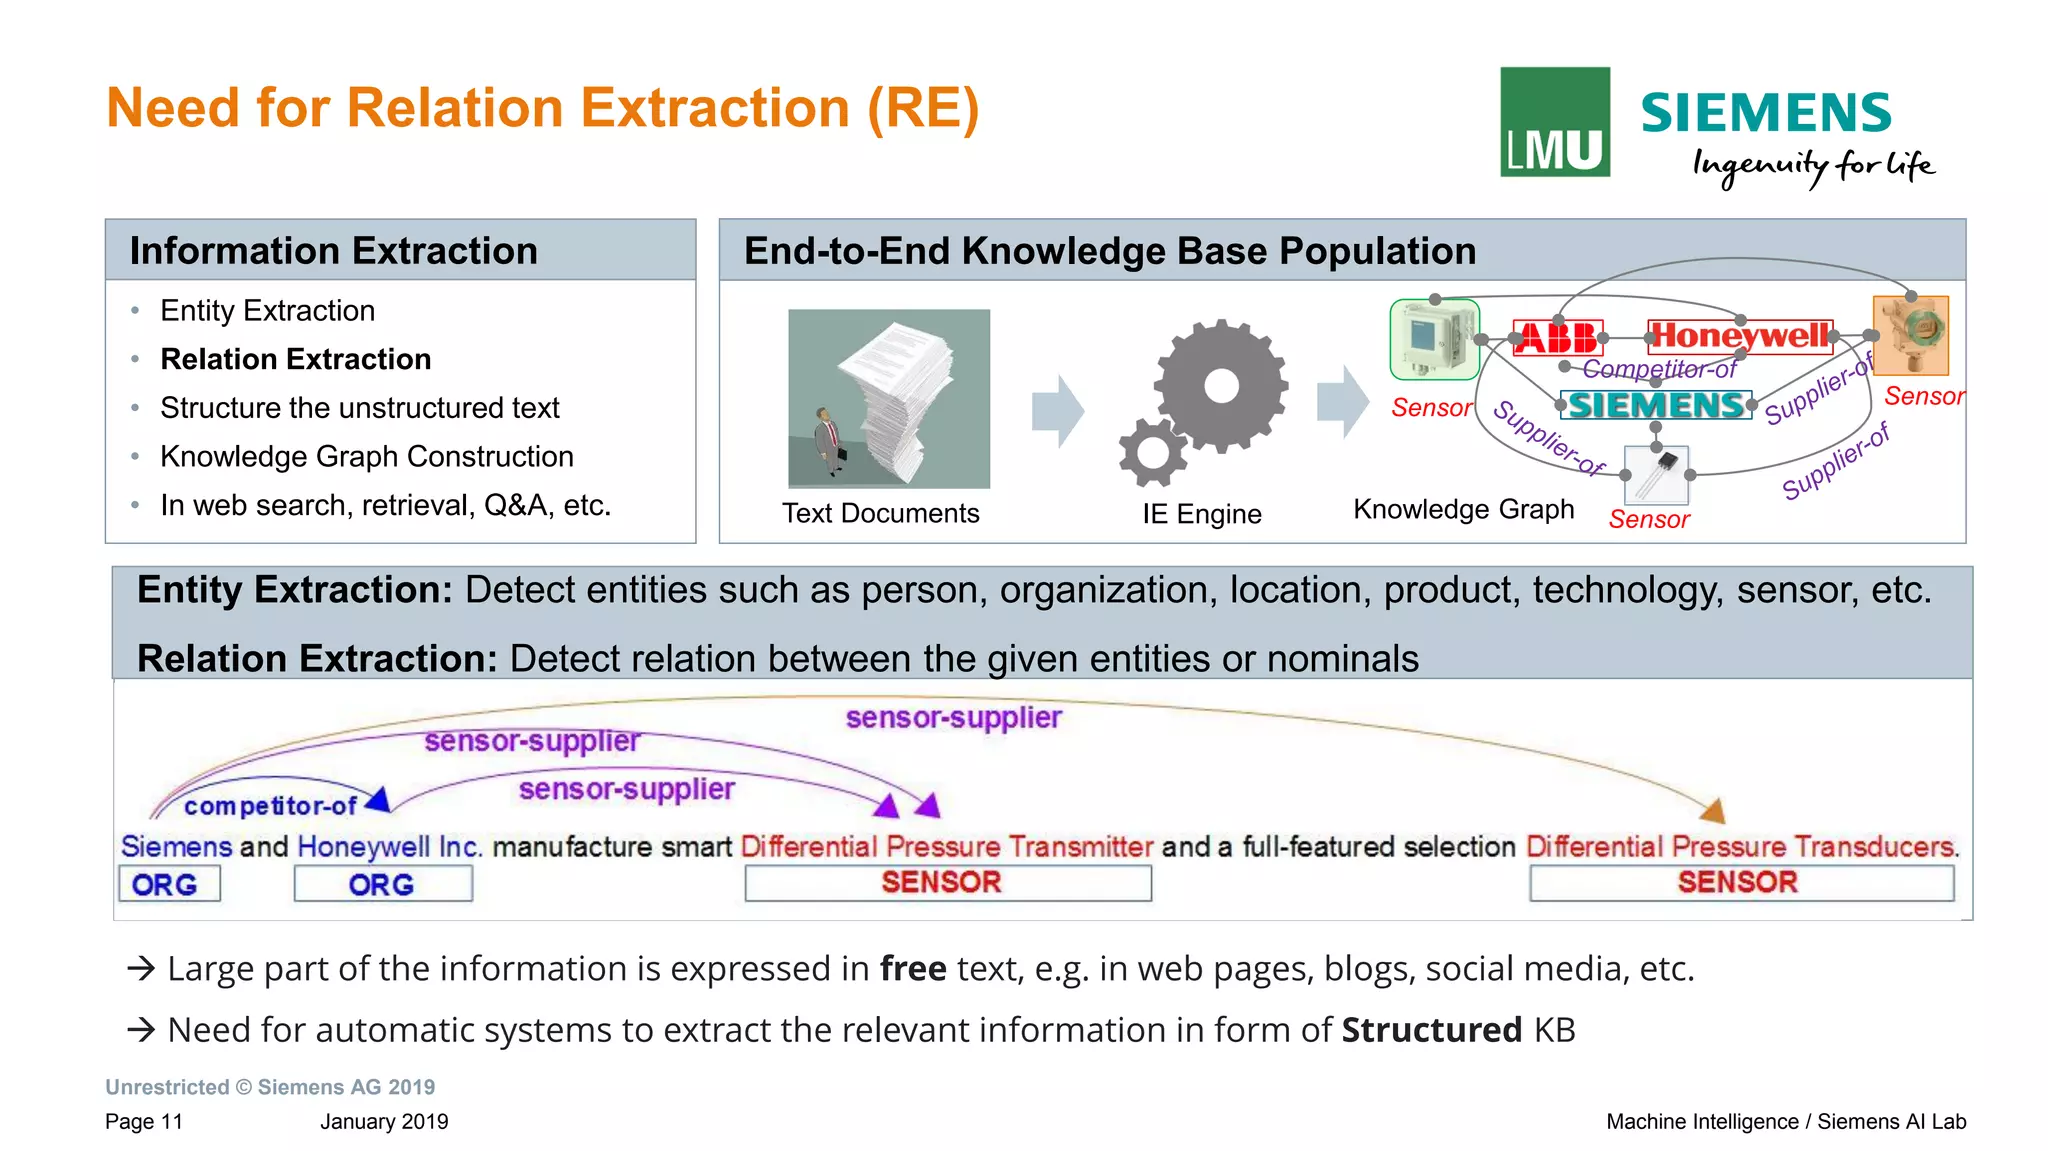
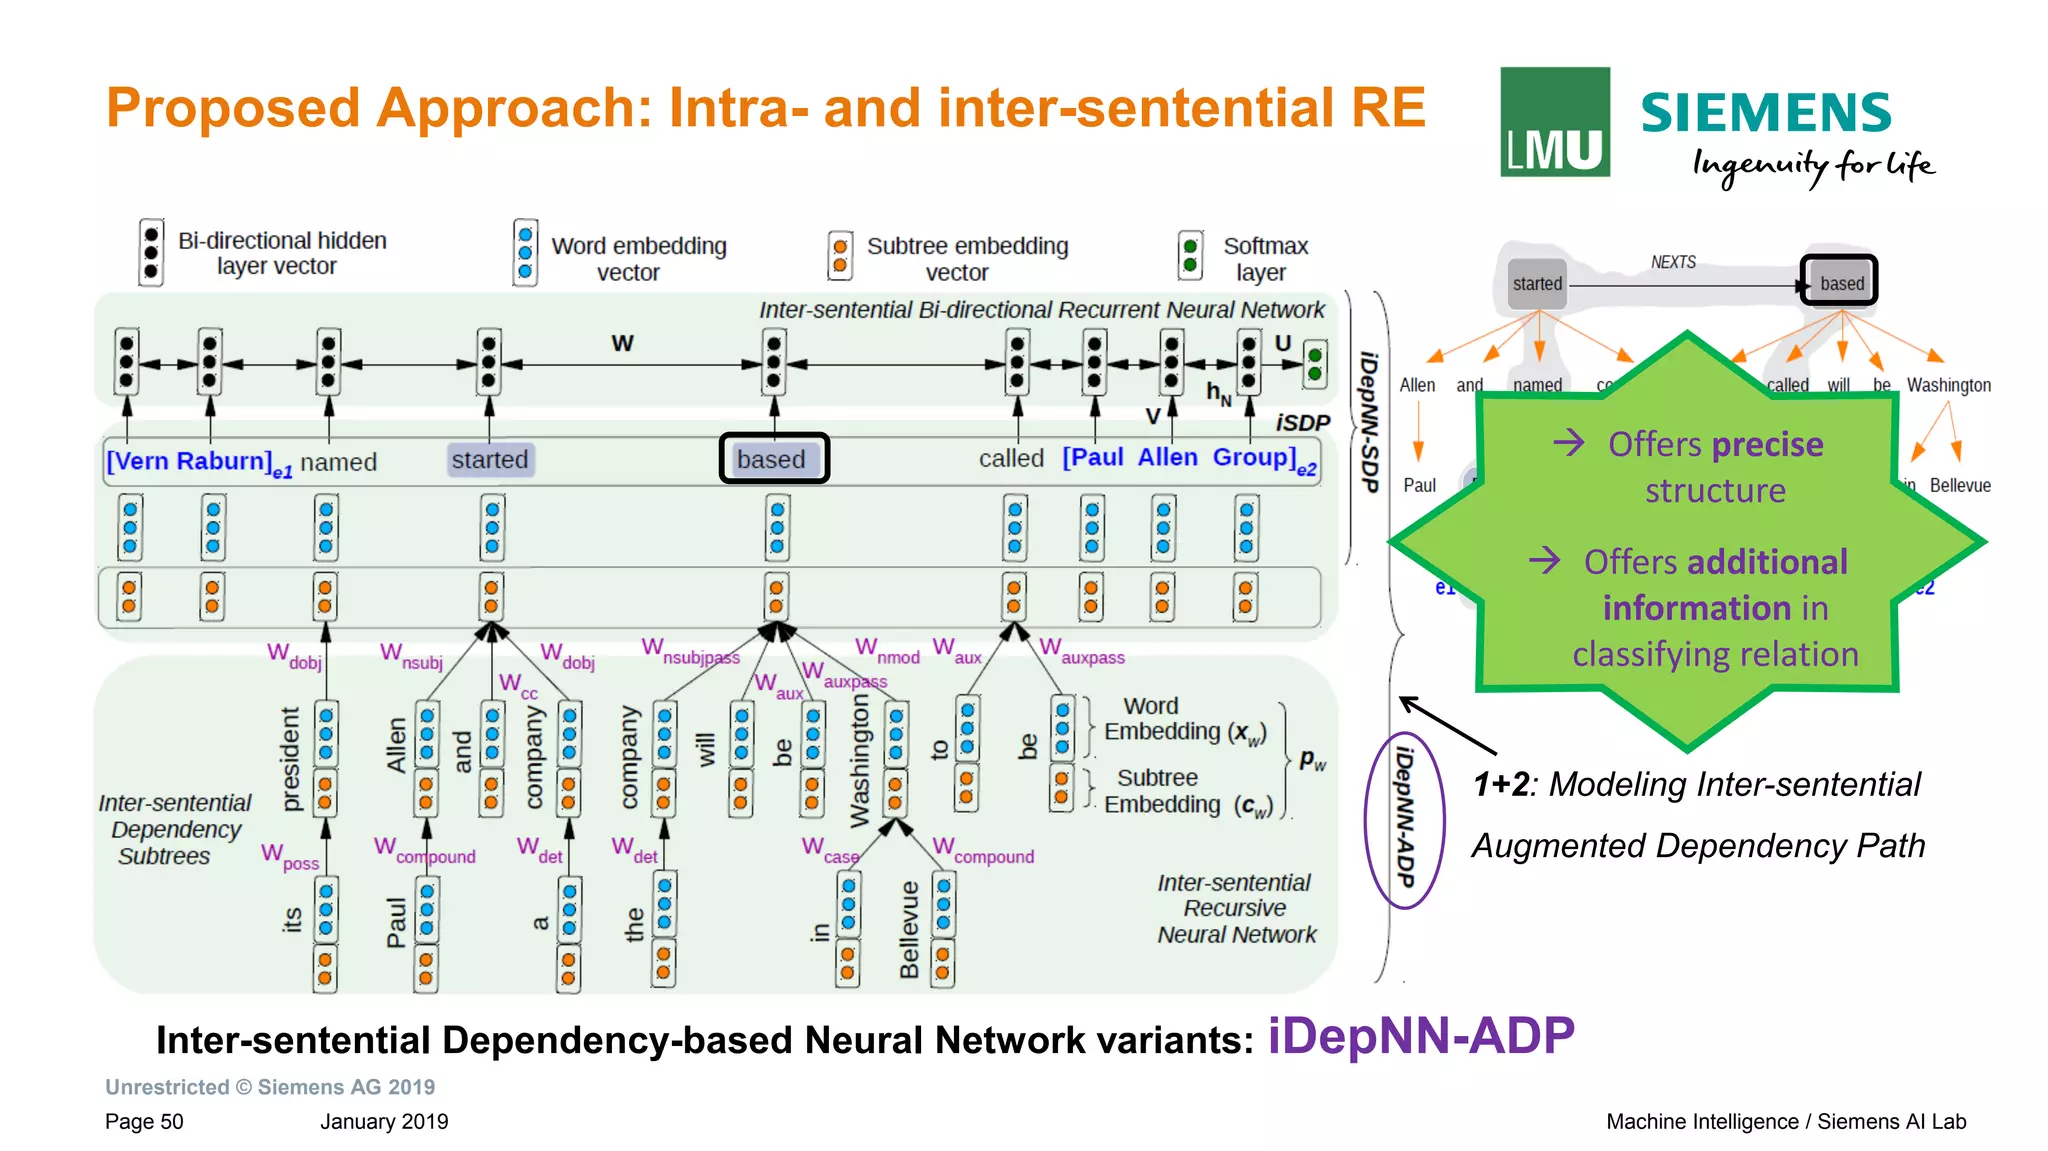
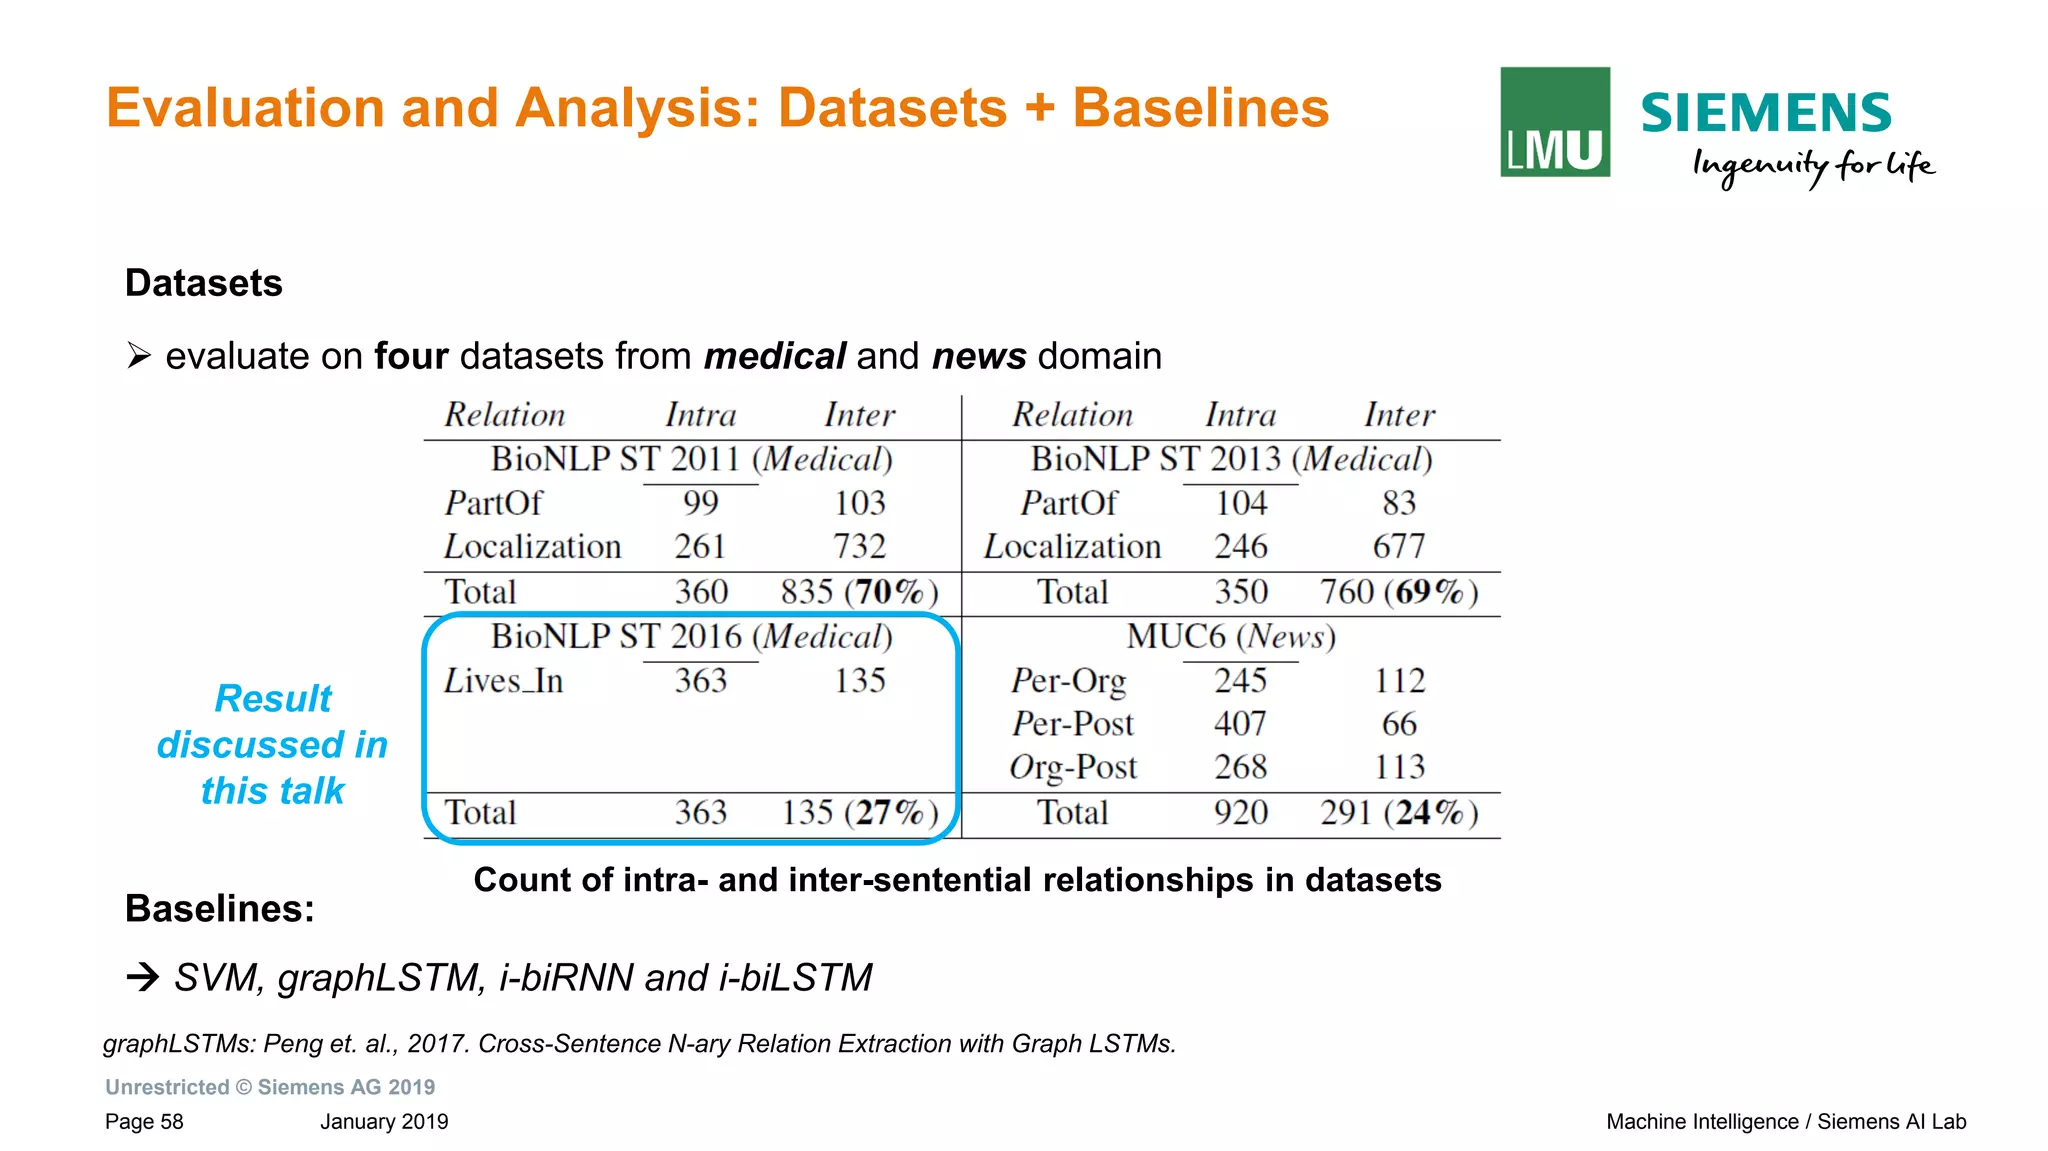
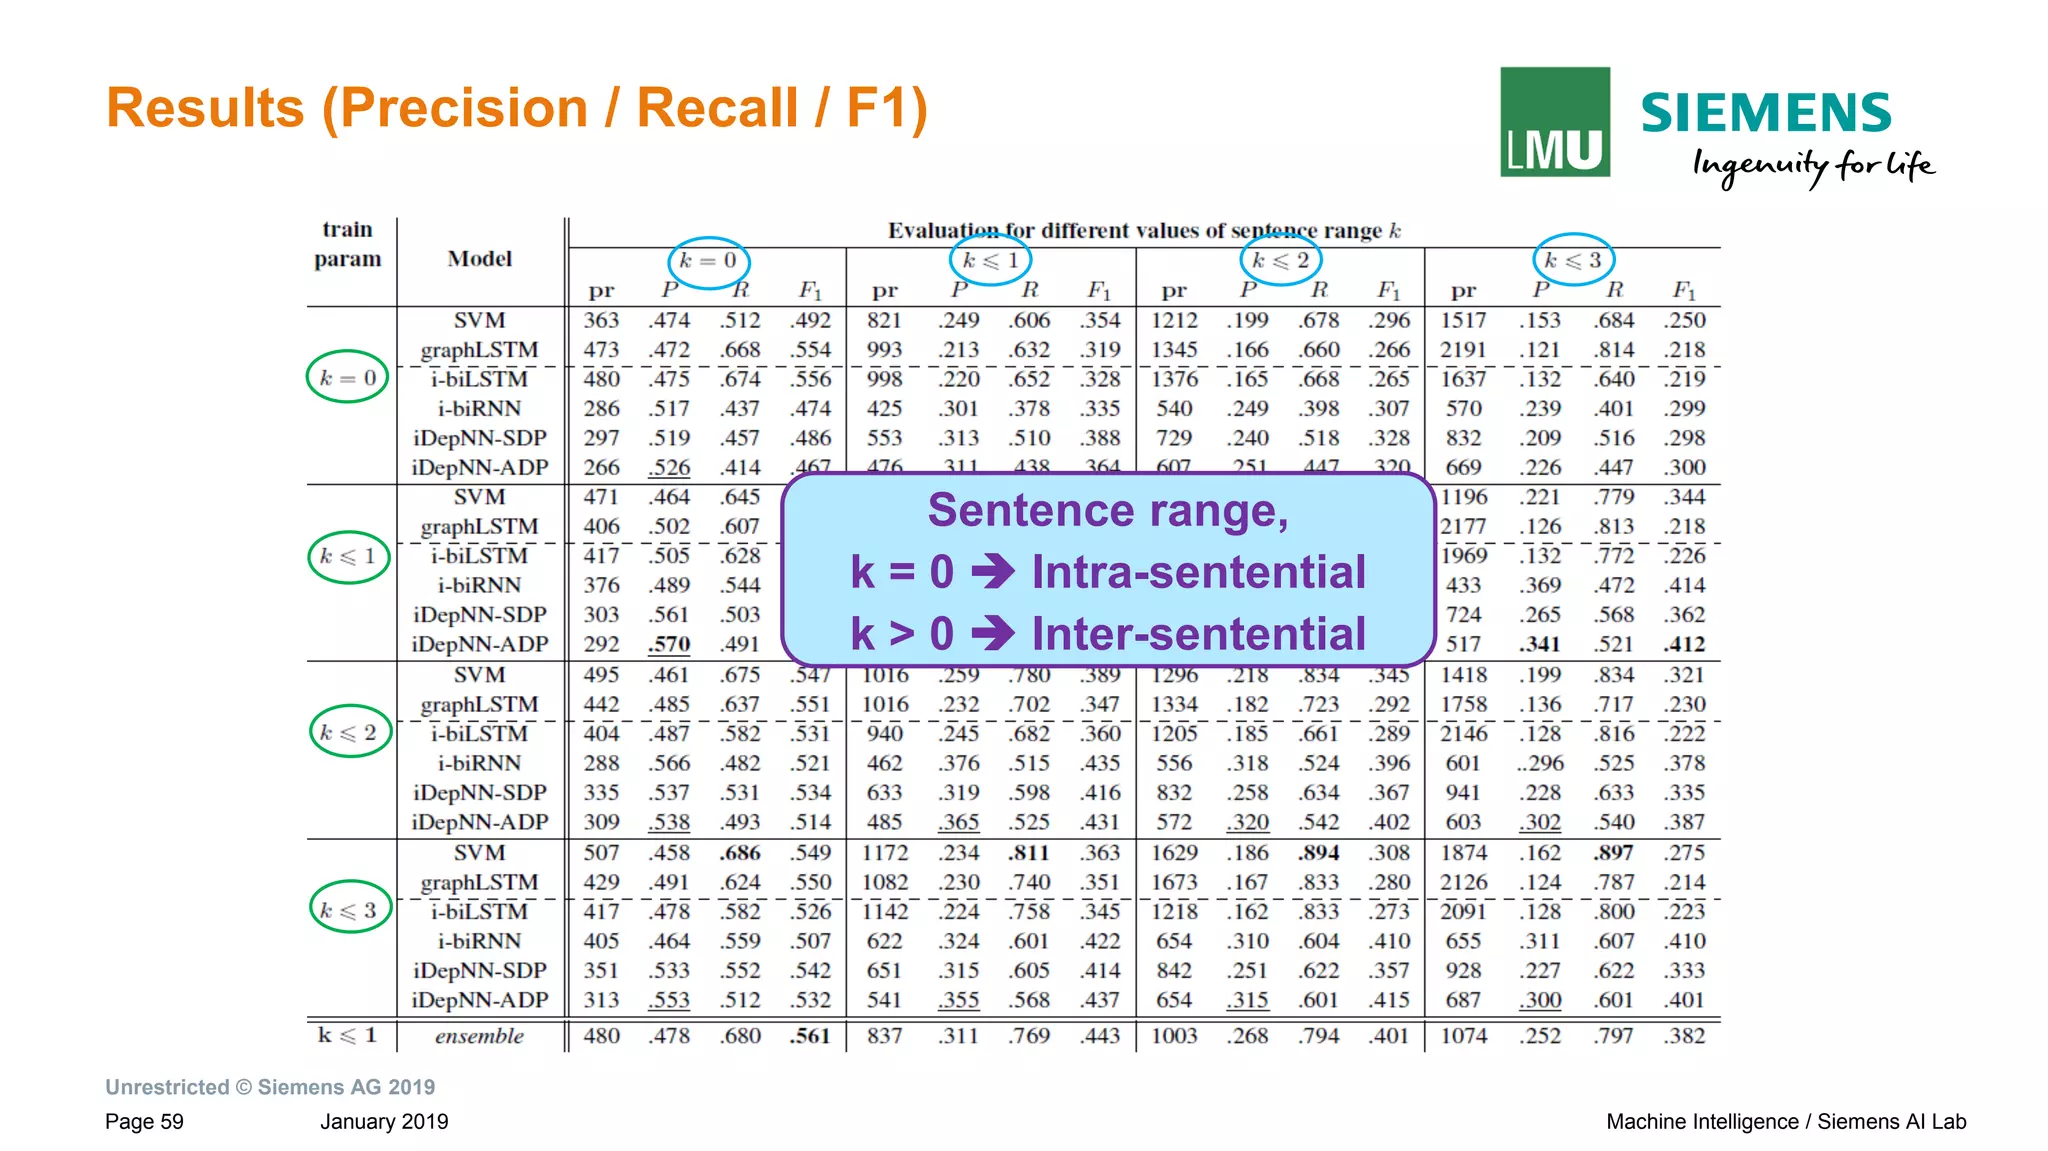
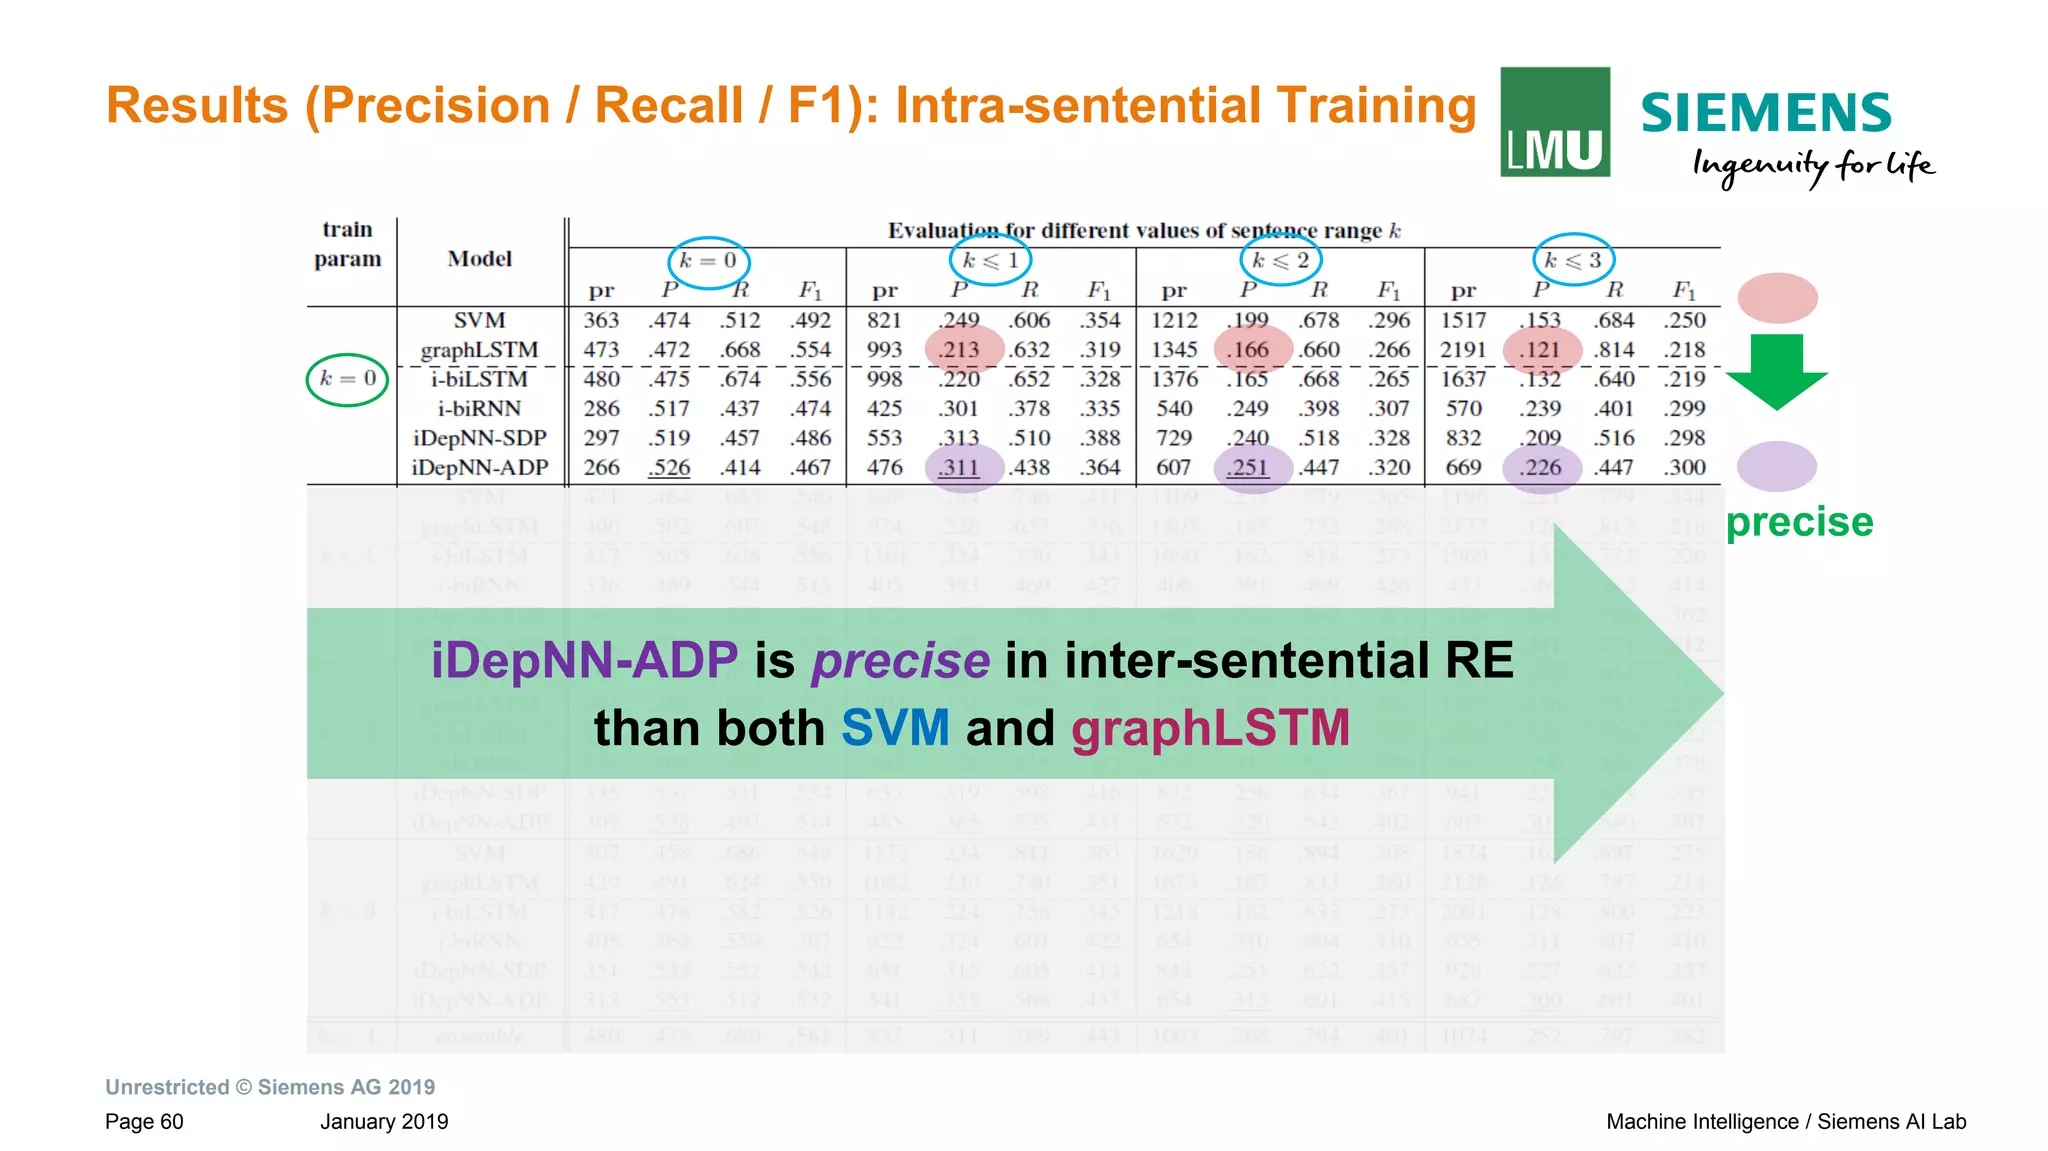
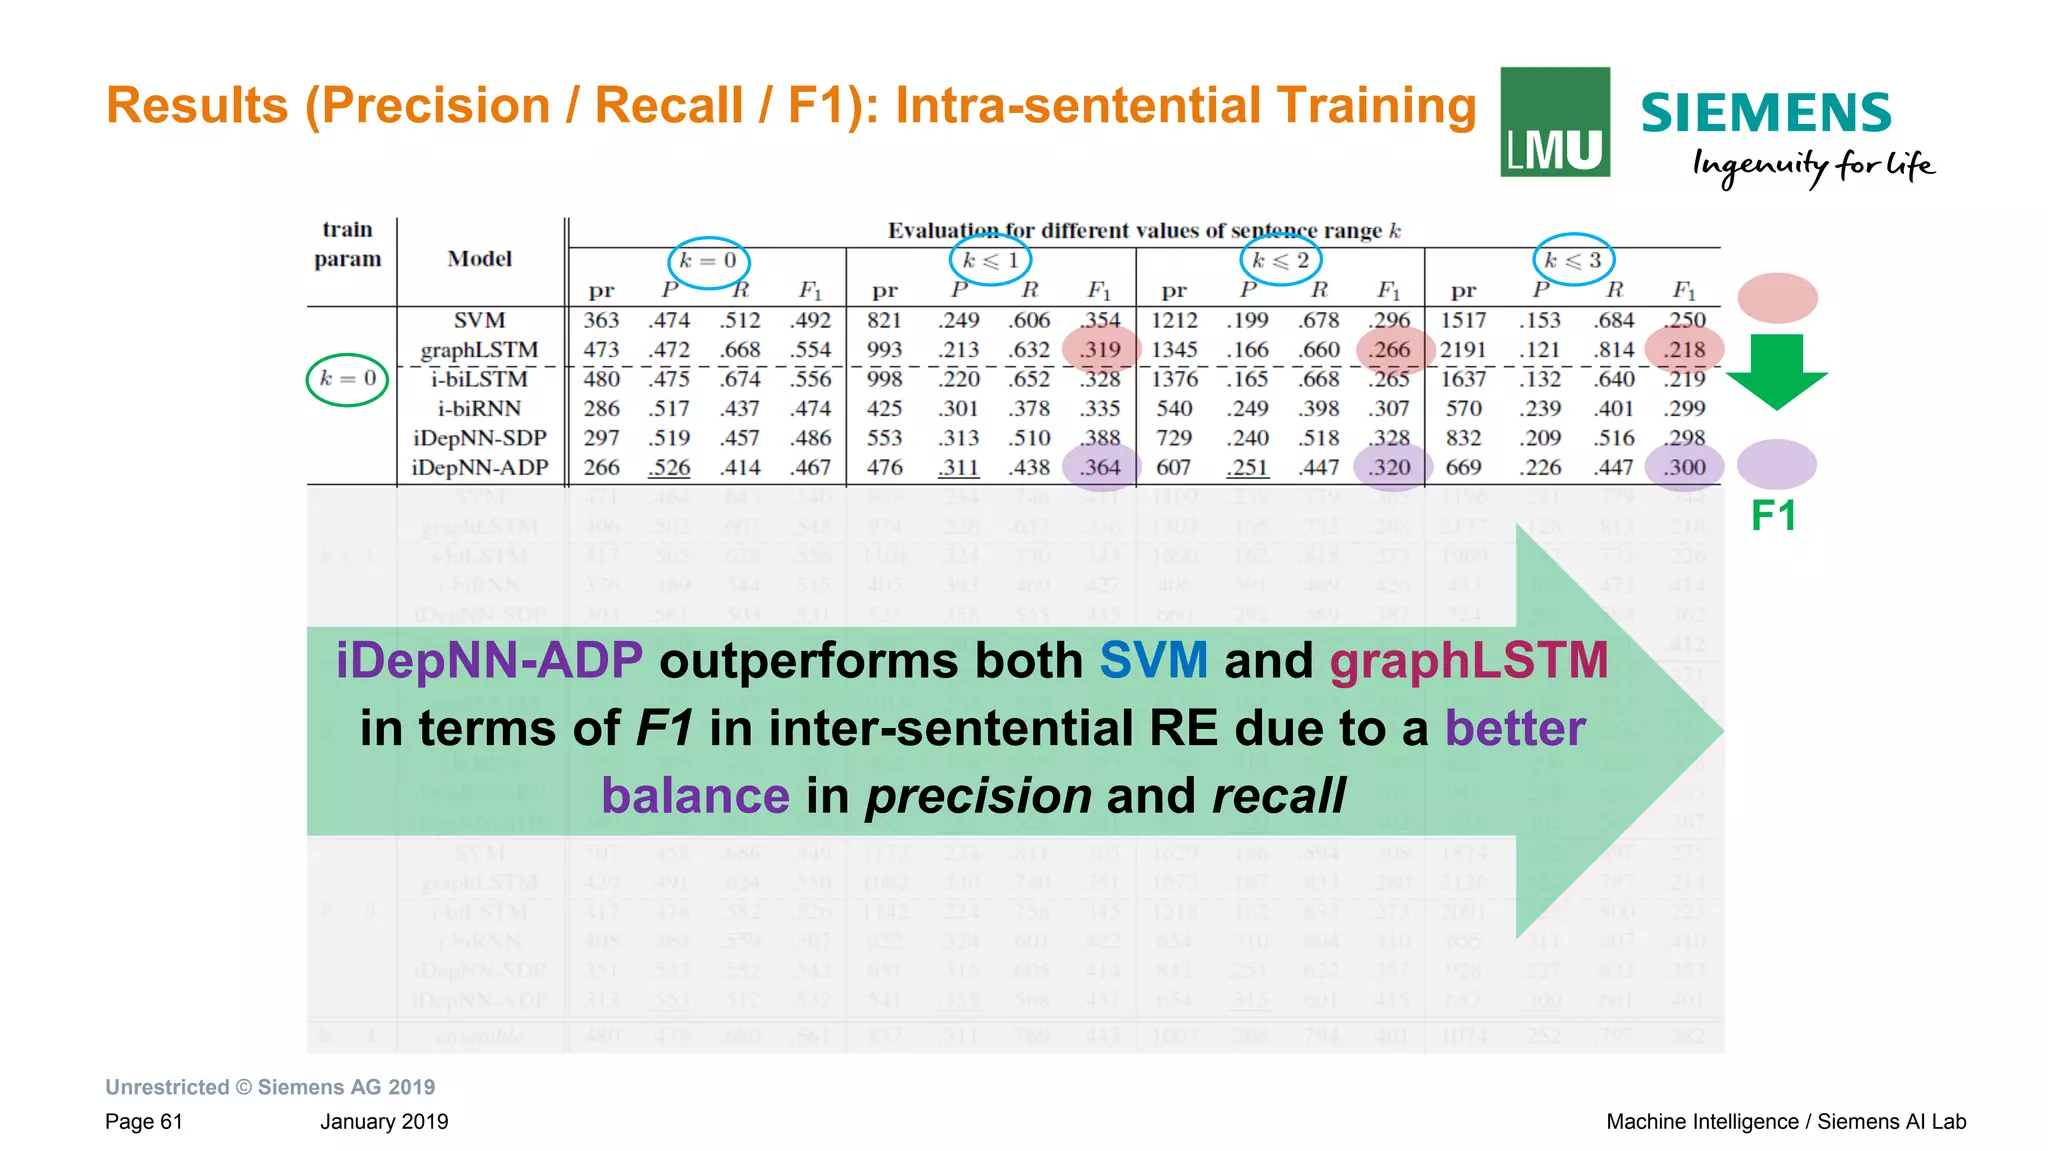
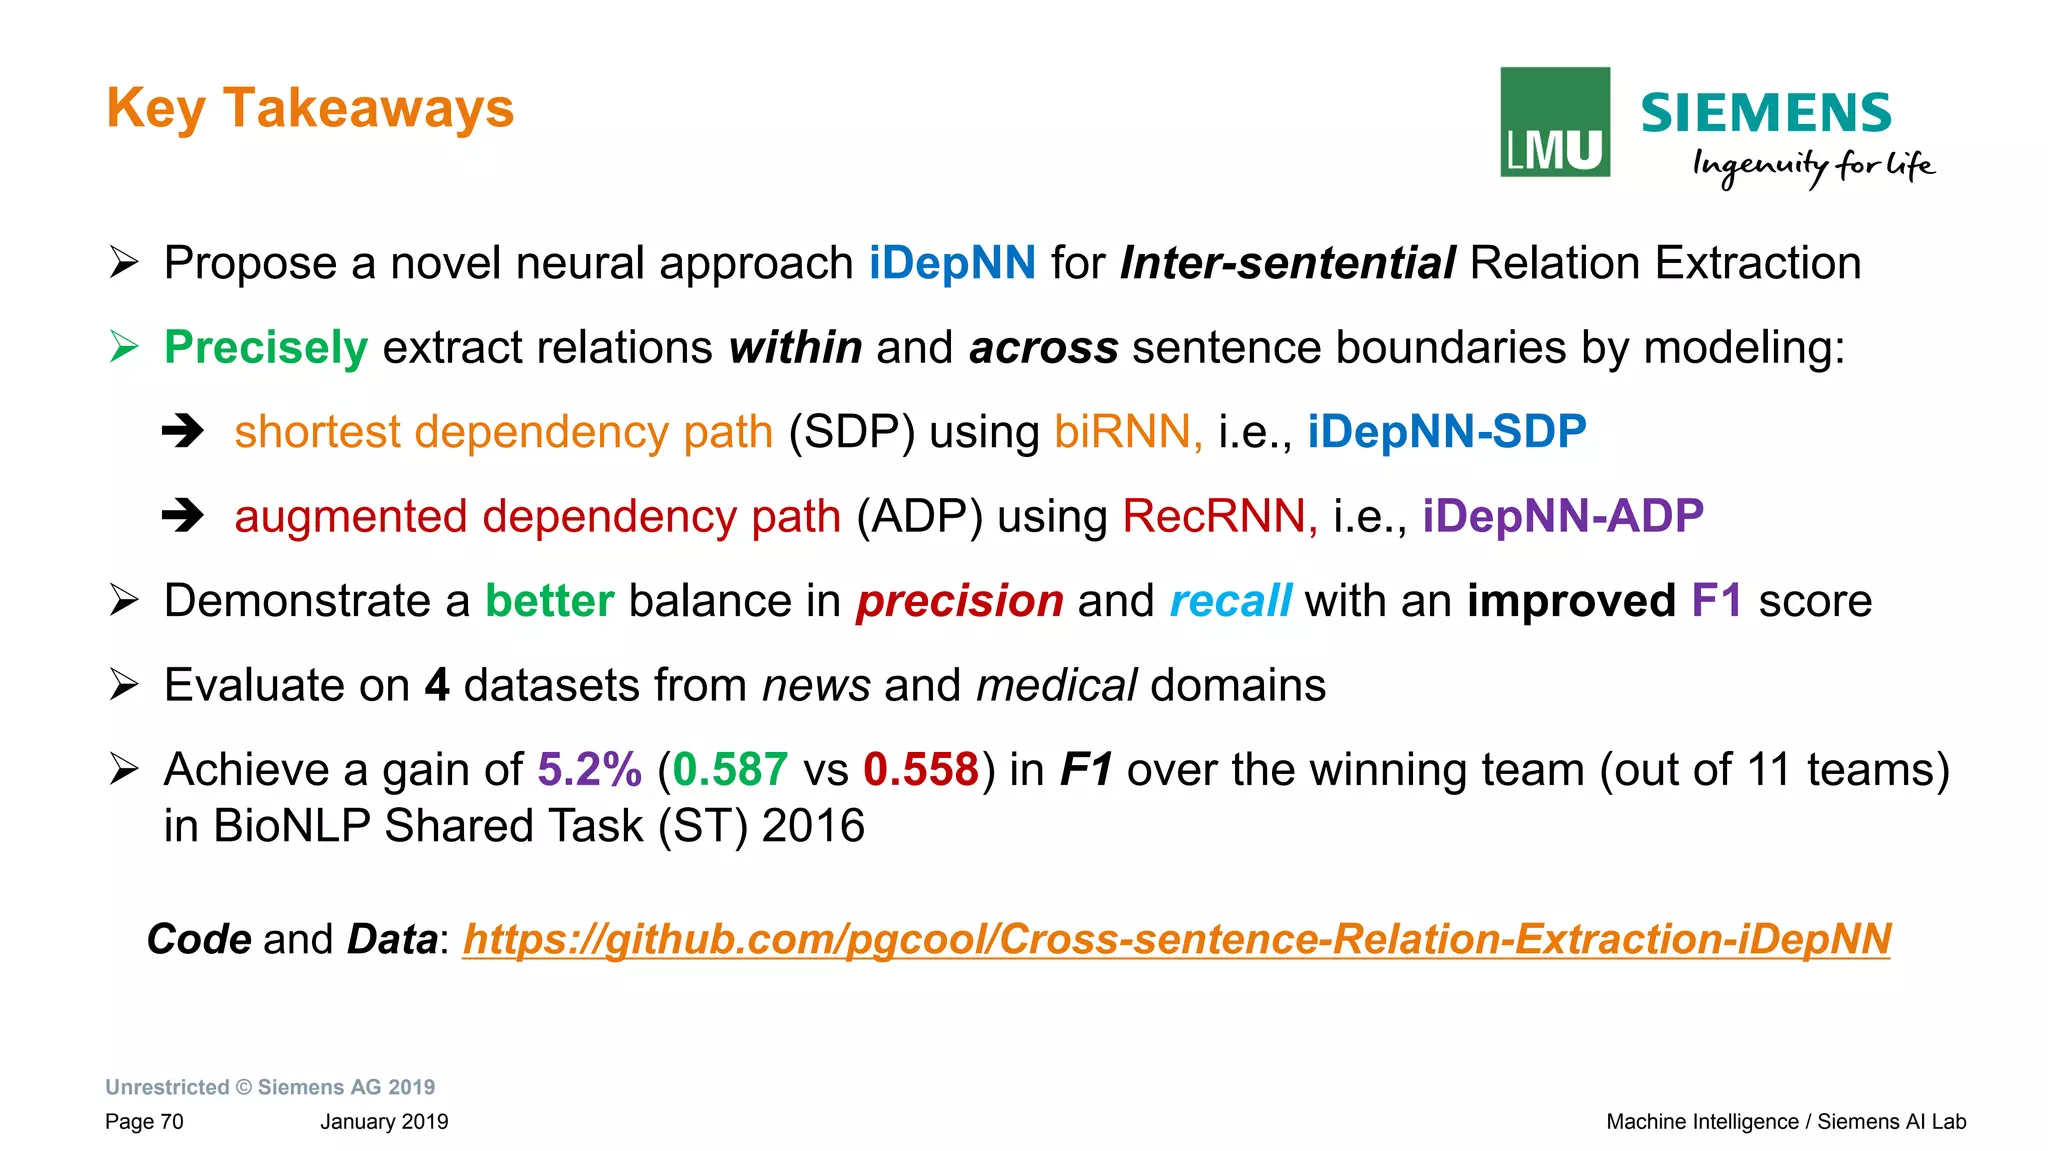
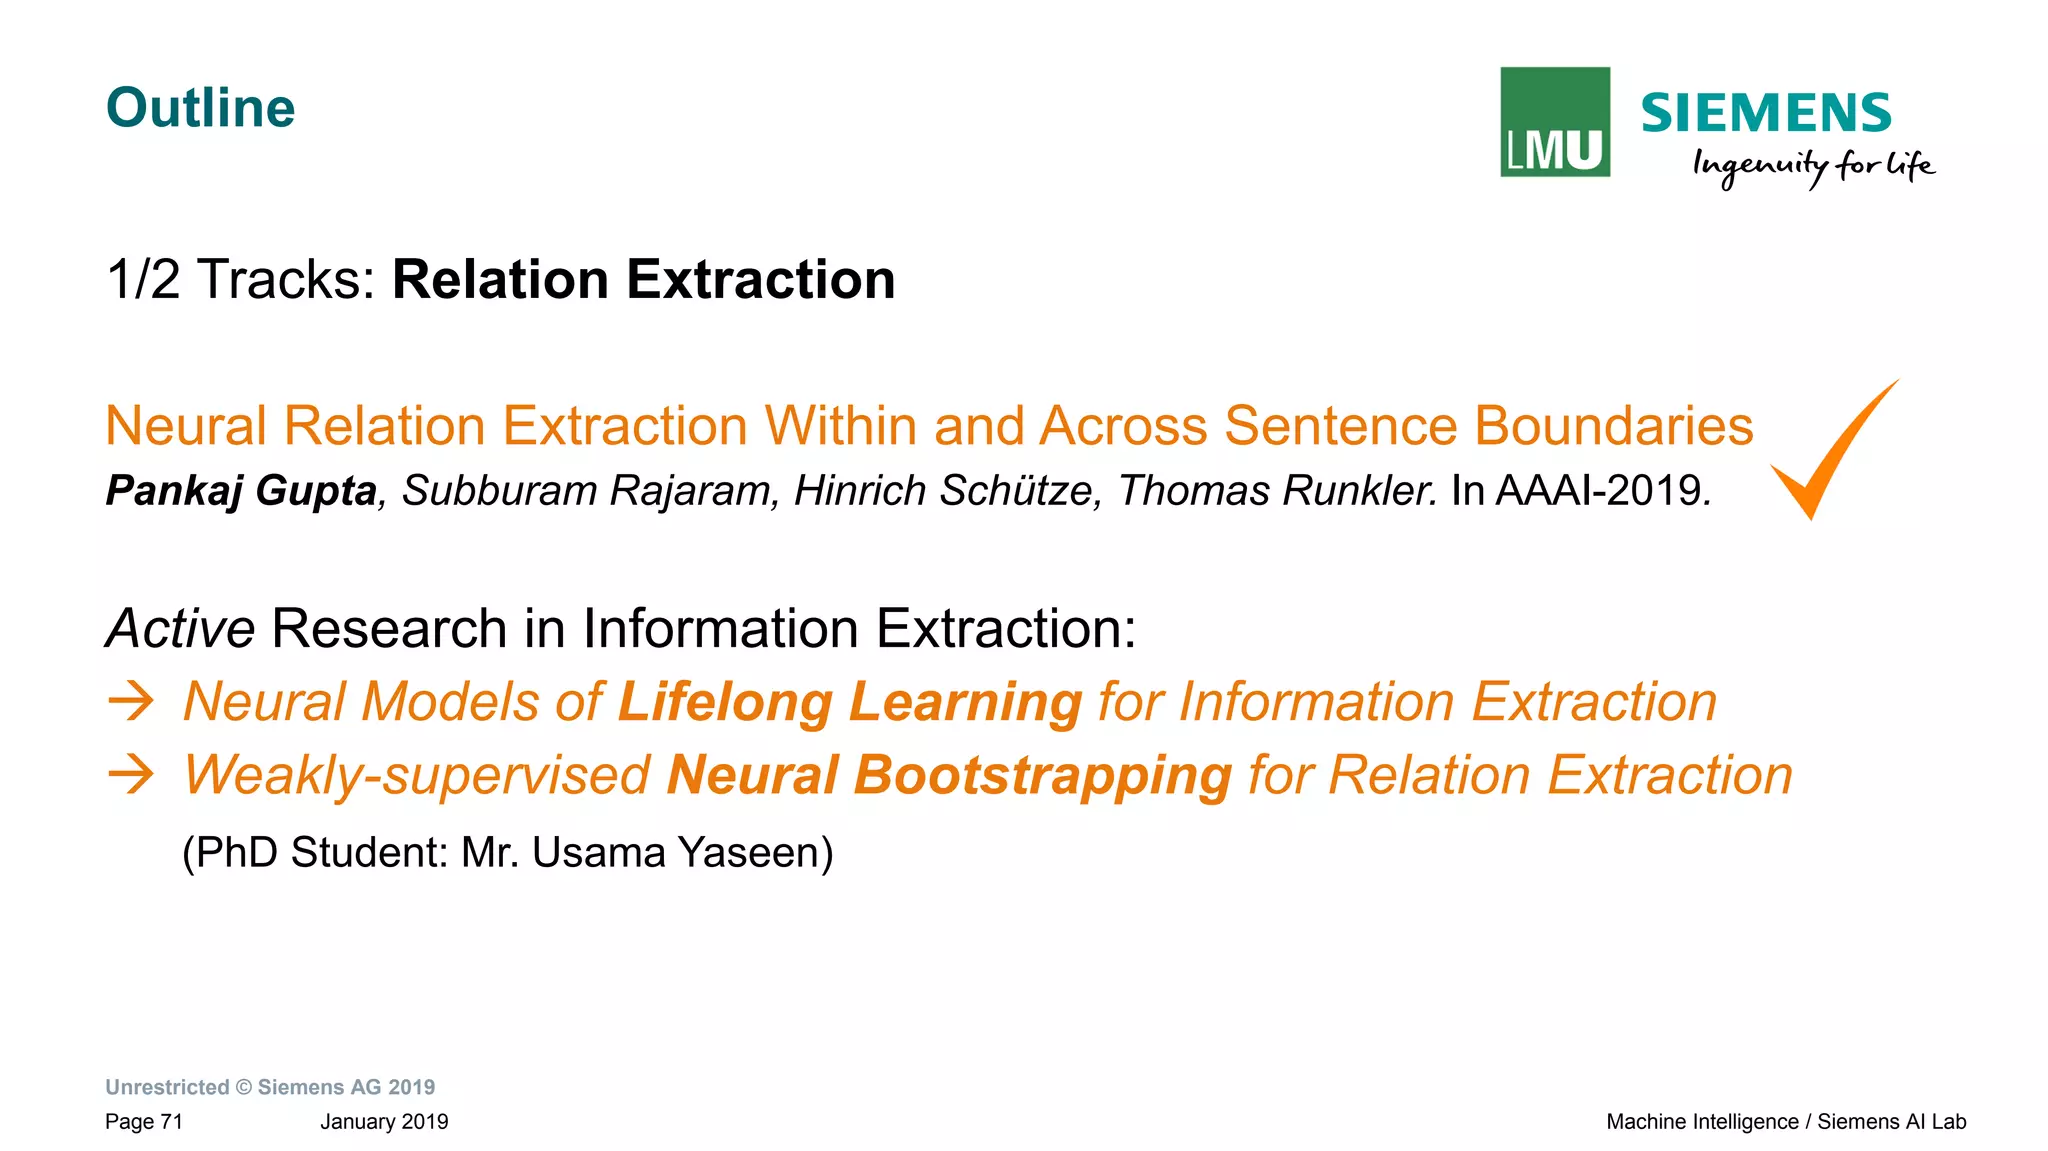
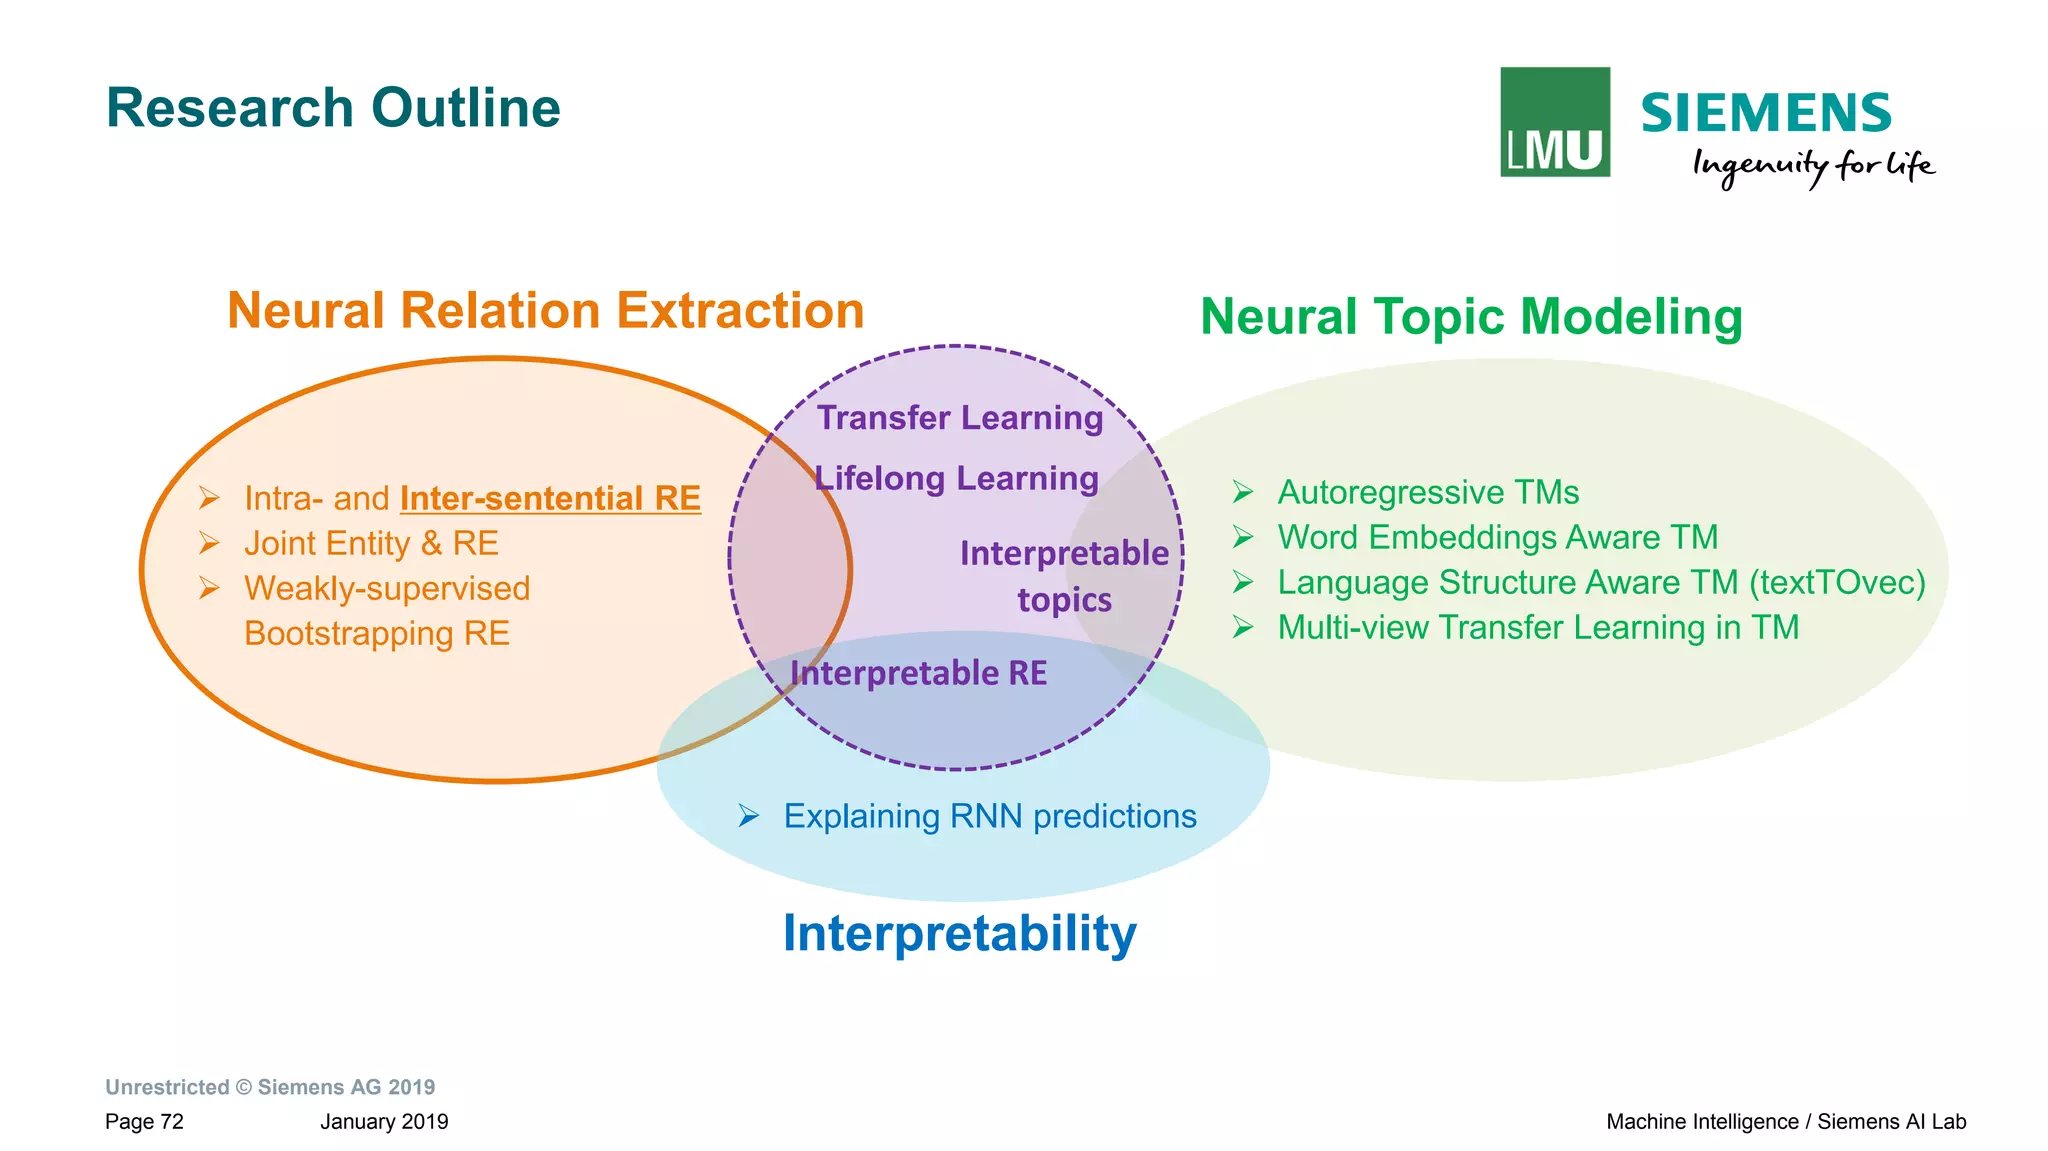
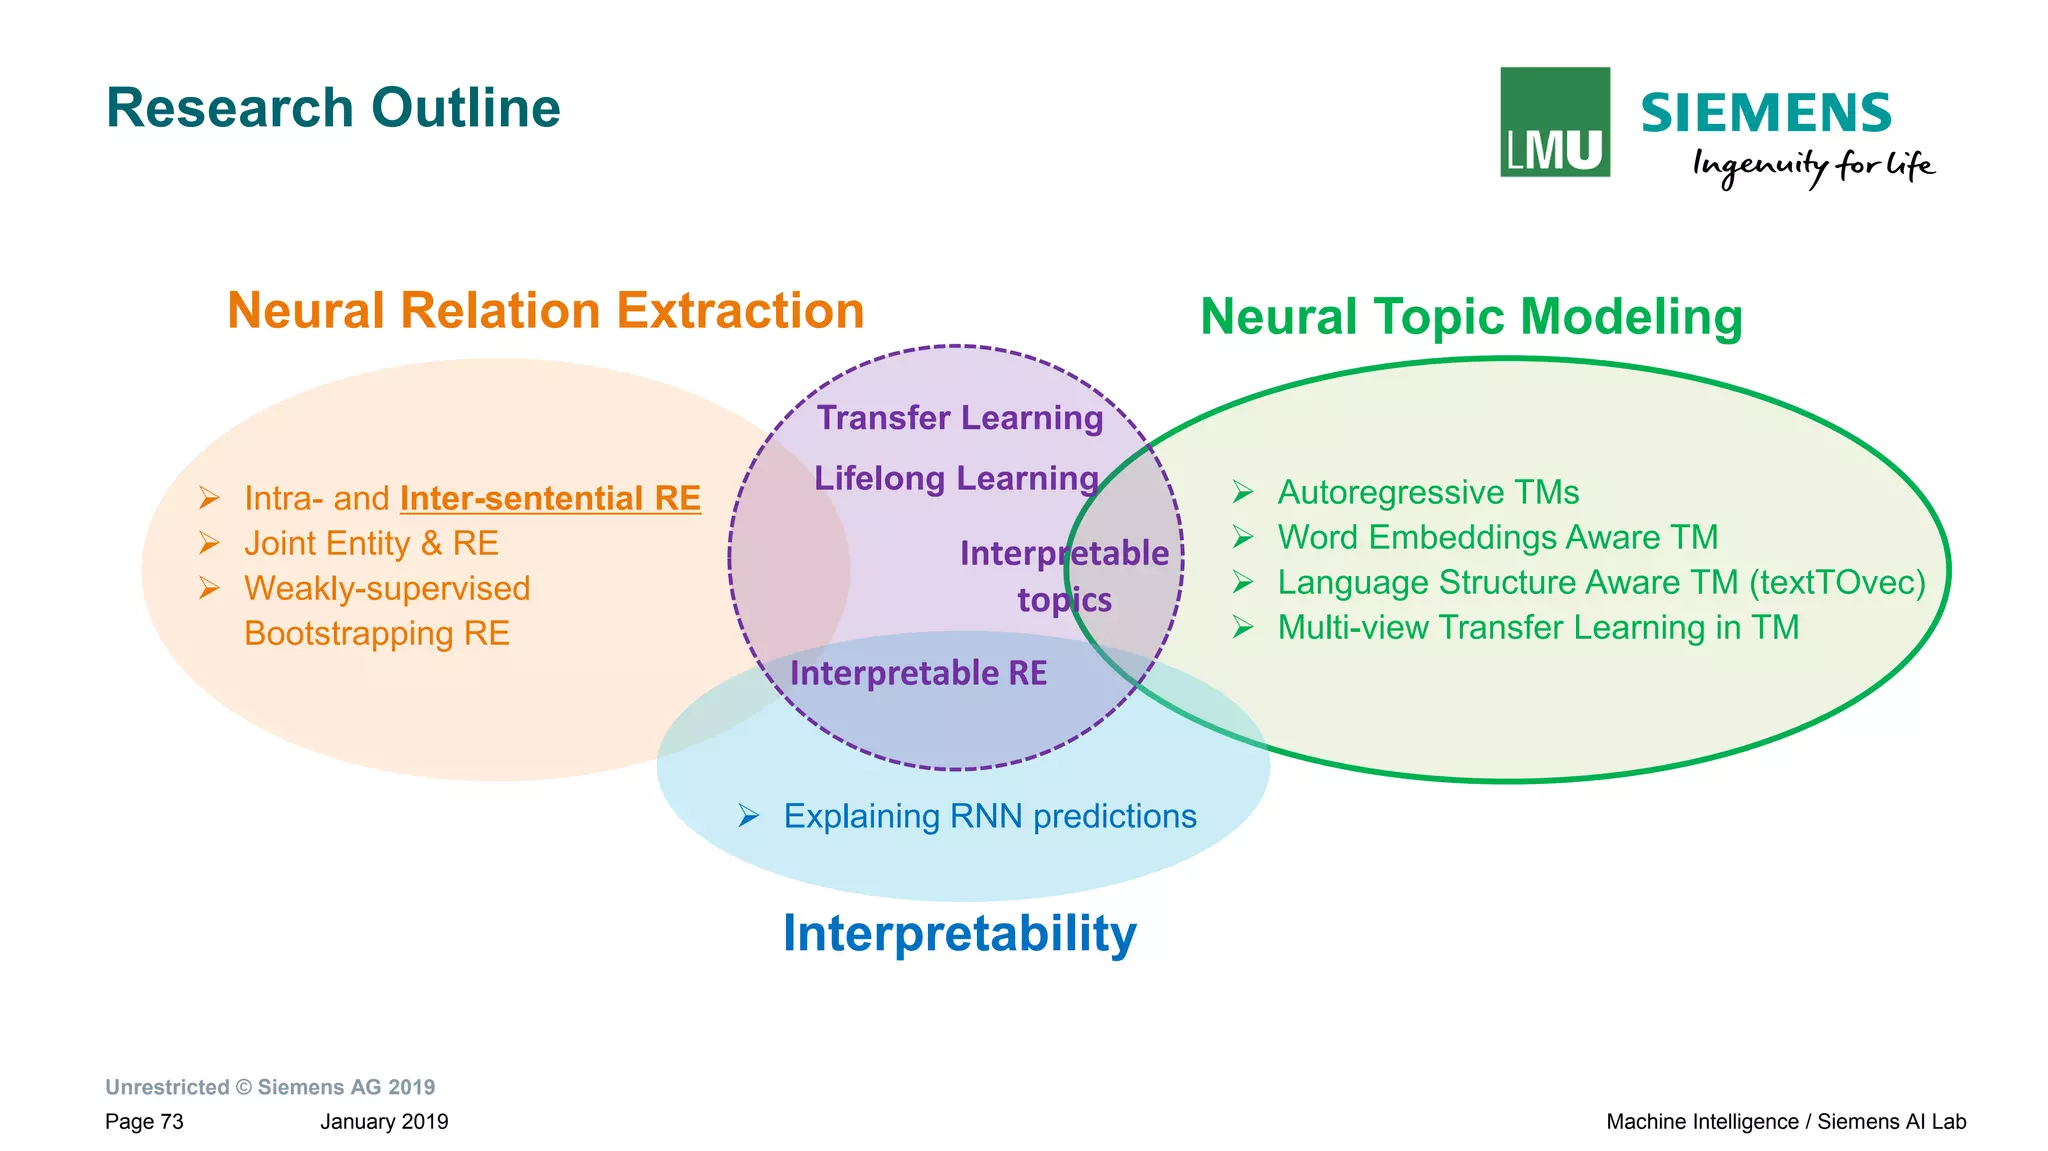
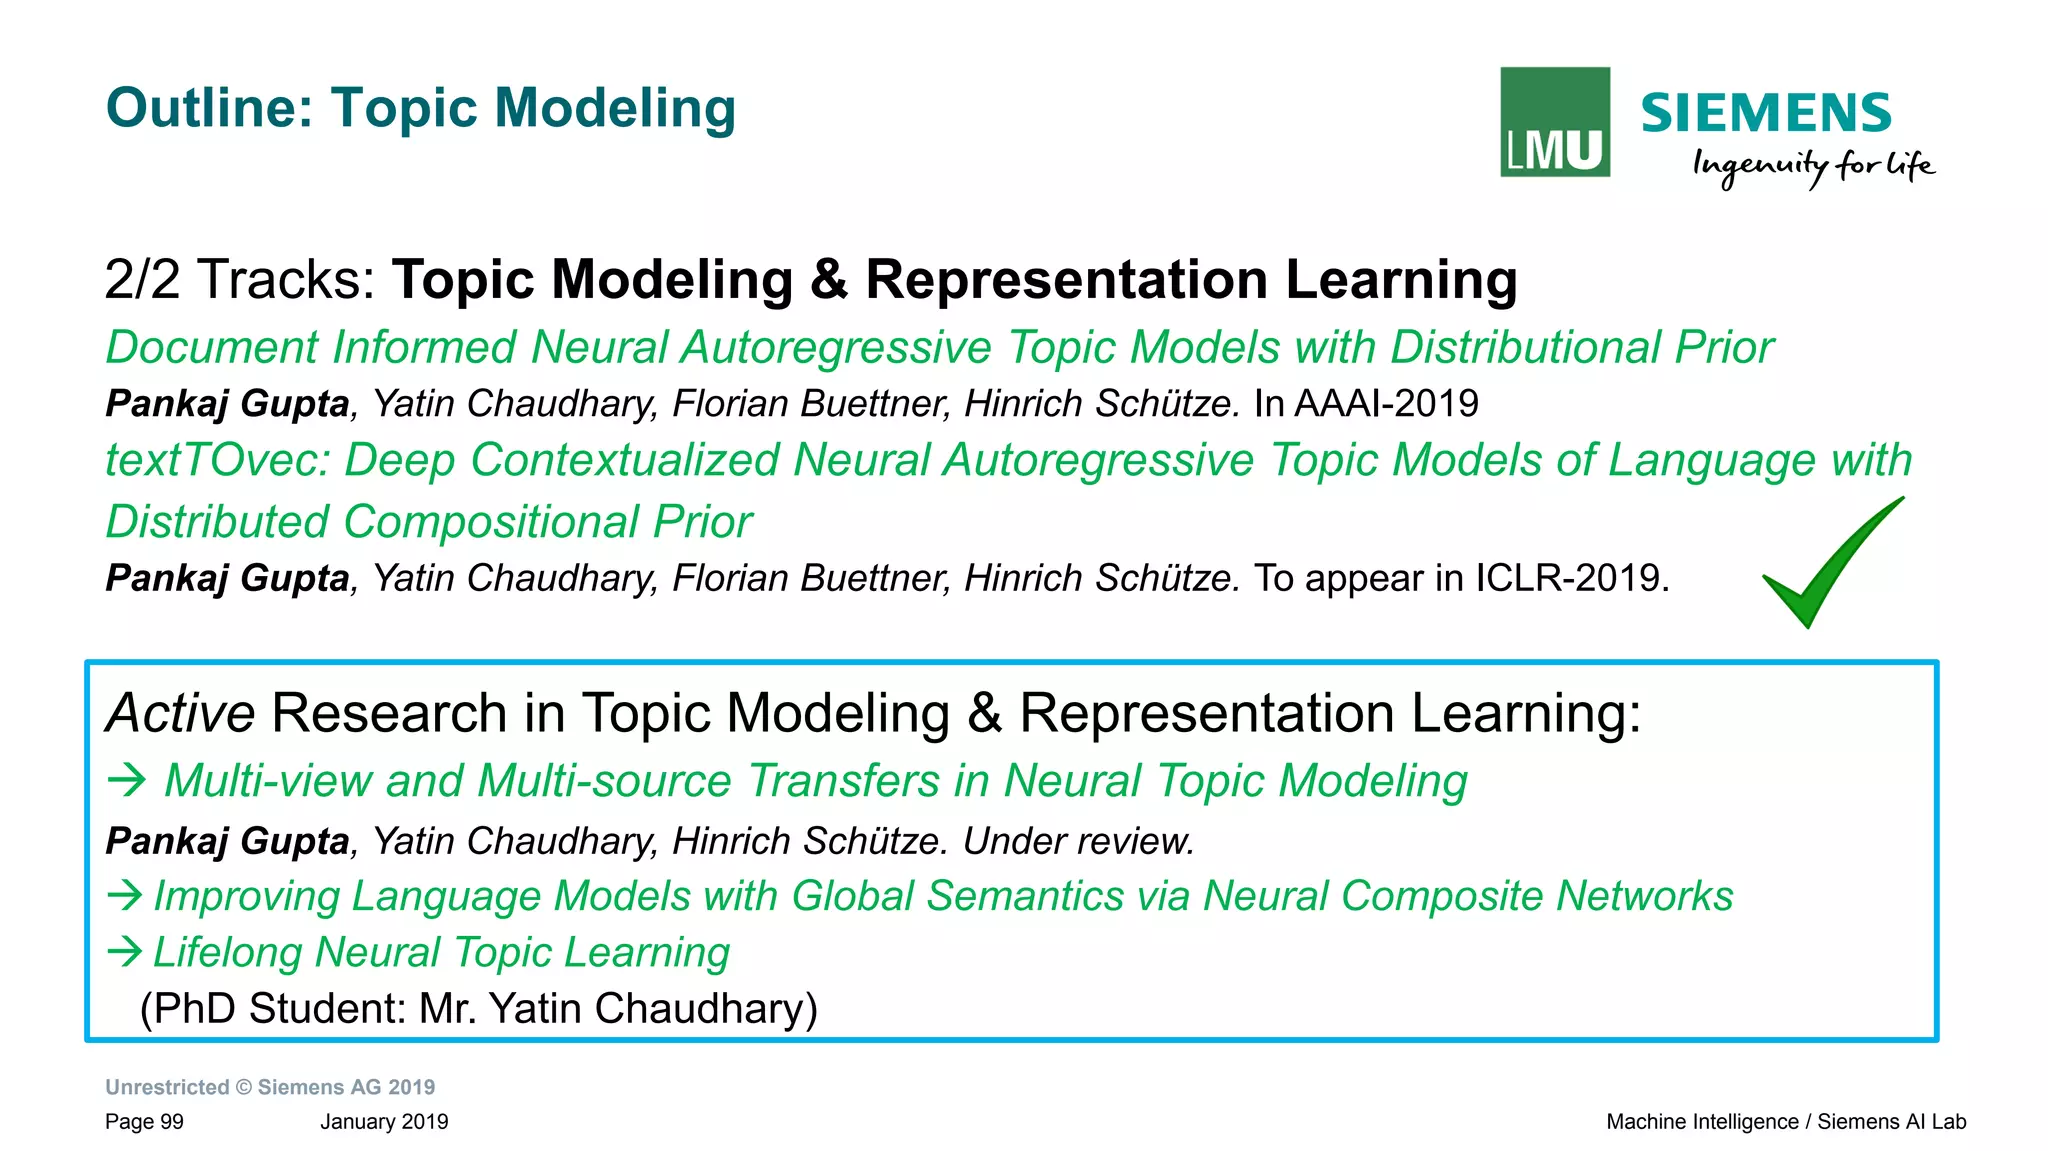
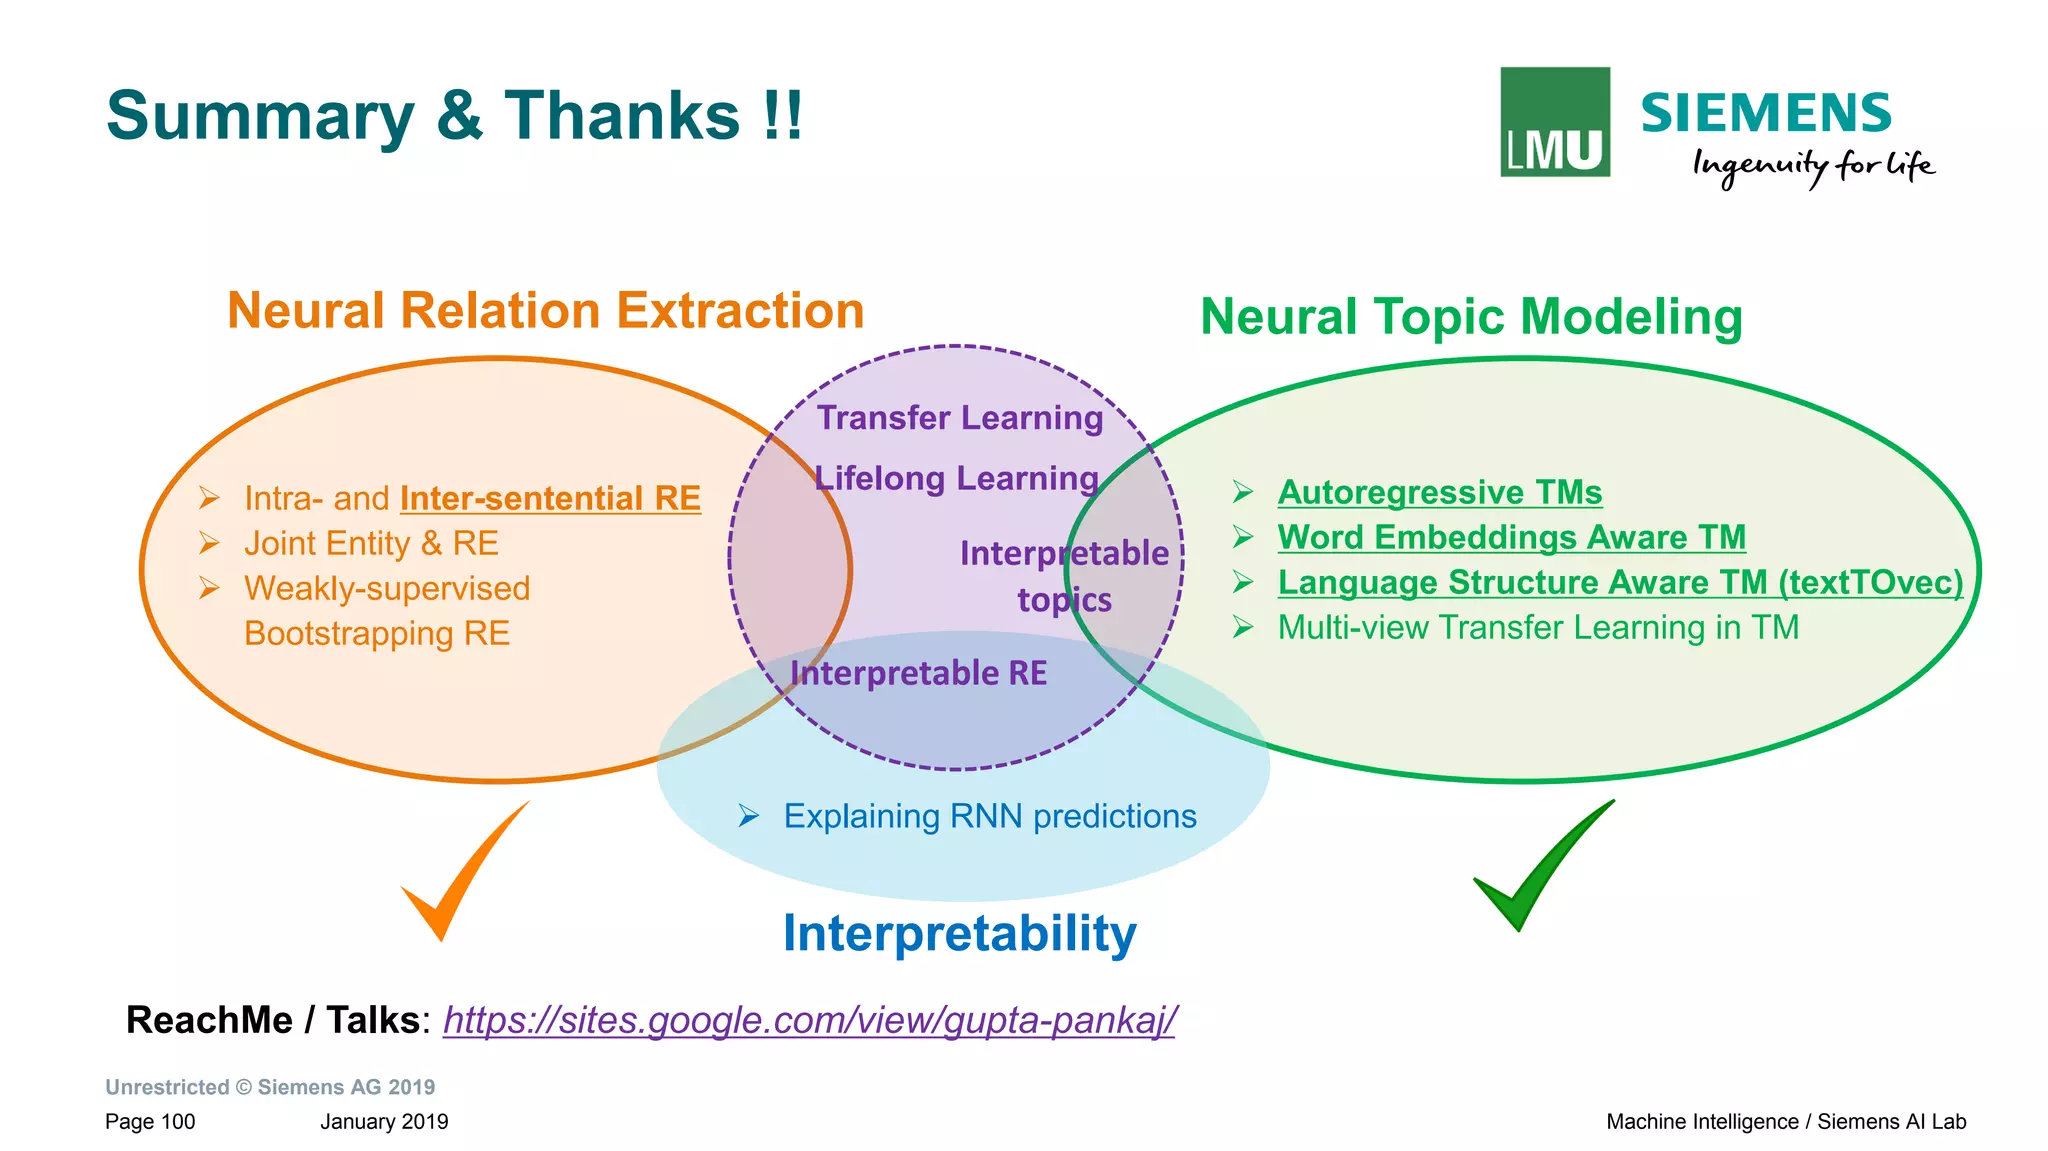
The document presents research by Pankaj Gupta on neural models for information extraction, focusing on relation extraction and topic modeling. It discusses the challenges of extracting relationships both within and across sentence boundaries, introducing a variety of methods, including inter-sentential dependency-based neural networks. The work aims to enhance automatic information extraction from unstructured text for applications such as knowledge graph construction.
![Unrestricted © Siemens AG 2019
January 2019Page 10 Machine Intelligence / Siemens AI Lab
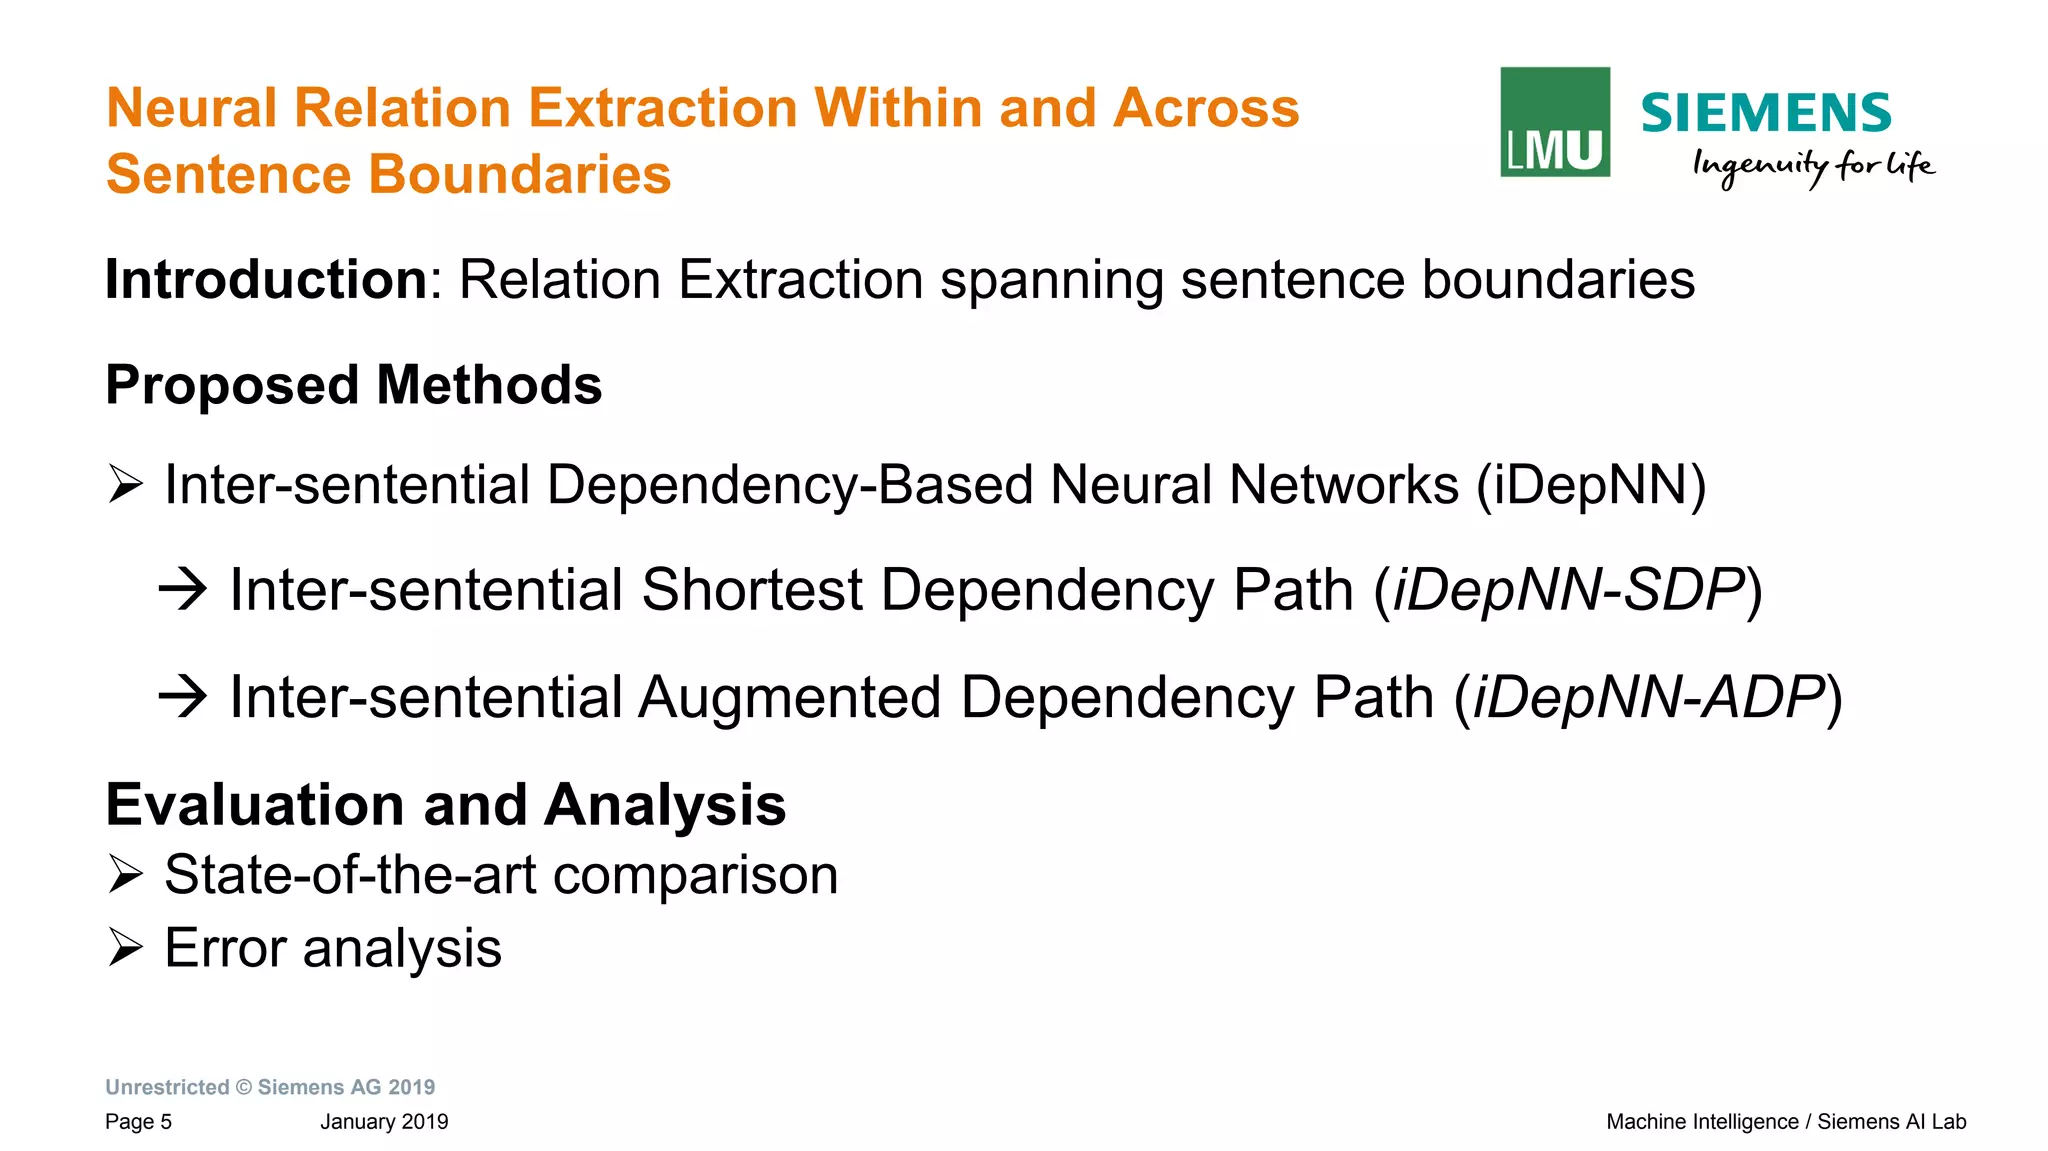
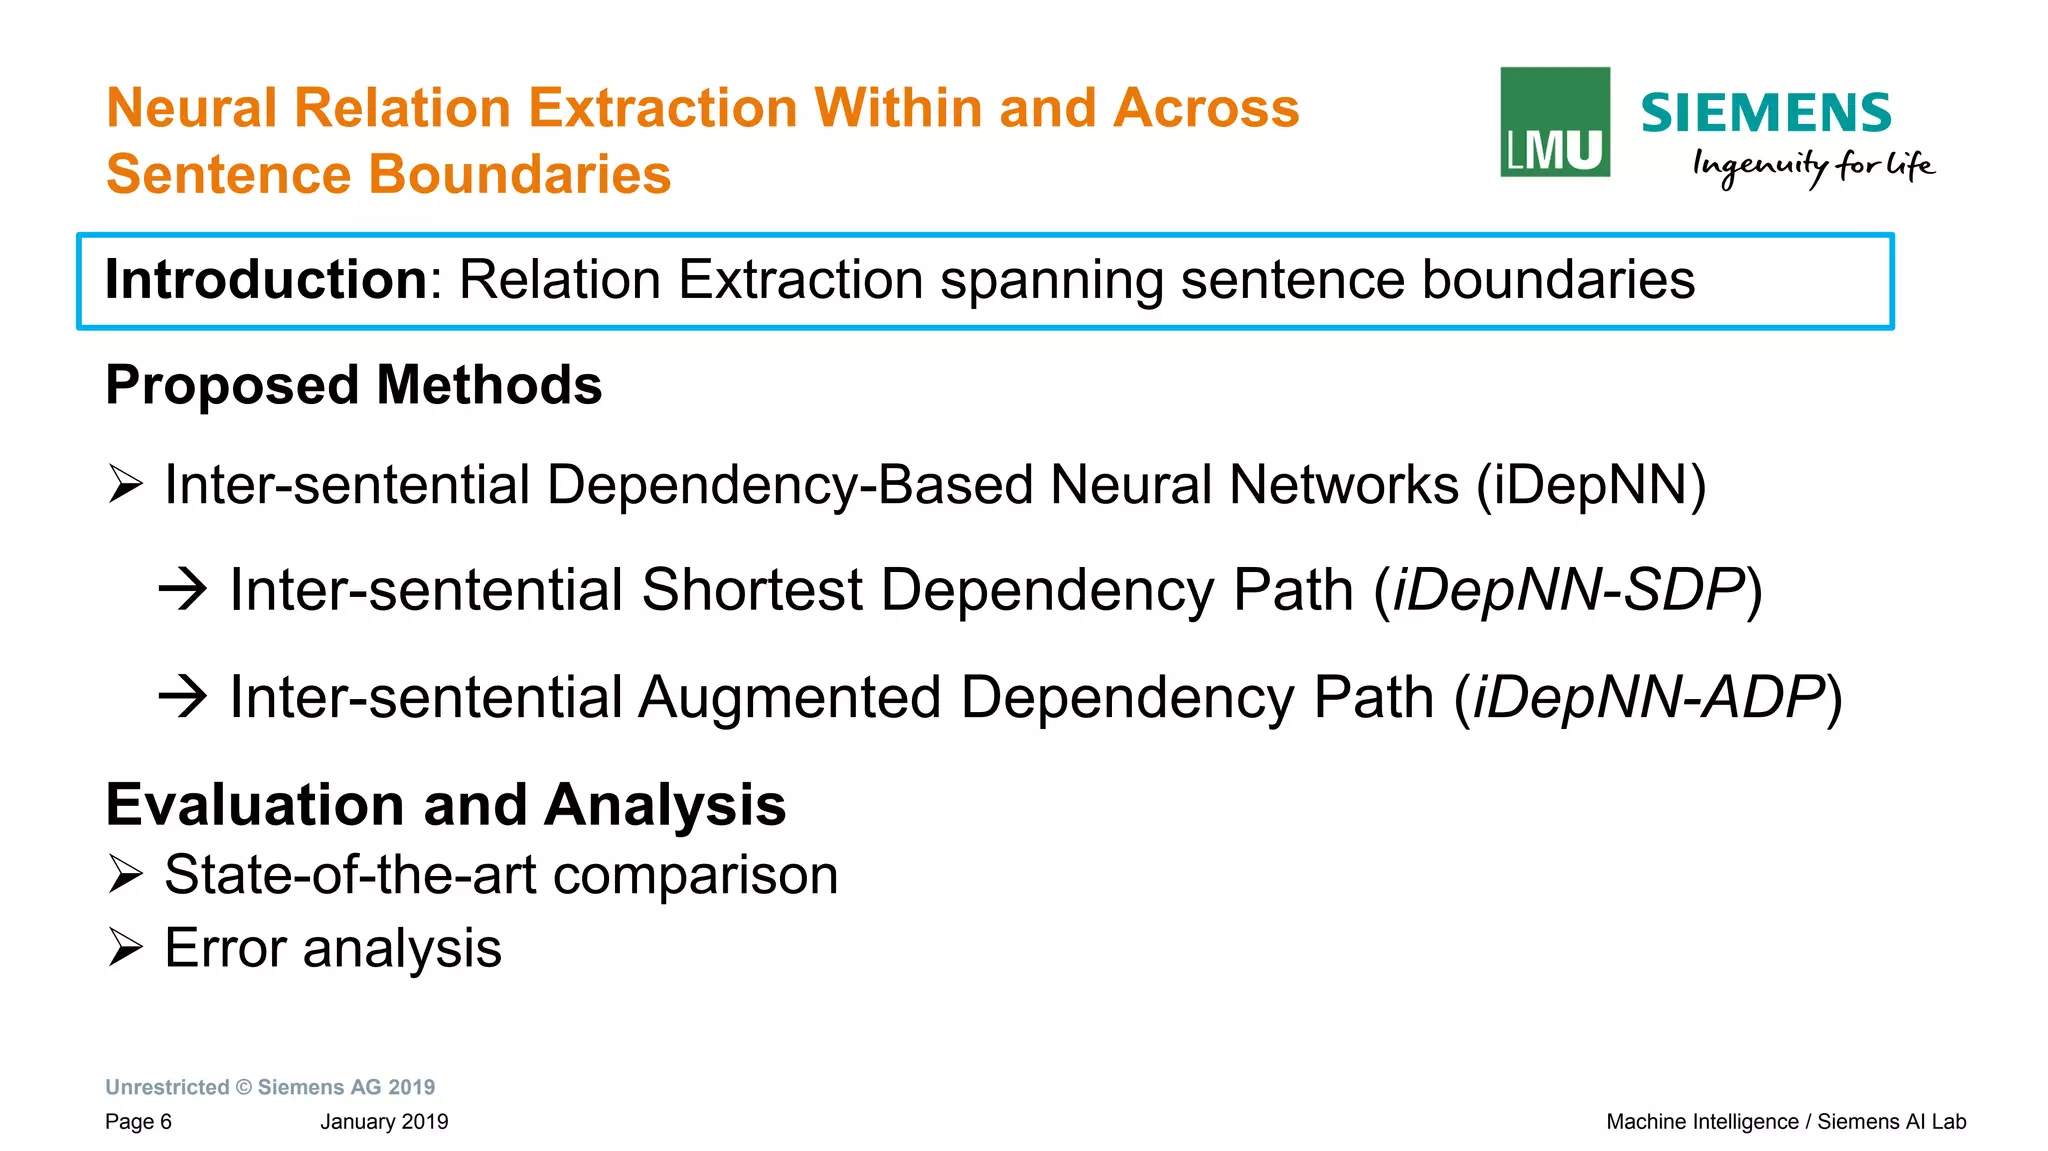
Introduction: Relation Extraction (RE)
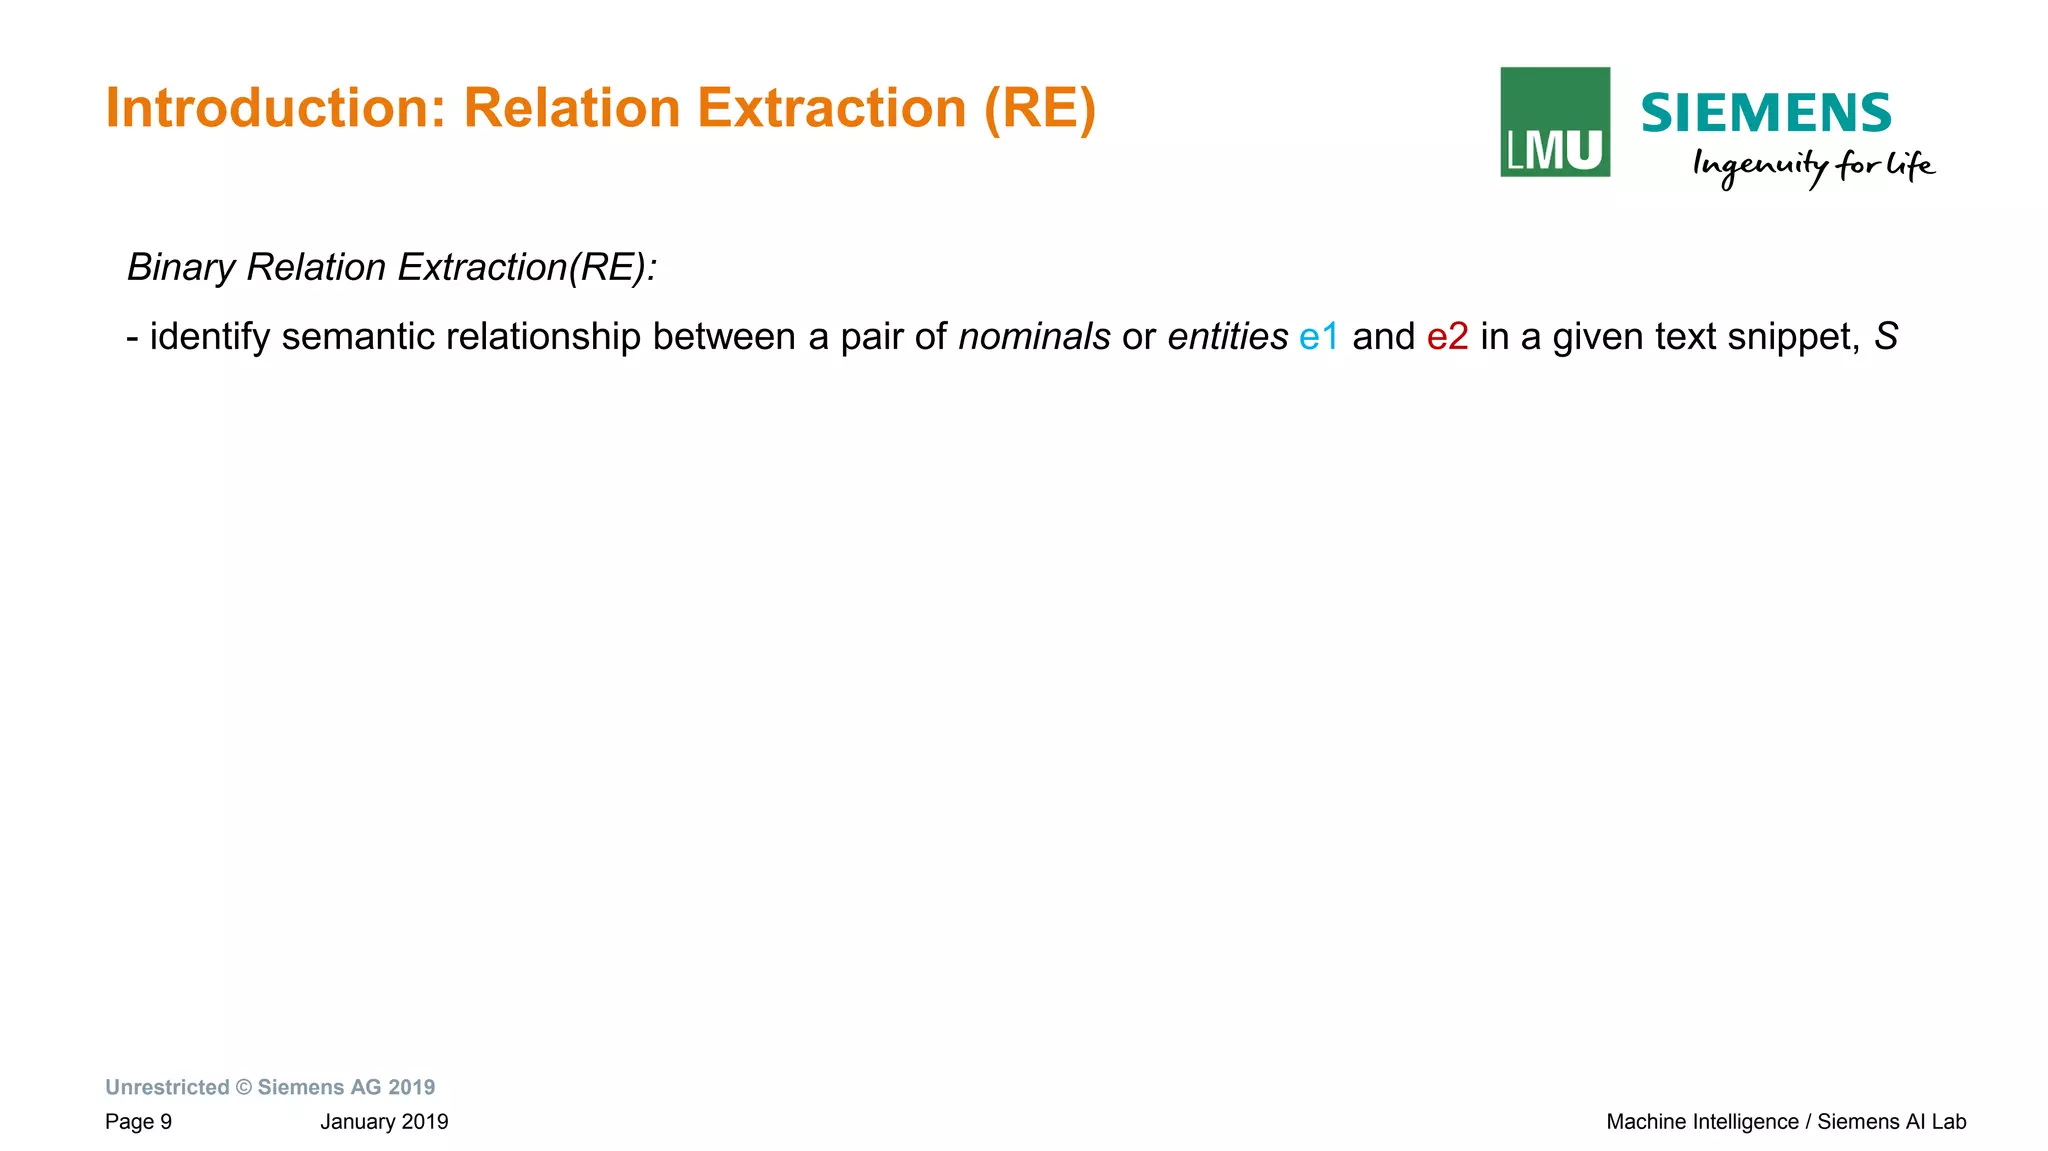
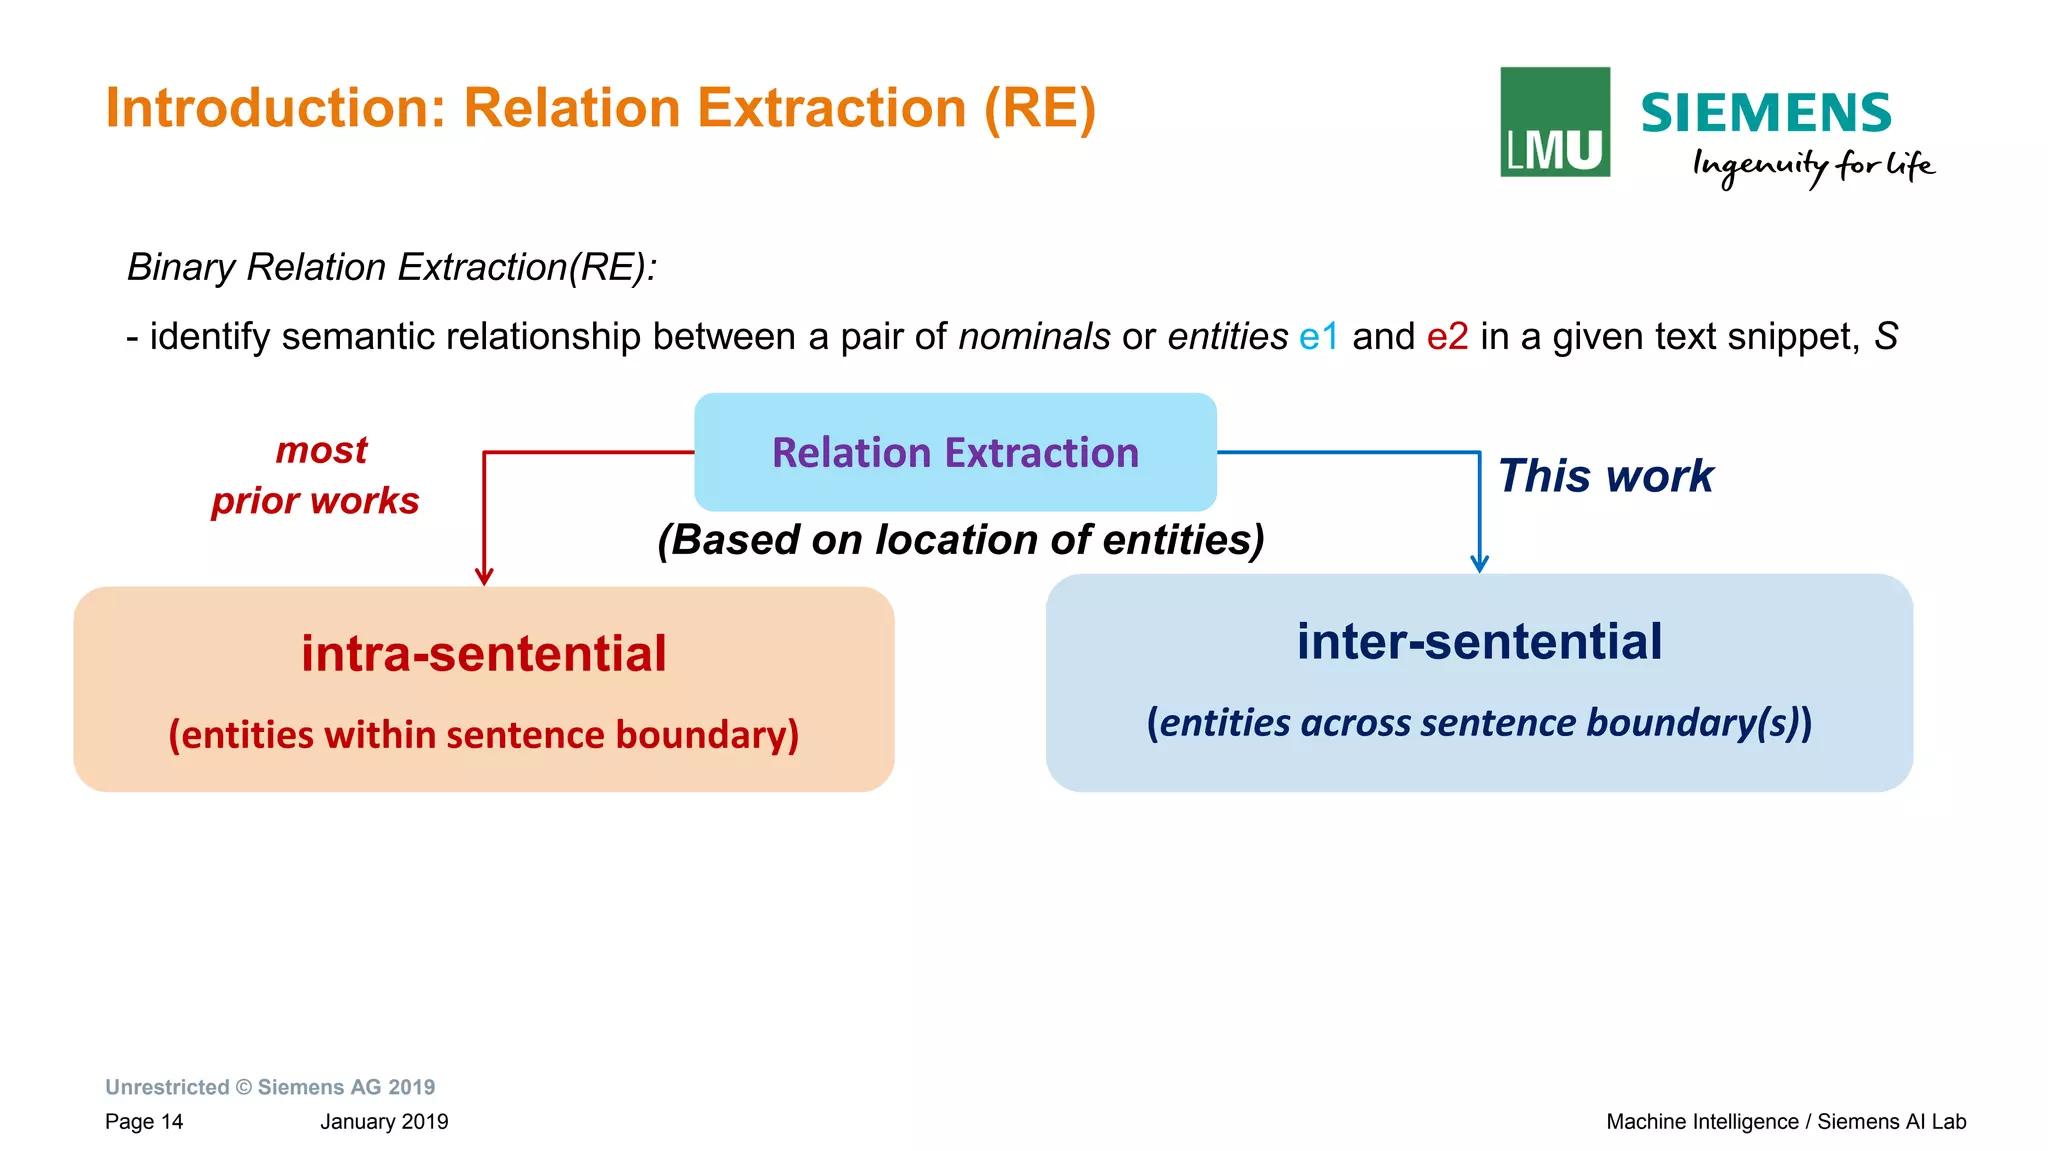
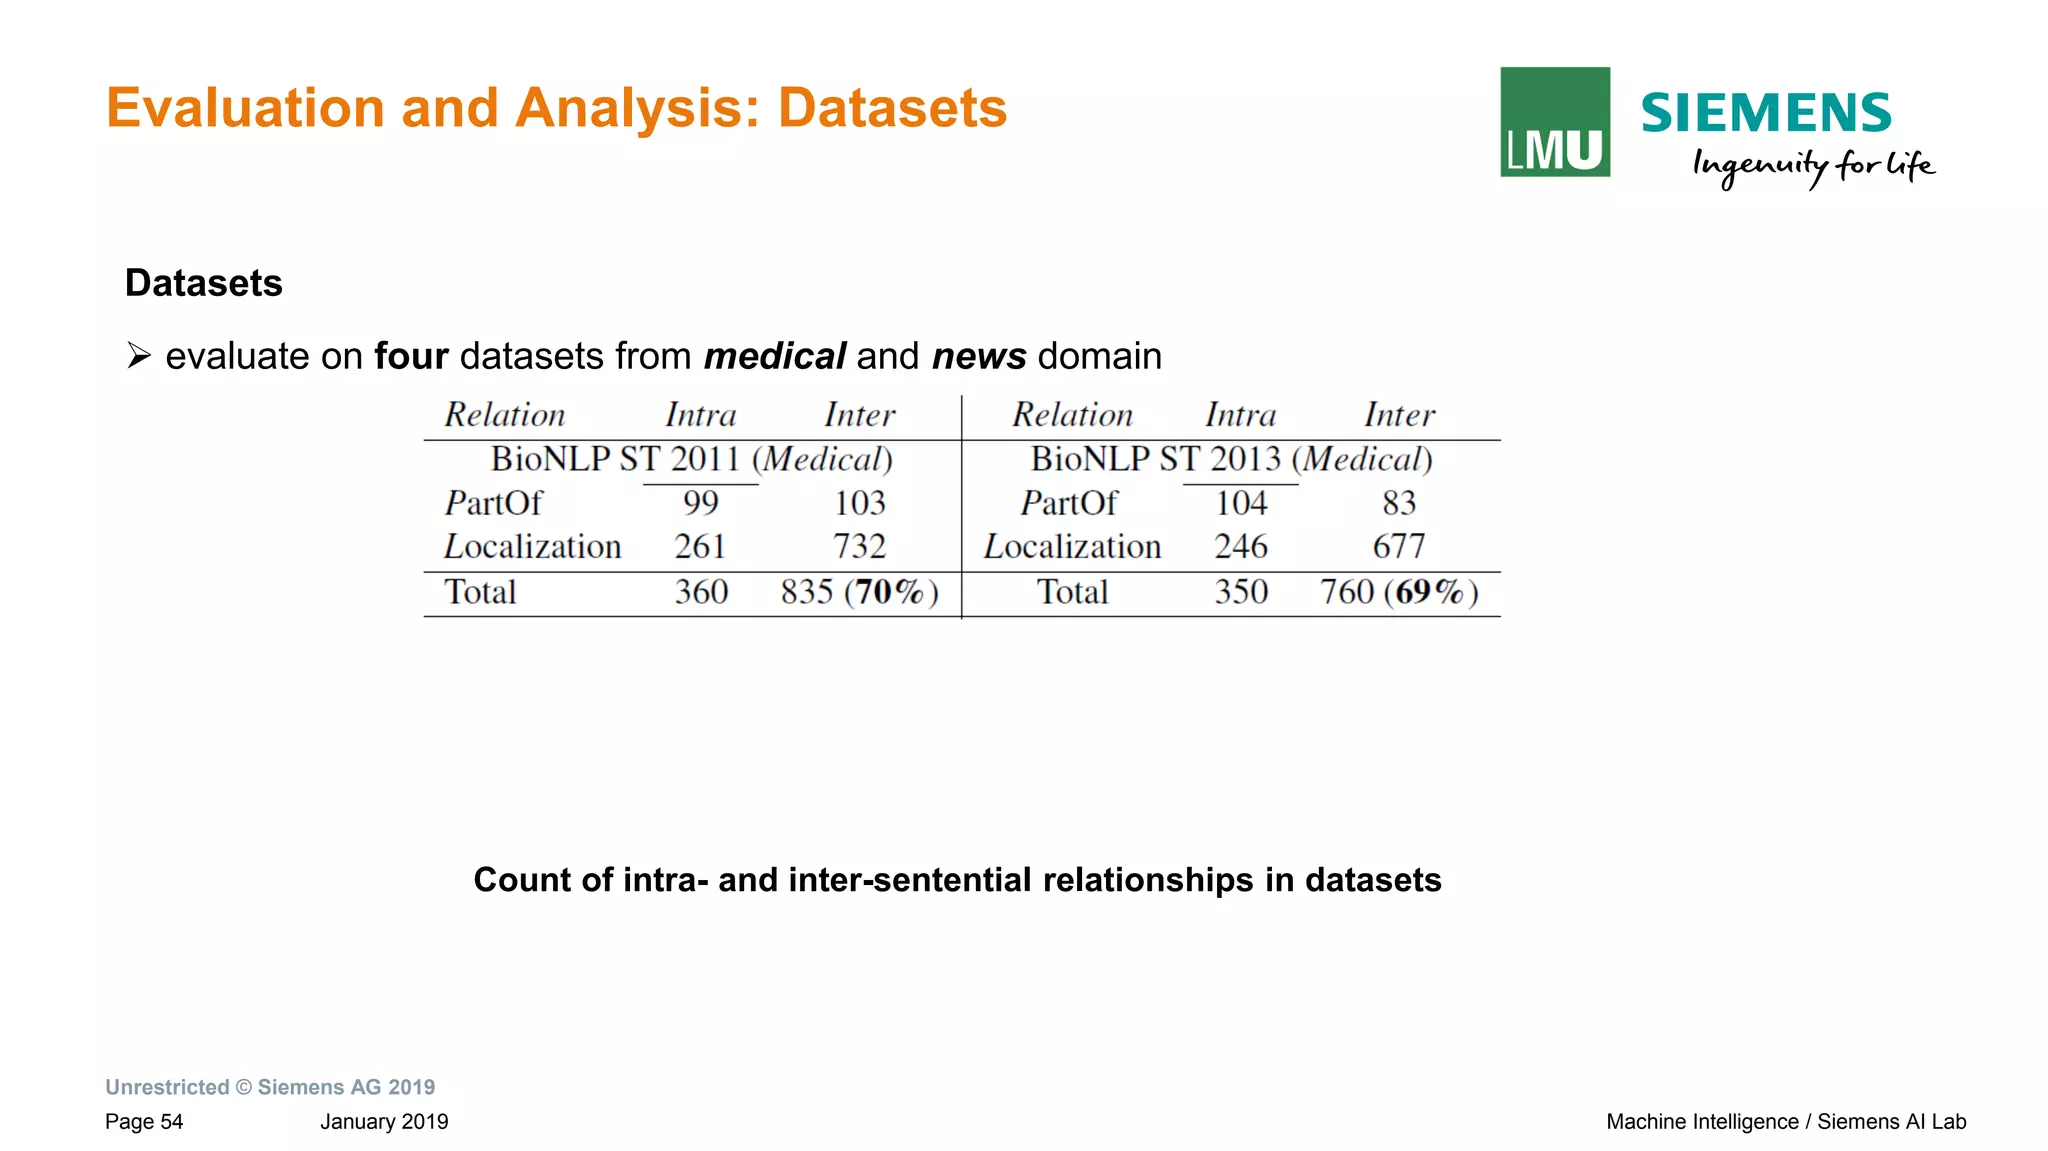
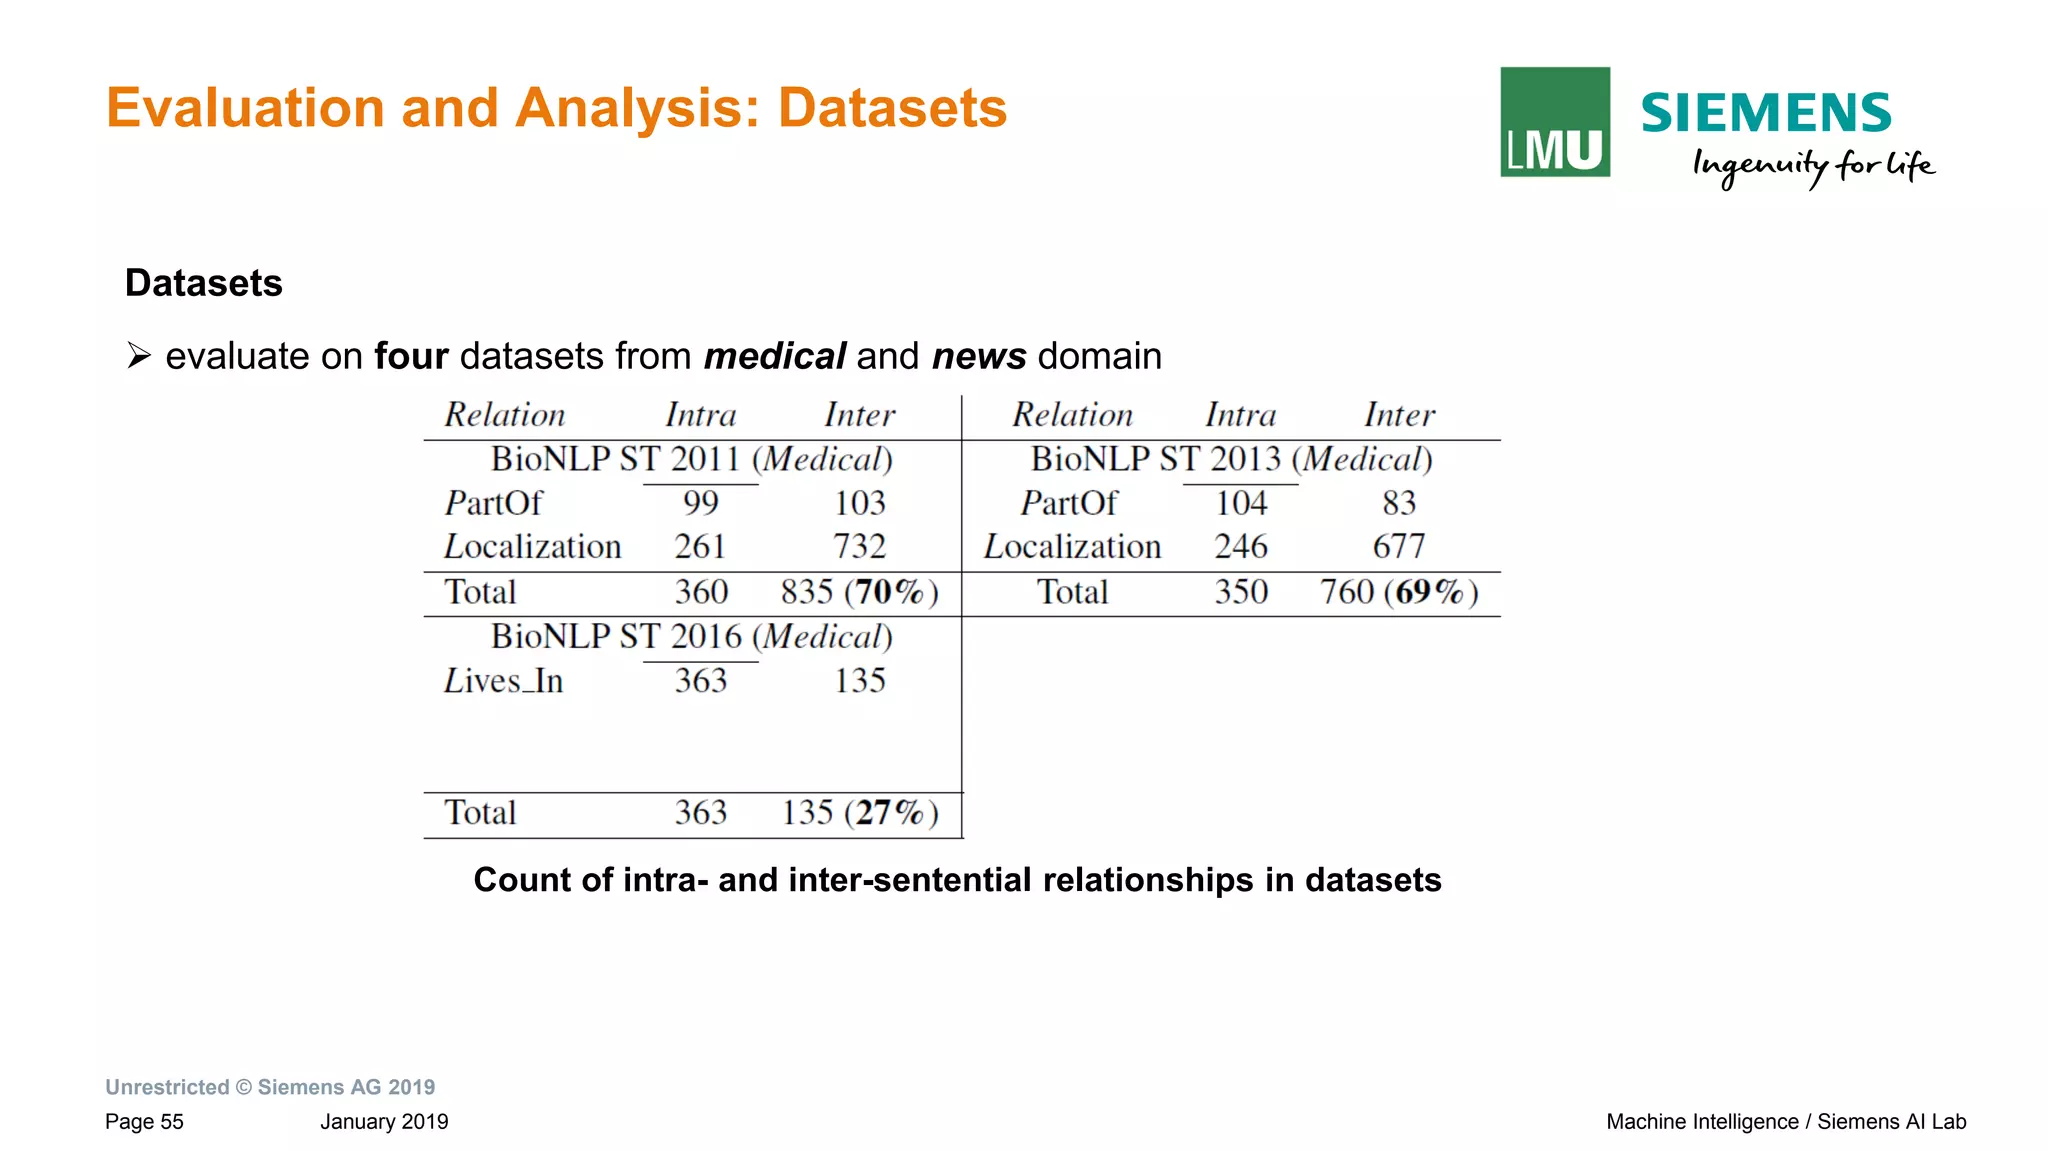
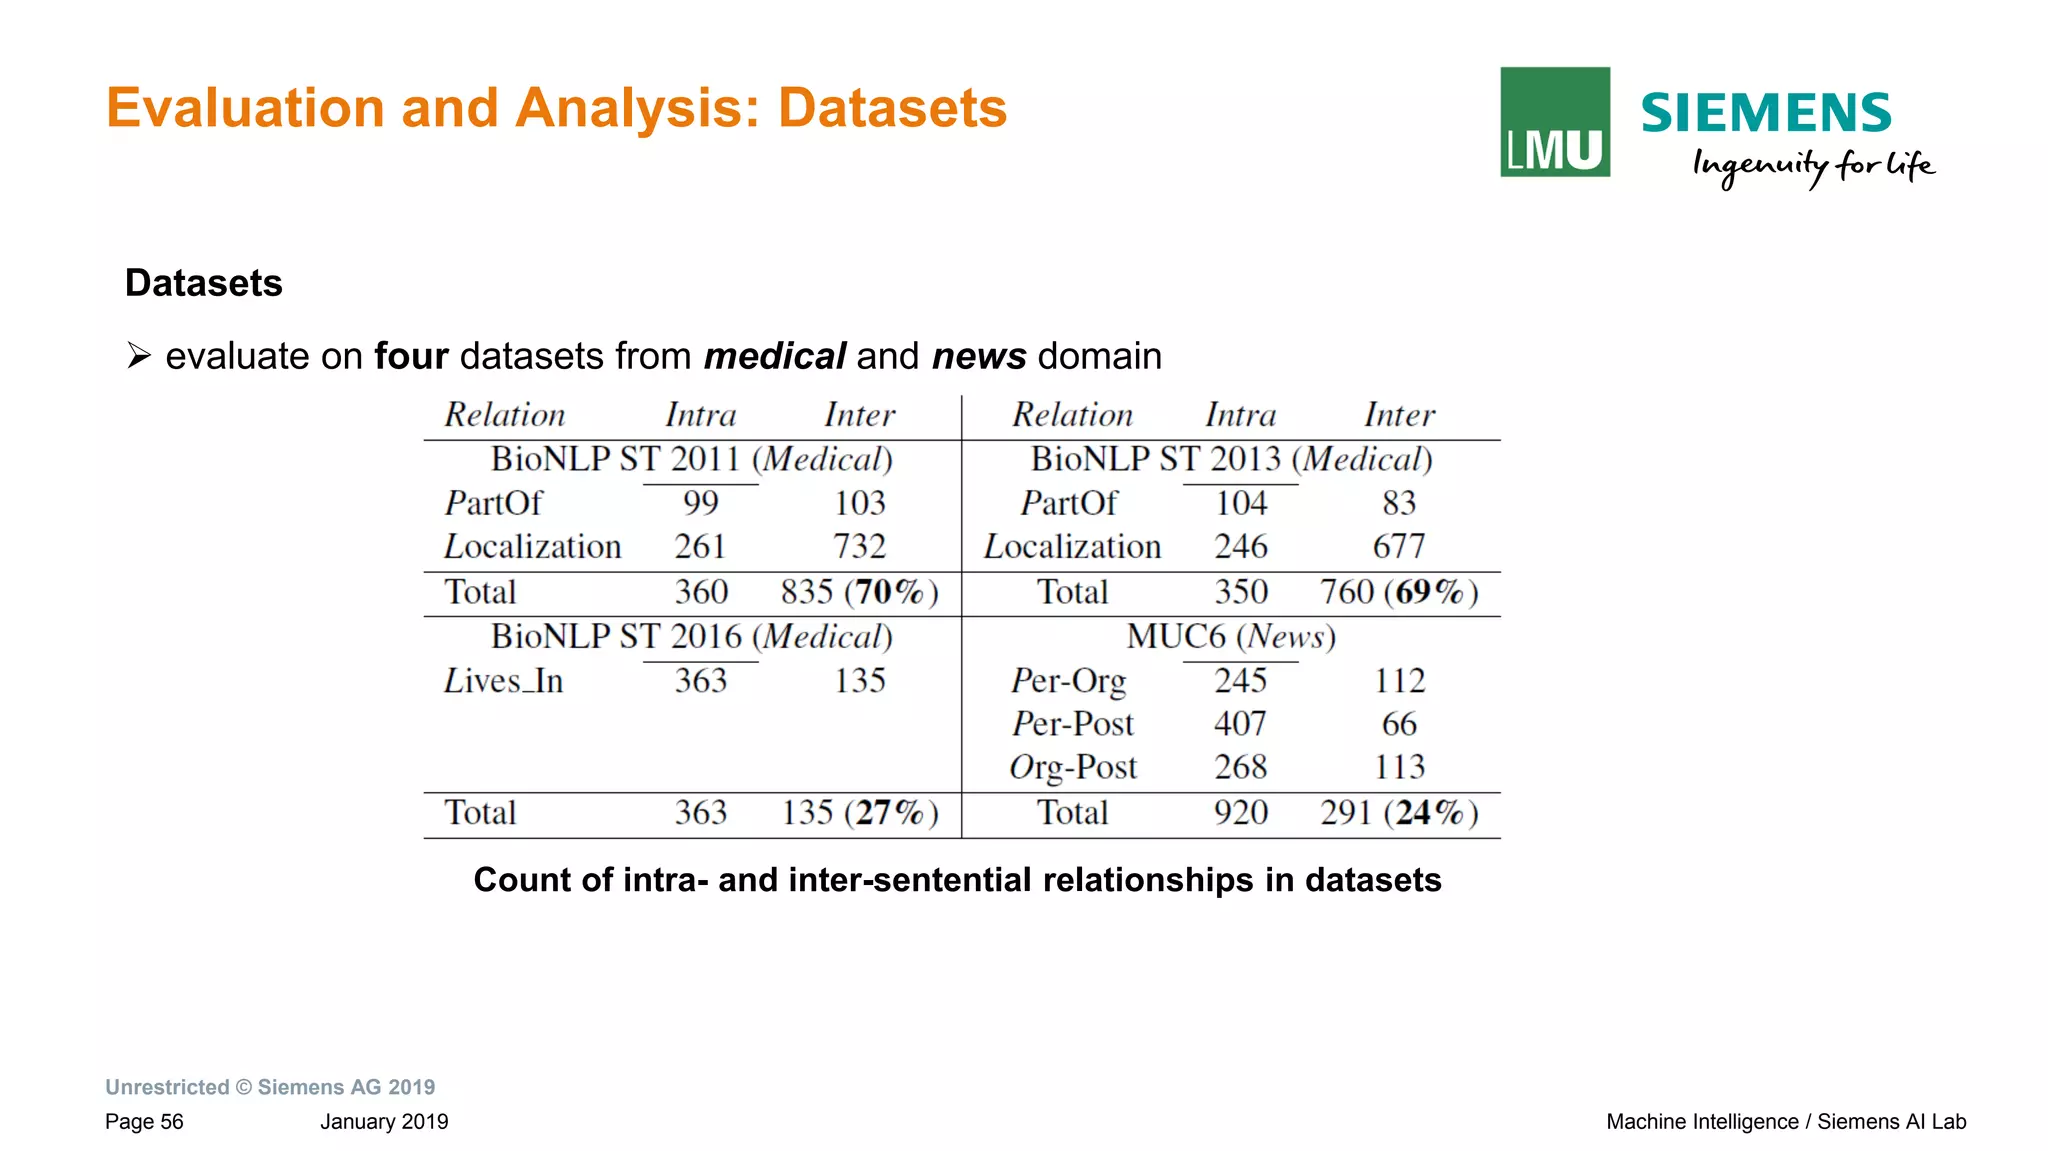
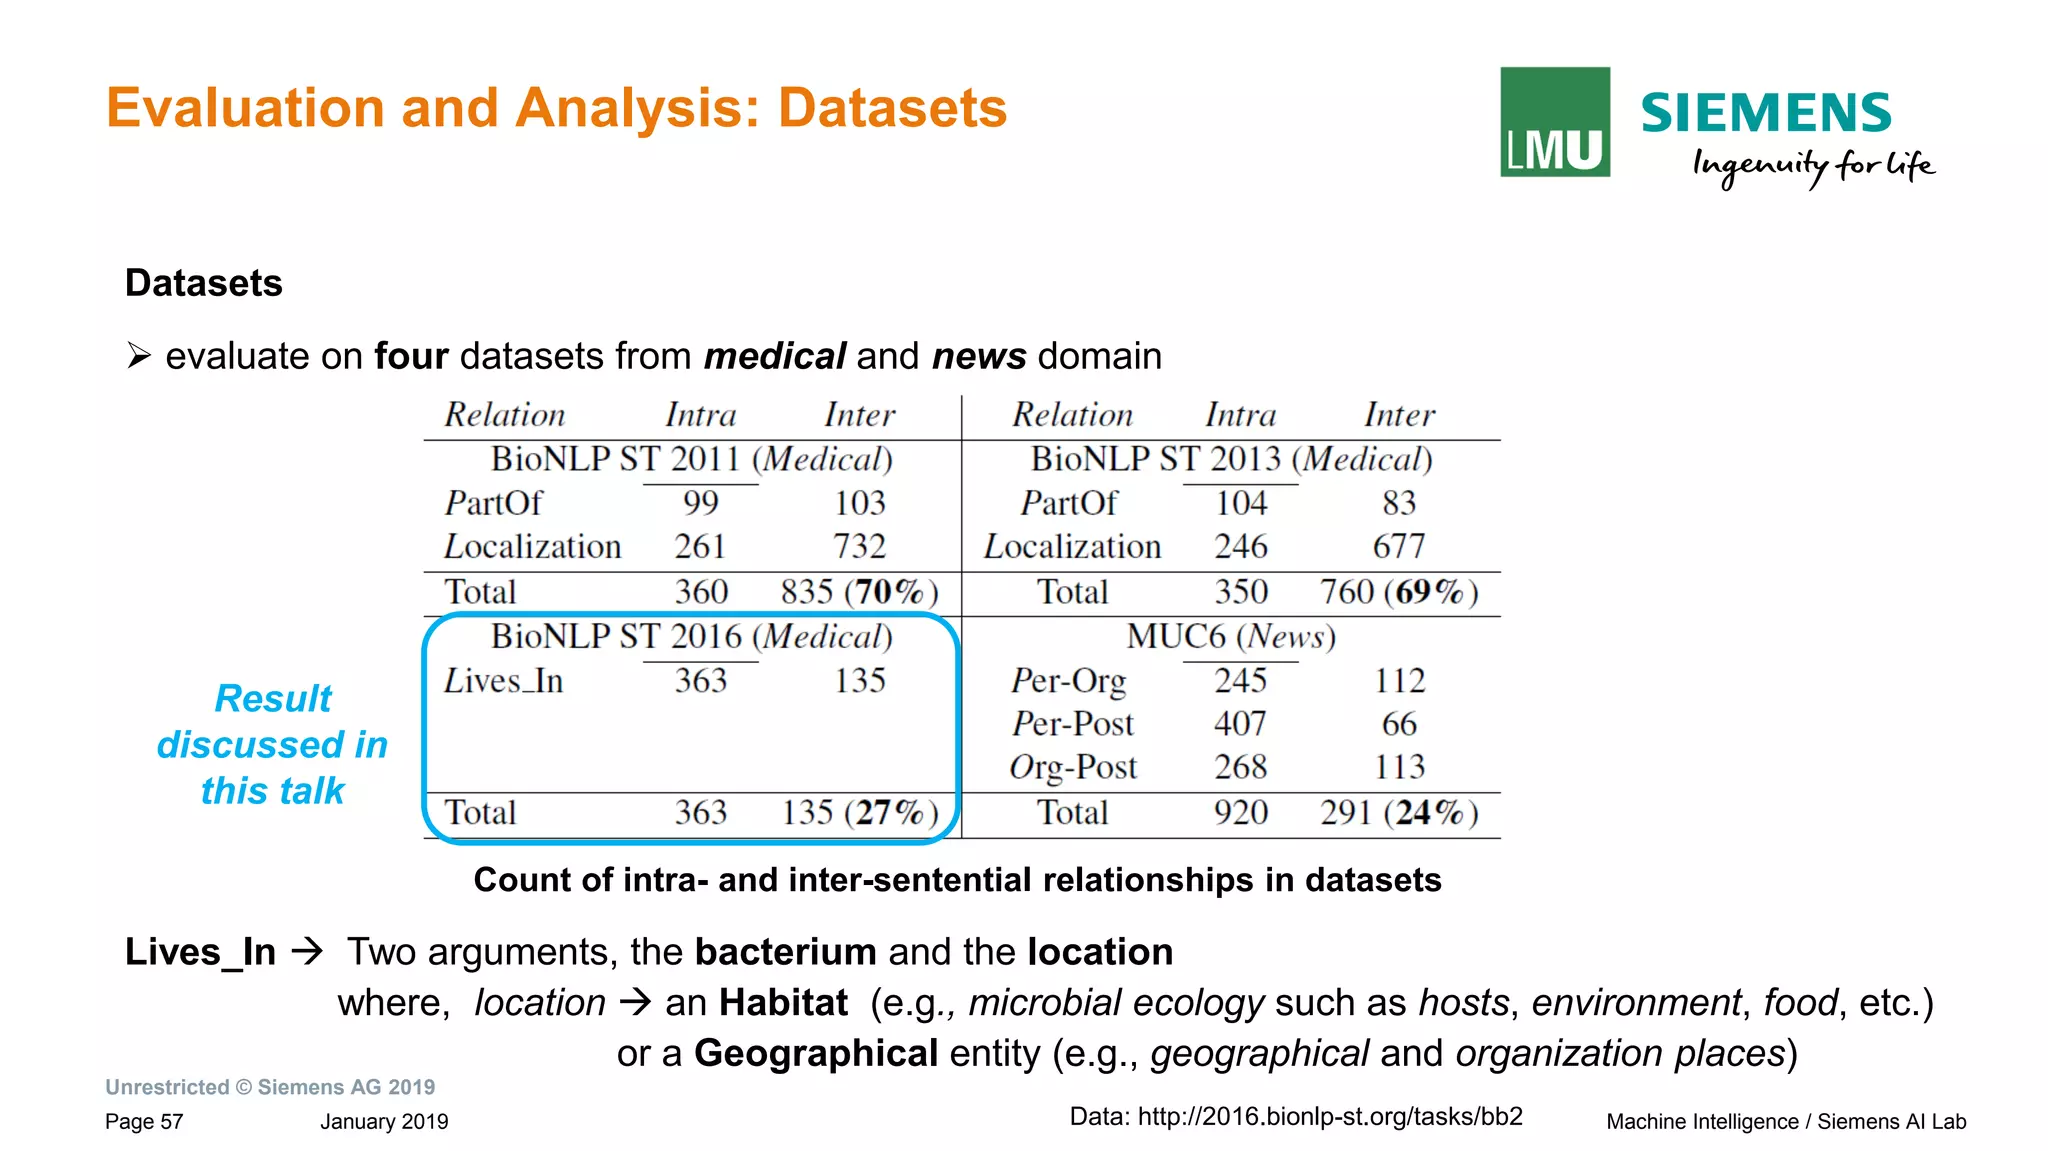
Binary Relation Extraction(RE):
- identify semantic relationship between a pair of nominals or entities e1 and e2 in a given text snippet, S
Paul Allen has started a company and named [Vern Raburn]e1 its [president]e2 .
relation: per-post(e1,e2)](https://image.slidesharecdn.com/neuralnlpmodelsofinformationextraction-190329170024/75/Neural-NLP-Models-of-Information-Extraction-10-2048.jpg)
![Unrestricted © Siemens AG 2019
January 2019Page 15 Machine Intelligence / Siemens AI Lab
Introduction: Relation Extraction (RE)
intra-sentential
(entities within sentence boundary)
most
prior works
This work
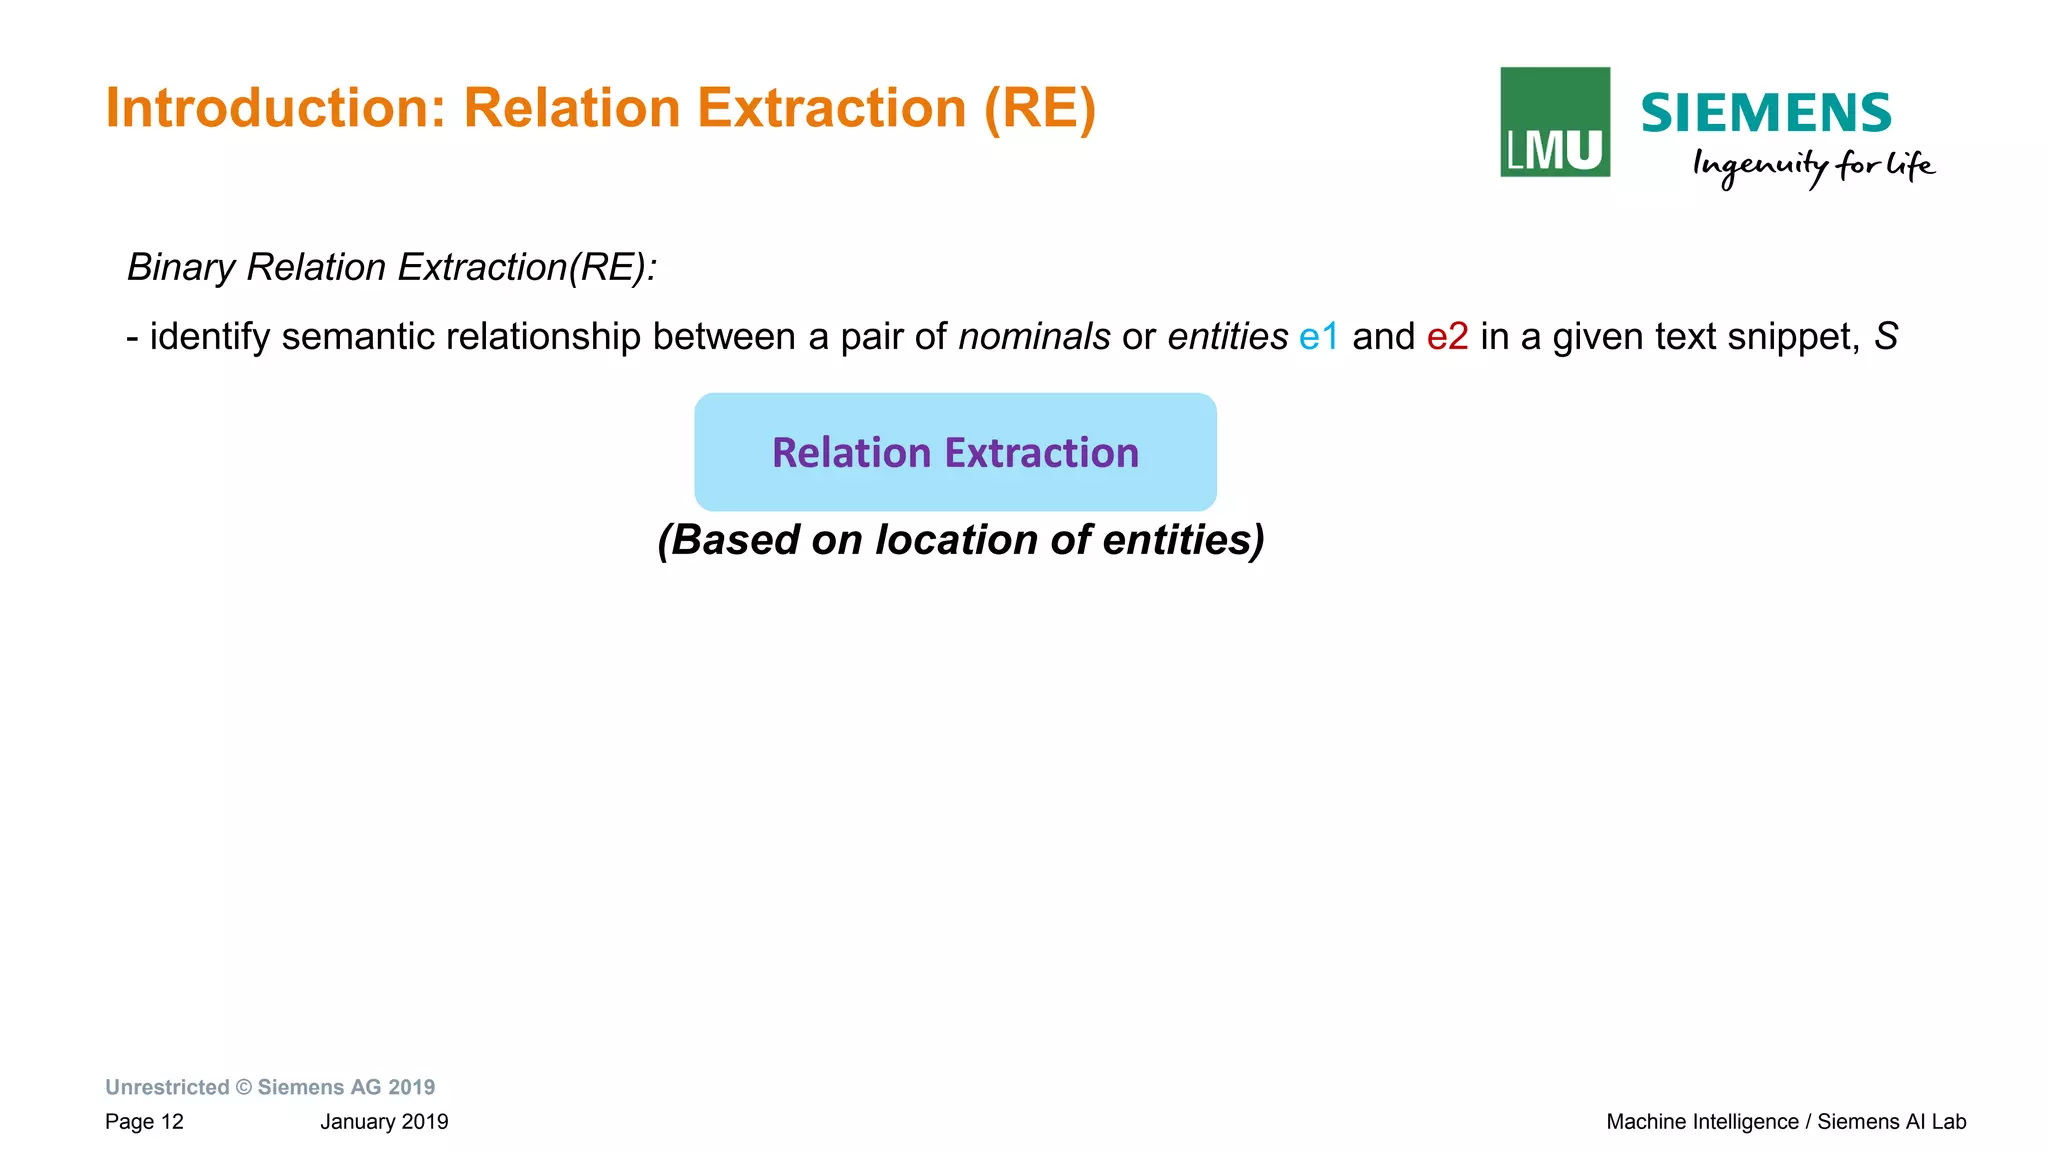
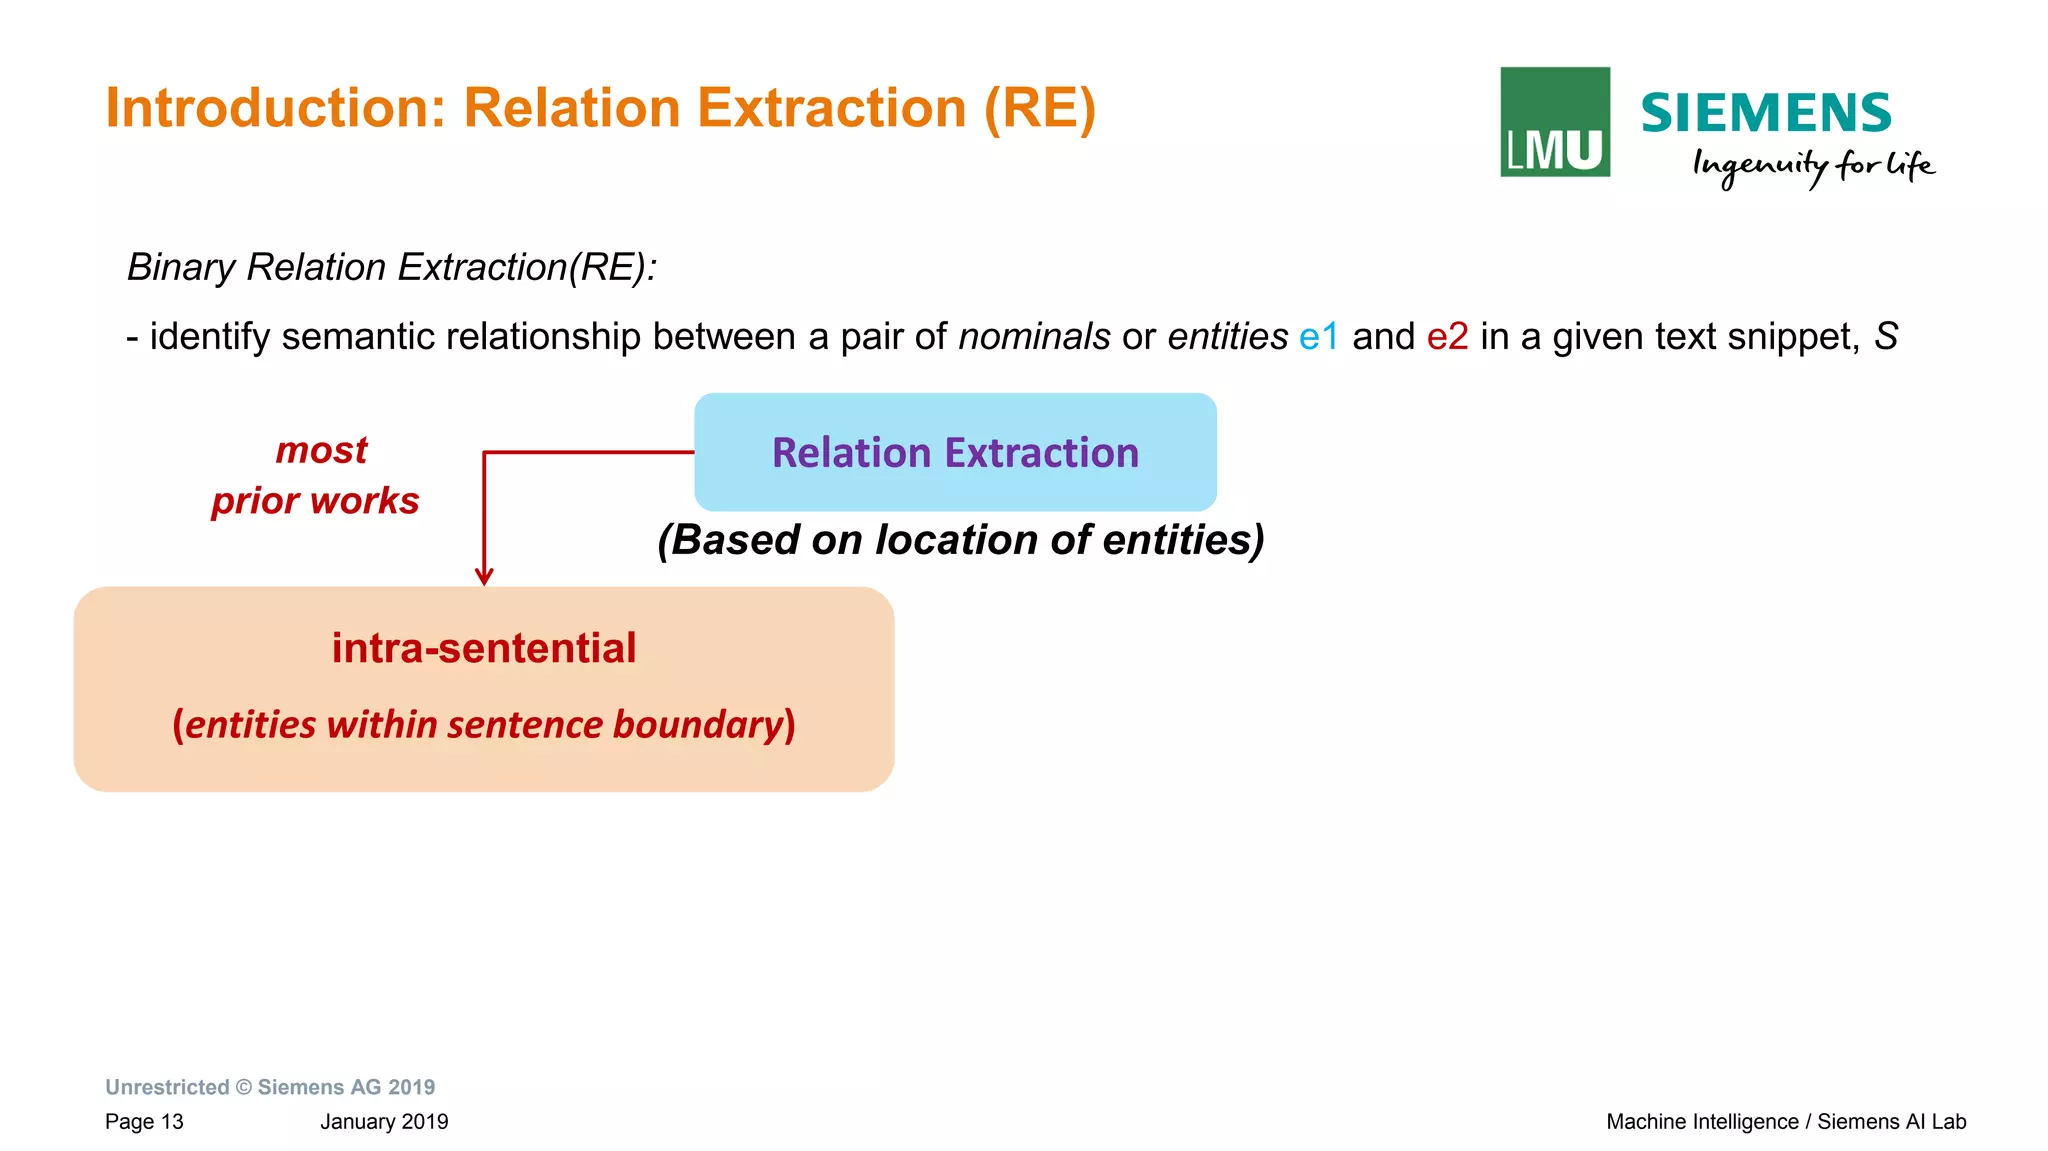
Binary Relation Extraction(RE):
- identify semantic relationship between a pair of nominals or entities e1 and e2 in a given text snippet, S
Relation Extraction
(Based on location of entities)
Paul Allen has started a company and named [Vern Raburn]e1 its [president]e2 .
relation: per-post(e1,e2)
Example
inter-sentential
(entities across sentence boundary(s))](https://image.slidesharecdn.com/neuralnlpmodelsofinformationextraction-190329170024/75/Neural-NLP-Models-of-Information-Extraction-15-2048.jpg)
![Unrestricted © Siemens AG 2019
January 2019Page 16 Machine Intelligence / Siemens AI Lab
Introduction: Relation Extraction (RE)
intra-sentential
(entities within sentence boundary)
most
prior works
This work
Binary Relation Extraction(RE):
- identify semantic relationship between a pair of nominals or entities e1 and e2 in a given text snippet, S
Relation Extraction
(Based on location of entities)
Paul Allen has started a company and named [Vern Raburn]e1 its president. The
company, to be called [Paul Allen Group]e2 will be based in Bellevue, Washington.
relation: per-org(e1,e2)
inter-sentential
(entities across sentence boundary(s))
Example](https://image.slidesharecdn.com/neuralnlpmodelsofinformationextraction-190329170024/75/Neural-NLP-Models-of-Information-Extraction-16-2048.jpg)
![Unrestricted © Siemens AG 2019
January 2019Page 17 Machine Intelligence / Siemens AI Lab
Introduction: Relation Extraction (RE)
intra-sentential
(entities within sentence boundary)
most
prior works
This work
Binary Relation Extraction(RE):
- identify semantic relationship between a pair of nominals or entities e1 and e2 in a given text snippet, S
Relation Extraction
(Based on location of entities)
Paul Allen has started a company and named [Vern Raburn]e1 its president. The
company, to be called [Paul Allen Group]e2 will be based in Bellevue, Washington.
relation: ??
inter-sentential
(entities across sentence boundary(s))
MISSED relationships:
Impact the system
performance, leading
to POOR RECALL](https://image.slidesharecdn.com/neuralnlpmodelsofinformationextraction-190329170024/75/Neural-NLP-Models-of-Information-Extraction-17-2048.jpg)
![Unrestricted © Siemens AG 2019
January 2019Page 18 Machine Intelligence / Siemens AI Lab
Introduction: Relation Extraction (RE)
intra-sentential
(entities within sentence boundary)
most
prior works
This work
Binary Relation Extraction(RE):
- identify semantic relationship between a pair of nominals or entities e1 and e2 in a given text snippet, S
Relation Extraction
(Based on location of entities)
Paul Allen has started a company and named [Vern Raburn]e1 its president. The
company, to be called [Paul Allen Group]e2 will be based in Bellevue, Washington.
relation: per-org(e1,e2)
inter-sentential
(entities across sentence boundary(s))
Capture relationship
between entities at
distance across
sentence boundaries](https://image.slidesharecdn.com/neuralnlpmodelsofinformationextraction-190329170024/75/Neural-NLP-Models-of-Information-Extraction-18-2048.jpg)
![Unrestricted © Siemens AG 2019
January 2019Page 19 Machine Intelligence / Siemens AI Lab
Challenges in Inter-sentential Relation Extraction (RE)
This work
Paul Allen has started a company and named [Vern Raburn]e1 its president.
The company will coordinate the overall strategy for the group of high-tech
companies that Mr. Allen owns or holds a significant stake in, will be based in
Bellevue, Washington and called [Paul Allen Group]e2 .
relation: per-org(e1,e2)
inter-sentential
(entities across sentence boundary(s))](https://image.slidesharecdn.com/neuralnlpmodelsofinformationextraction-190329170024/75/Neural-NLP-Models-of-Information-Extraction-19-2048.jpg)
![Unrestricted © Siemens AG 2019
January 2019Page 20 Machine Intelligence / Siemens AI Lab
Challenges in Inter-sentential Relation Extraction (RE)
This work
Paul Allen has started a company and named [Vern Raburn]e1 its president.
The company will coordinate the overall strategy for the group of high-tech
companies that Mr. Allen owns or holds a significant stake in, will be based in
Bellevue, Washington and called [Paul Allen Group]e2 .
relation: per-org(e1,e2)
inter-sentential
(entities across sentence boundary(s))
NOISY text in relationships
spanning sentence boundaries:
POOR PRECISION](https://image.slidesharecdn.com/neuralnlpmodelsofinformationextraction-190329170024/75/Neural-NLP-Models-of-Information-Extraction-20-2048.jpg)
![Unrestricted © Siemens AG 2019
January 2019Page 21 Machine Intelligence / Siemens AI Lab
Challenges in Inter-sentential Relation Extraction (RE)
This work
Paul Allen has started a company and named [Vern Raburn]e1 its president.
The company will coordinate the overall strategy for the group of high-tech
companies that Mr. Allen owns or holds a significant stake in, will be based in
Bellevue, Washington and called [Paul Allen Group]e2 .
relation: per-org(e1,e2)
inter-sentential
(entities across sentence boundary(s))
NOISY text in relationships
spanning sentence boundaries:
POOR PRECISION
Robust system to
tackle false positives
in inter-sentential RE
Need](https://image.slidesharecdn.com/neuralnlpmodelsofinformationextraction-190329170024/75/Neural-NLP-Models-of-Information-Extraction-21-2048.jpg)
![Unrestricted © Siemens AG 2019
January 2019Page 25 Machine Intelligence / Siemens AI Lab
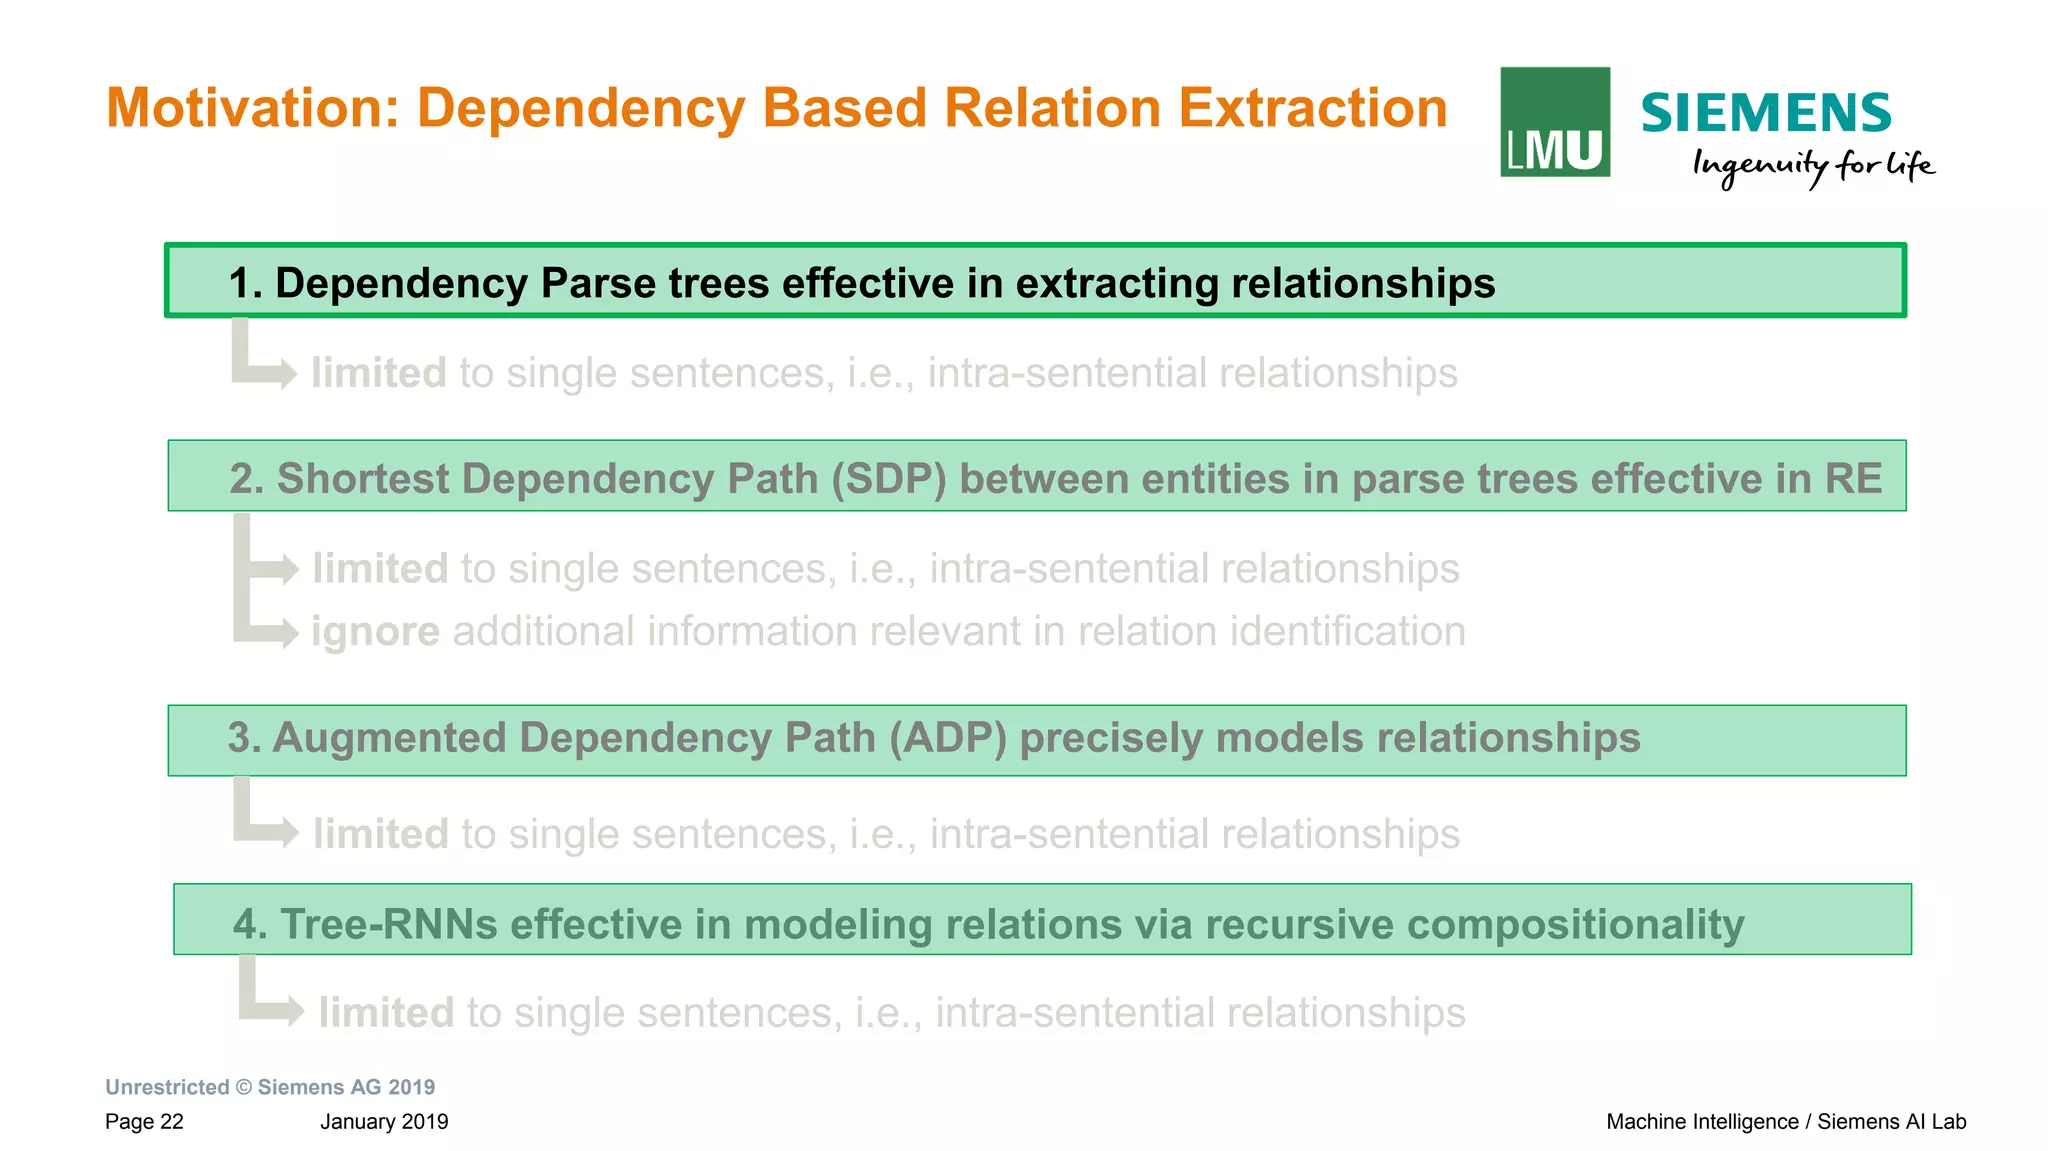
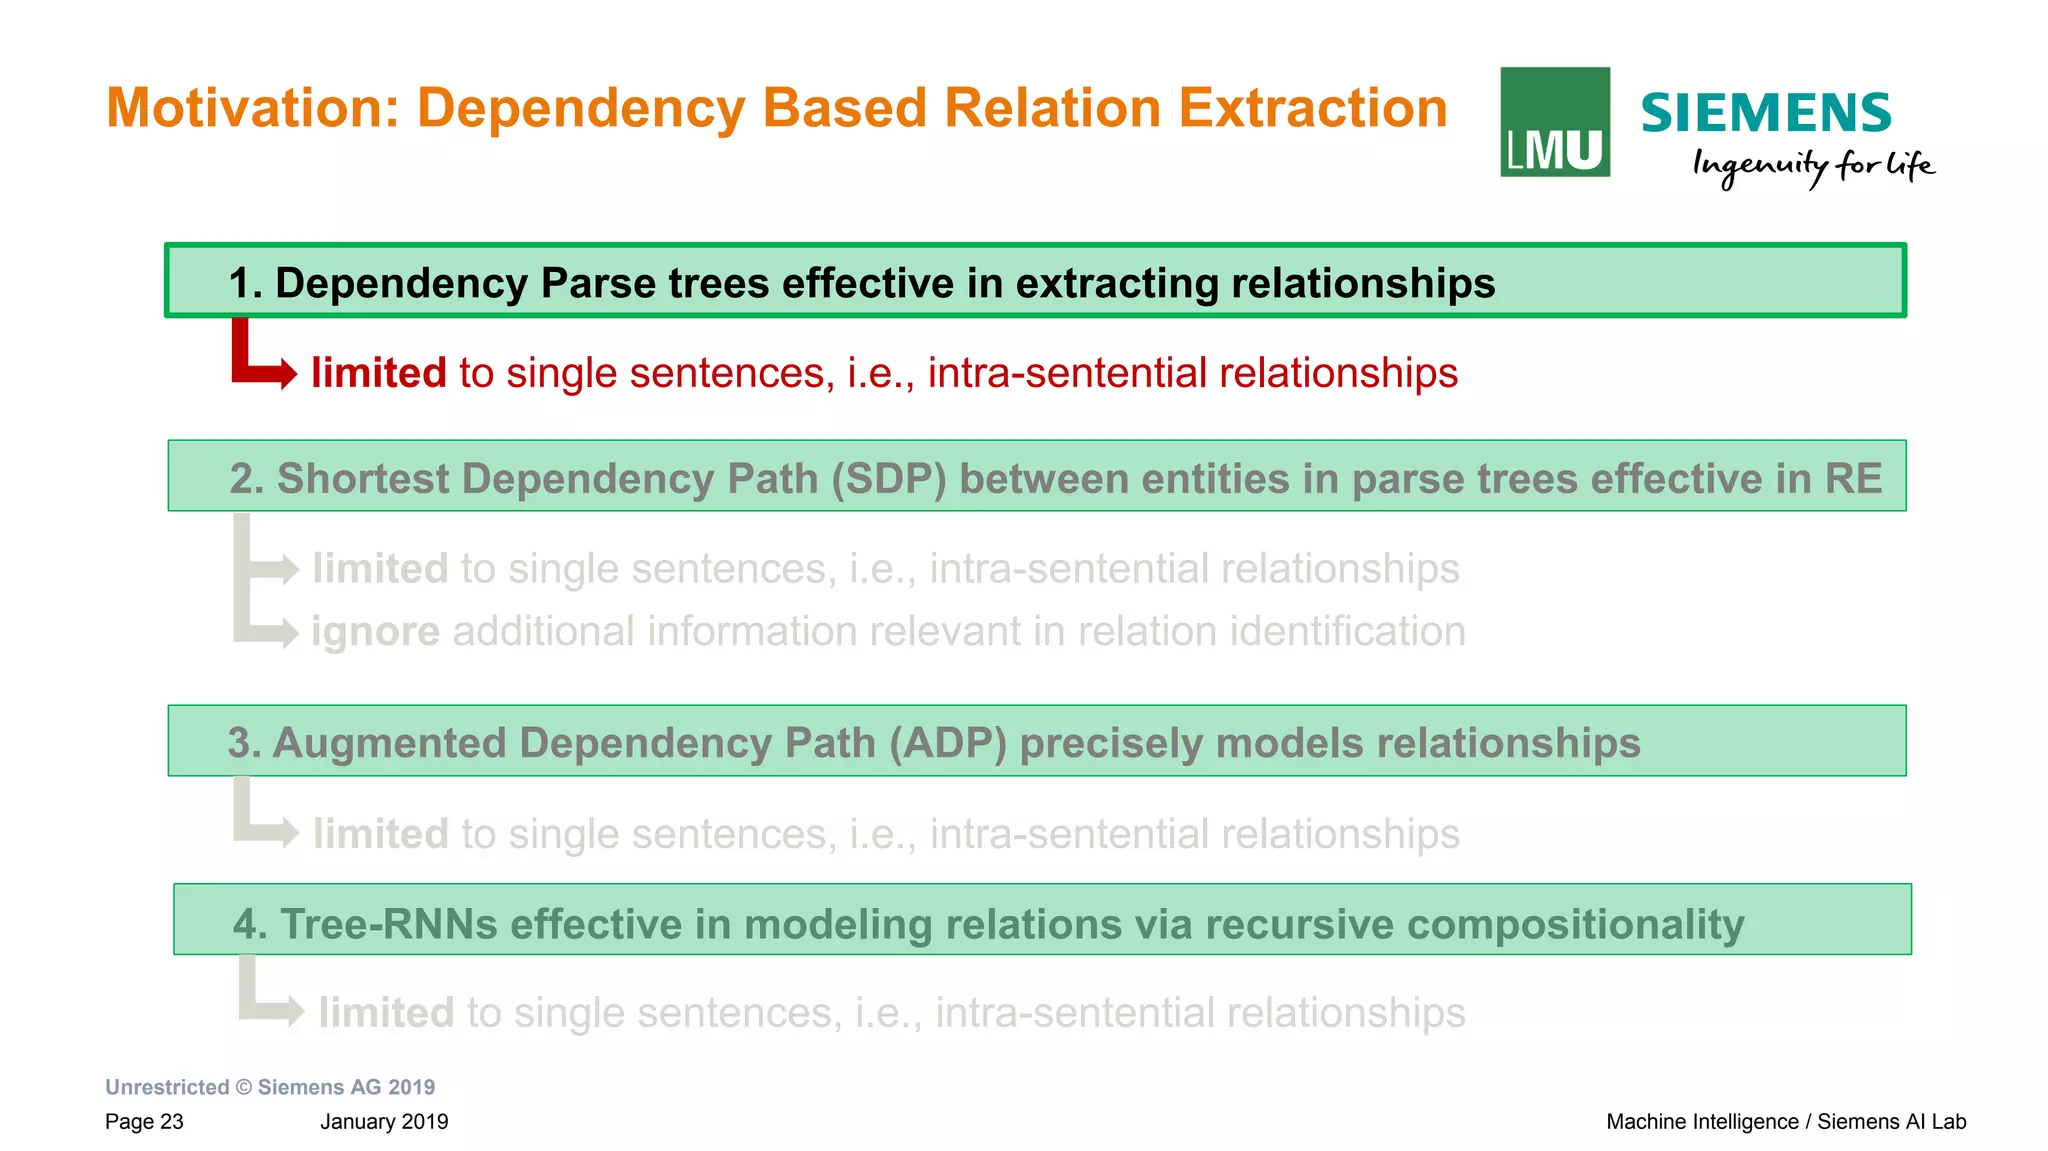
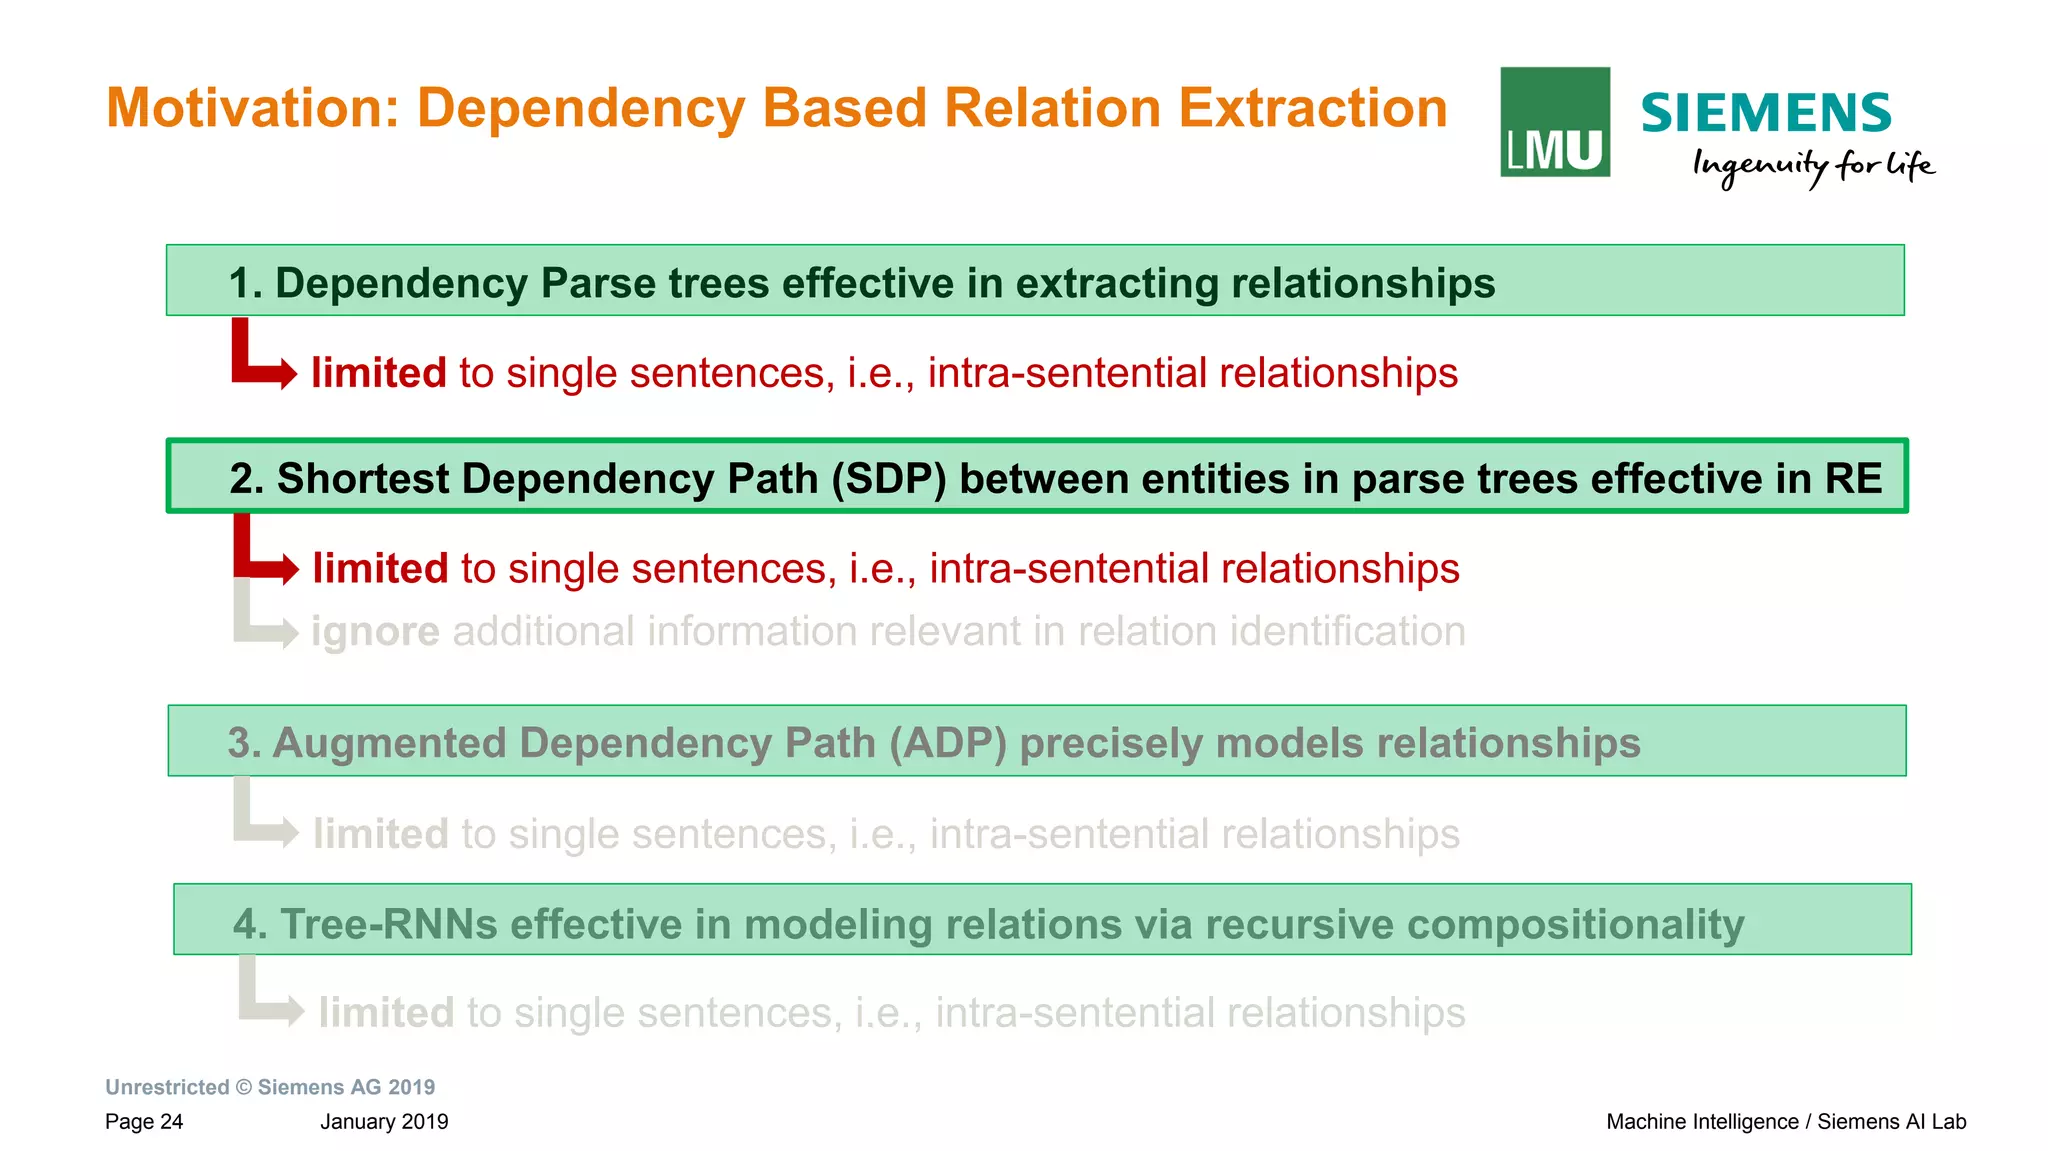
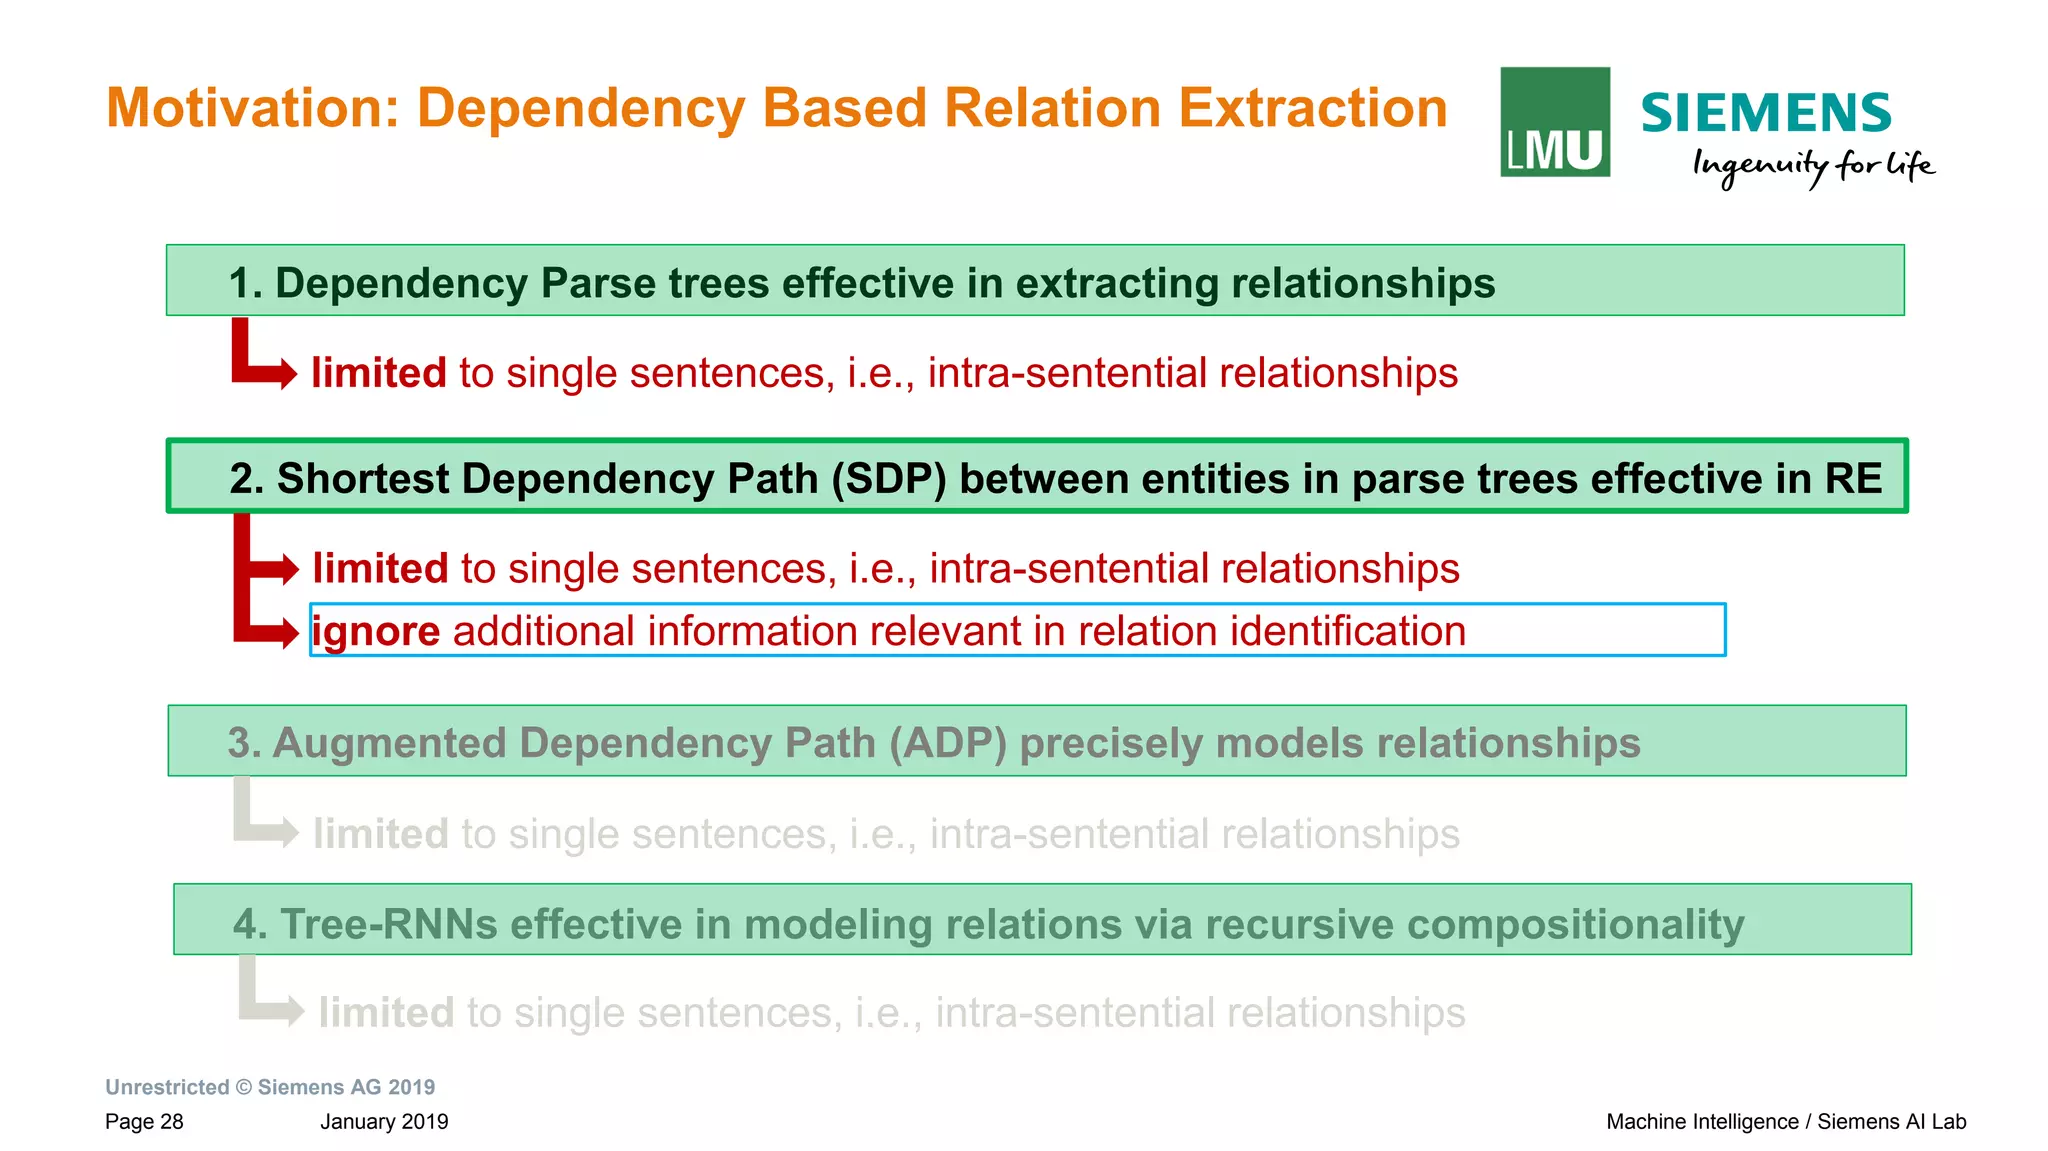
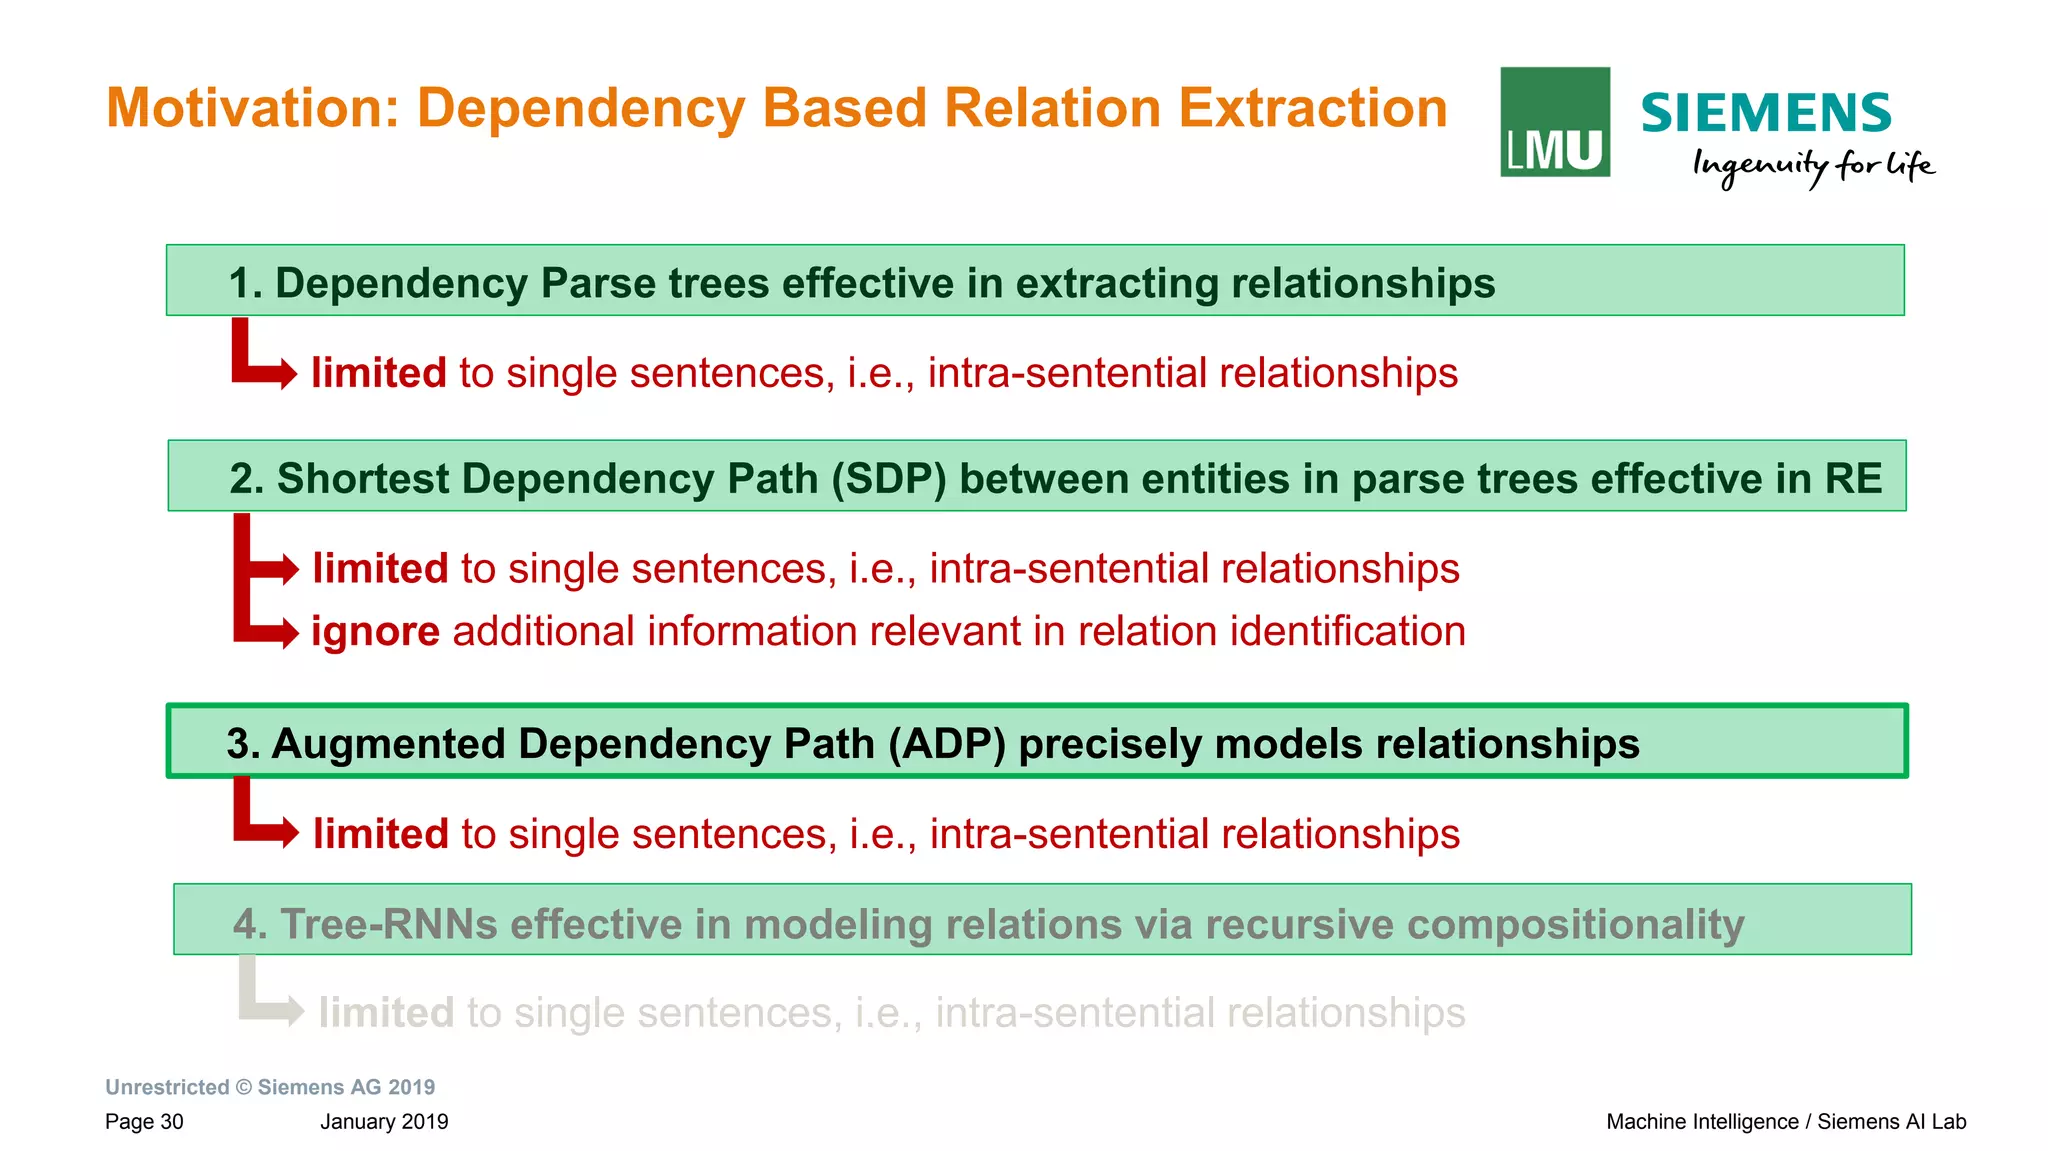
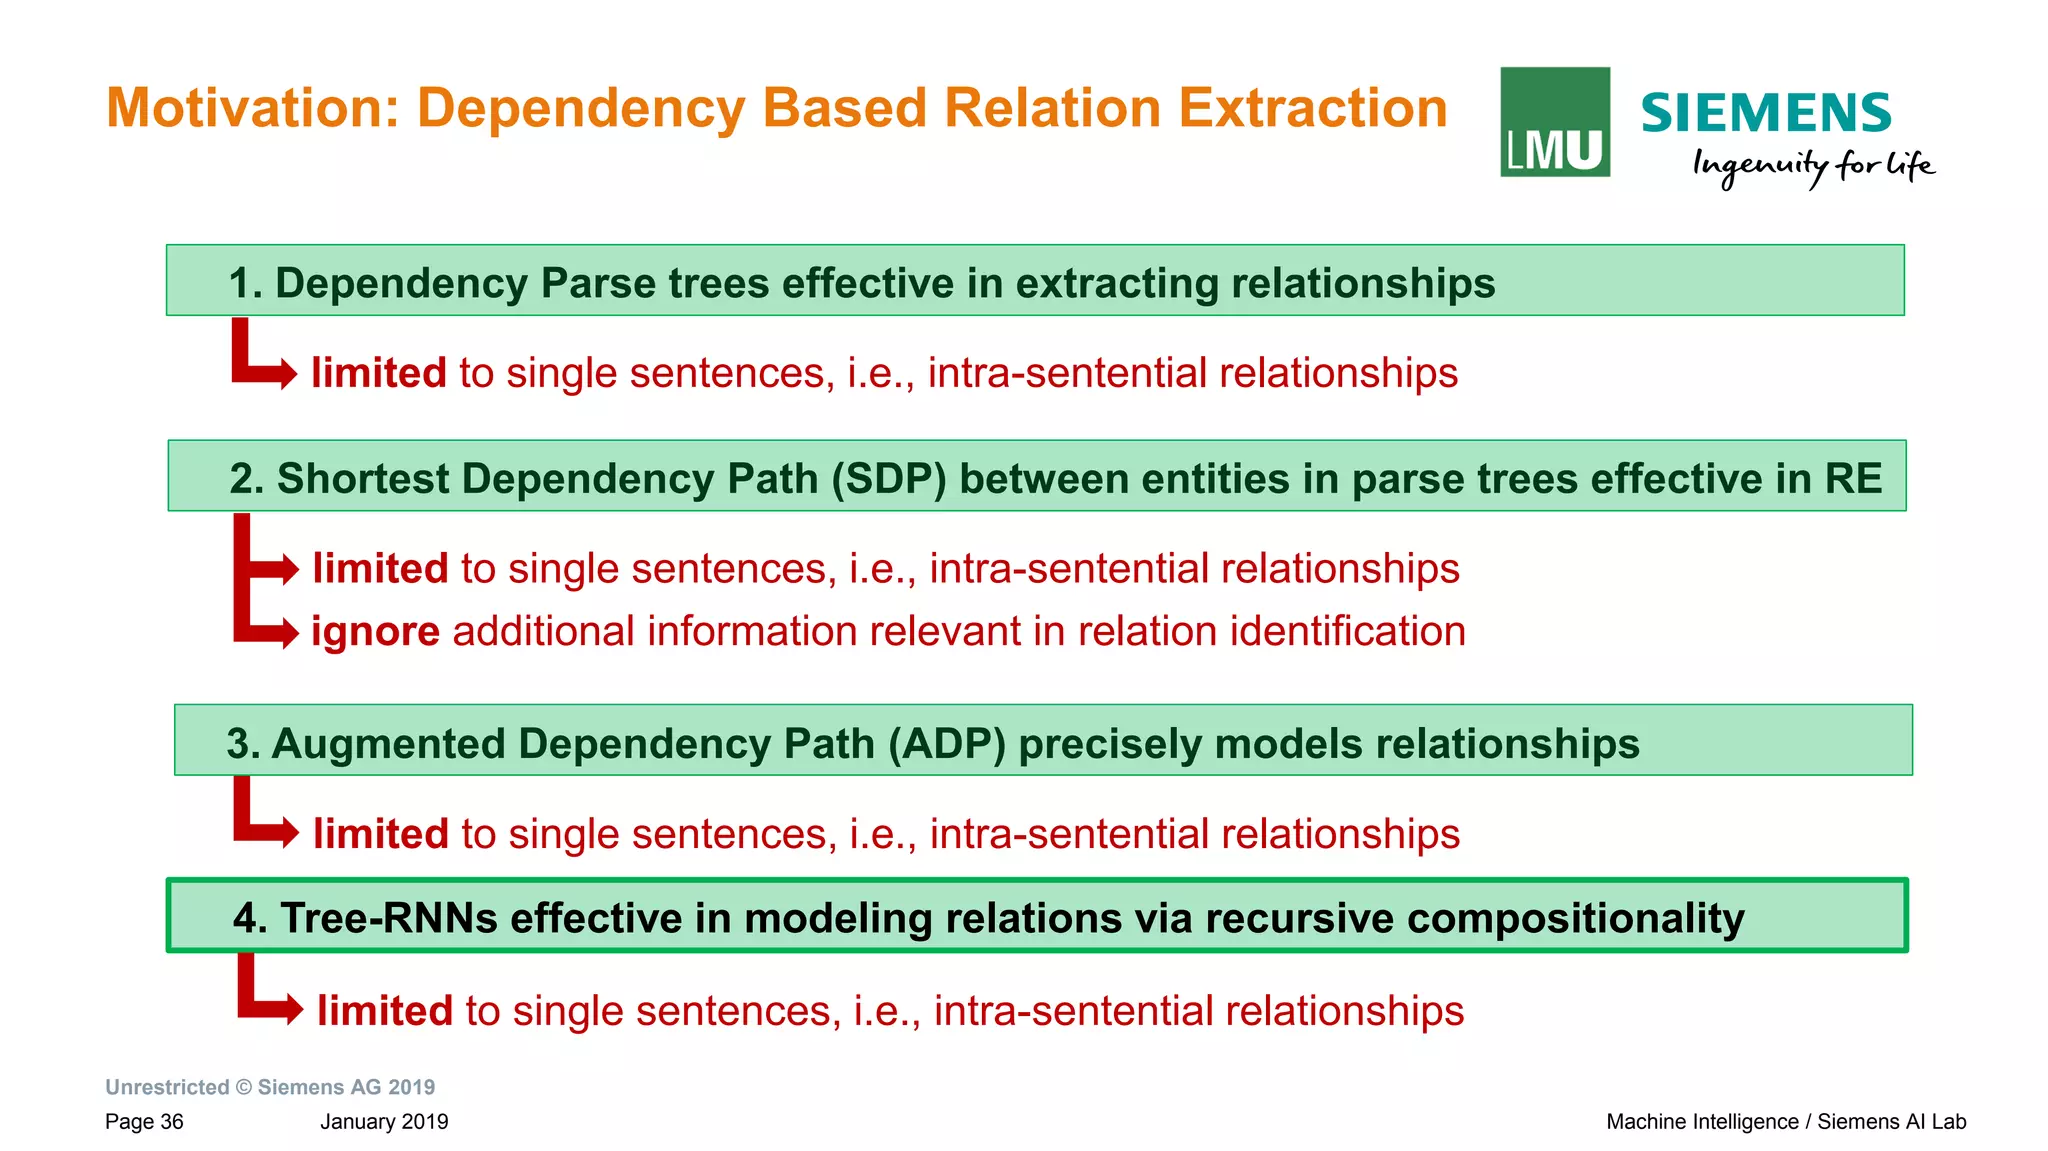
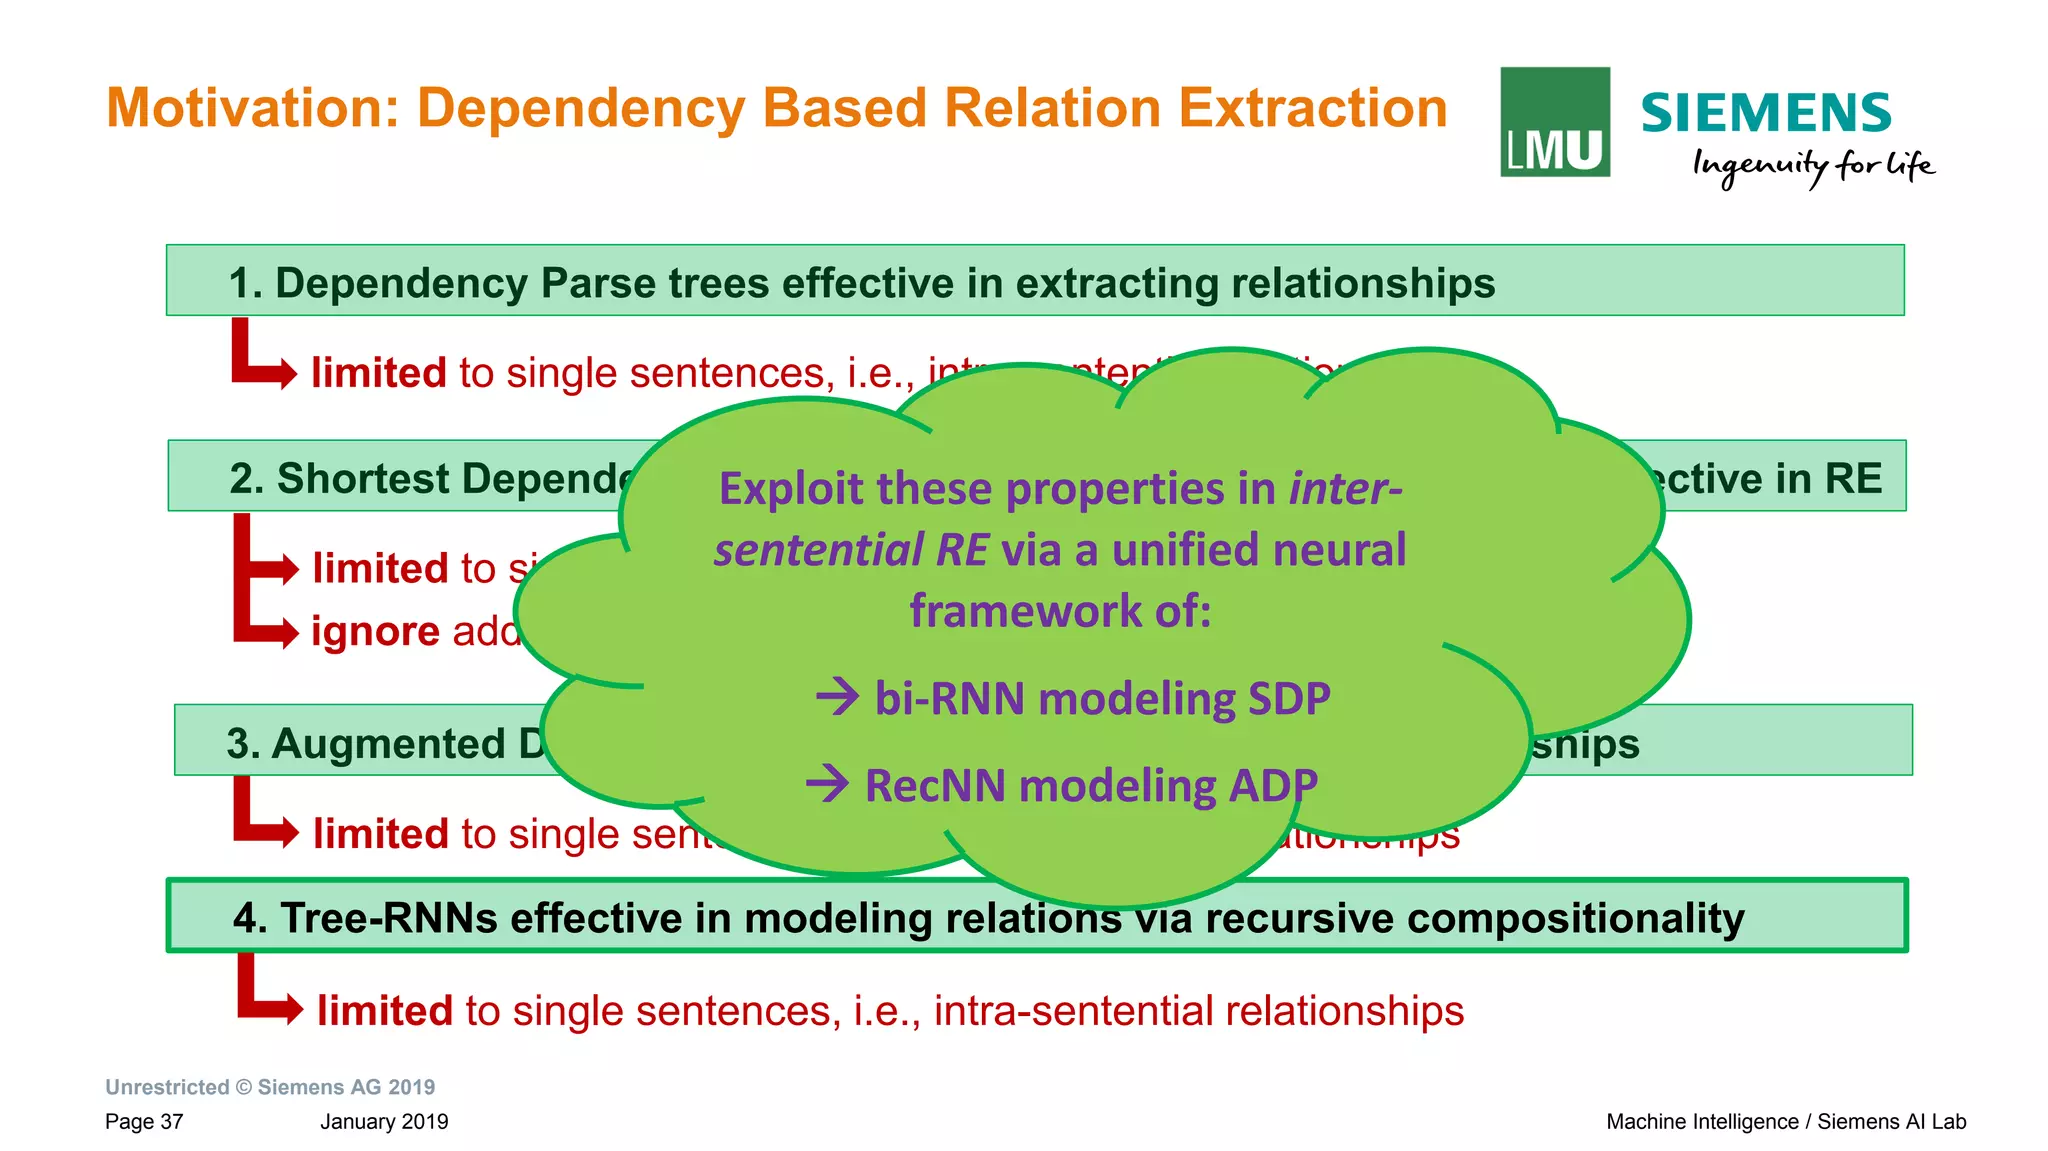
Motivation: Dependency Based Relation Extraction
Sentences and their dependency graphs
Paul Allen has started a company and named [Vern Raburn]e1 its president. The
company, to be called [Paul Allen Group] e2 will be based in Bellevue, Washington.
Shortest Dependency Path (SDP)
between root to entity e1](https://image.slidesharecdn.com/neuralnlpmodelsofinformationextraction-190329170024/75/Neural-NLP-Models-of-Information-Extraction-25-2048.jpg)
![Unrestricted © Siemens AG 2019
January 2019Page 26 Machine Intelligence / Siemens AI Lab
Motivation: Dependency Based Relation Extraction
Sentences and their dependency graphs
Paul Allen has started a company and named [Vern Raburn]e1 its president. The
company, to be called [Paul Allen Group] e2 will be based in Bellevue, Washington.
Shortest Dependency Path (SDP)
between root to entity e2](https://image.slidesharecdn.com/neuralnlpmodelsofinformationextraction-190329170024/75/Neural-NLP-Models-of-Information-Extraction-26-2048.jpg)
![Unrestricted © Siemens AG 2019
January 2019Page 27 Machine Intelligence / Siemens AI Lab
Motivation: Dependency Based Relation Extraction
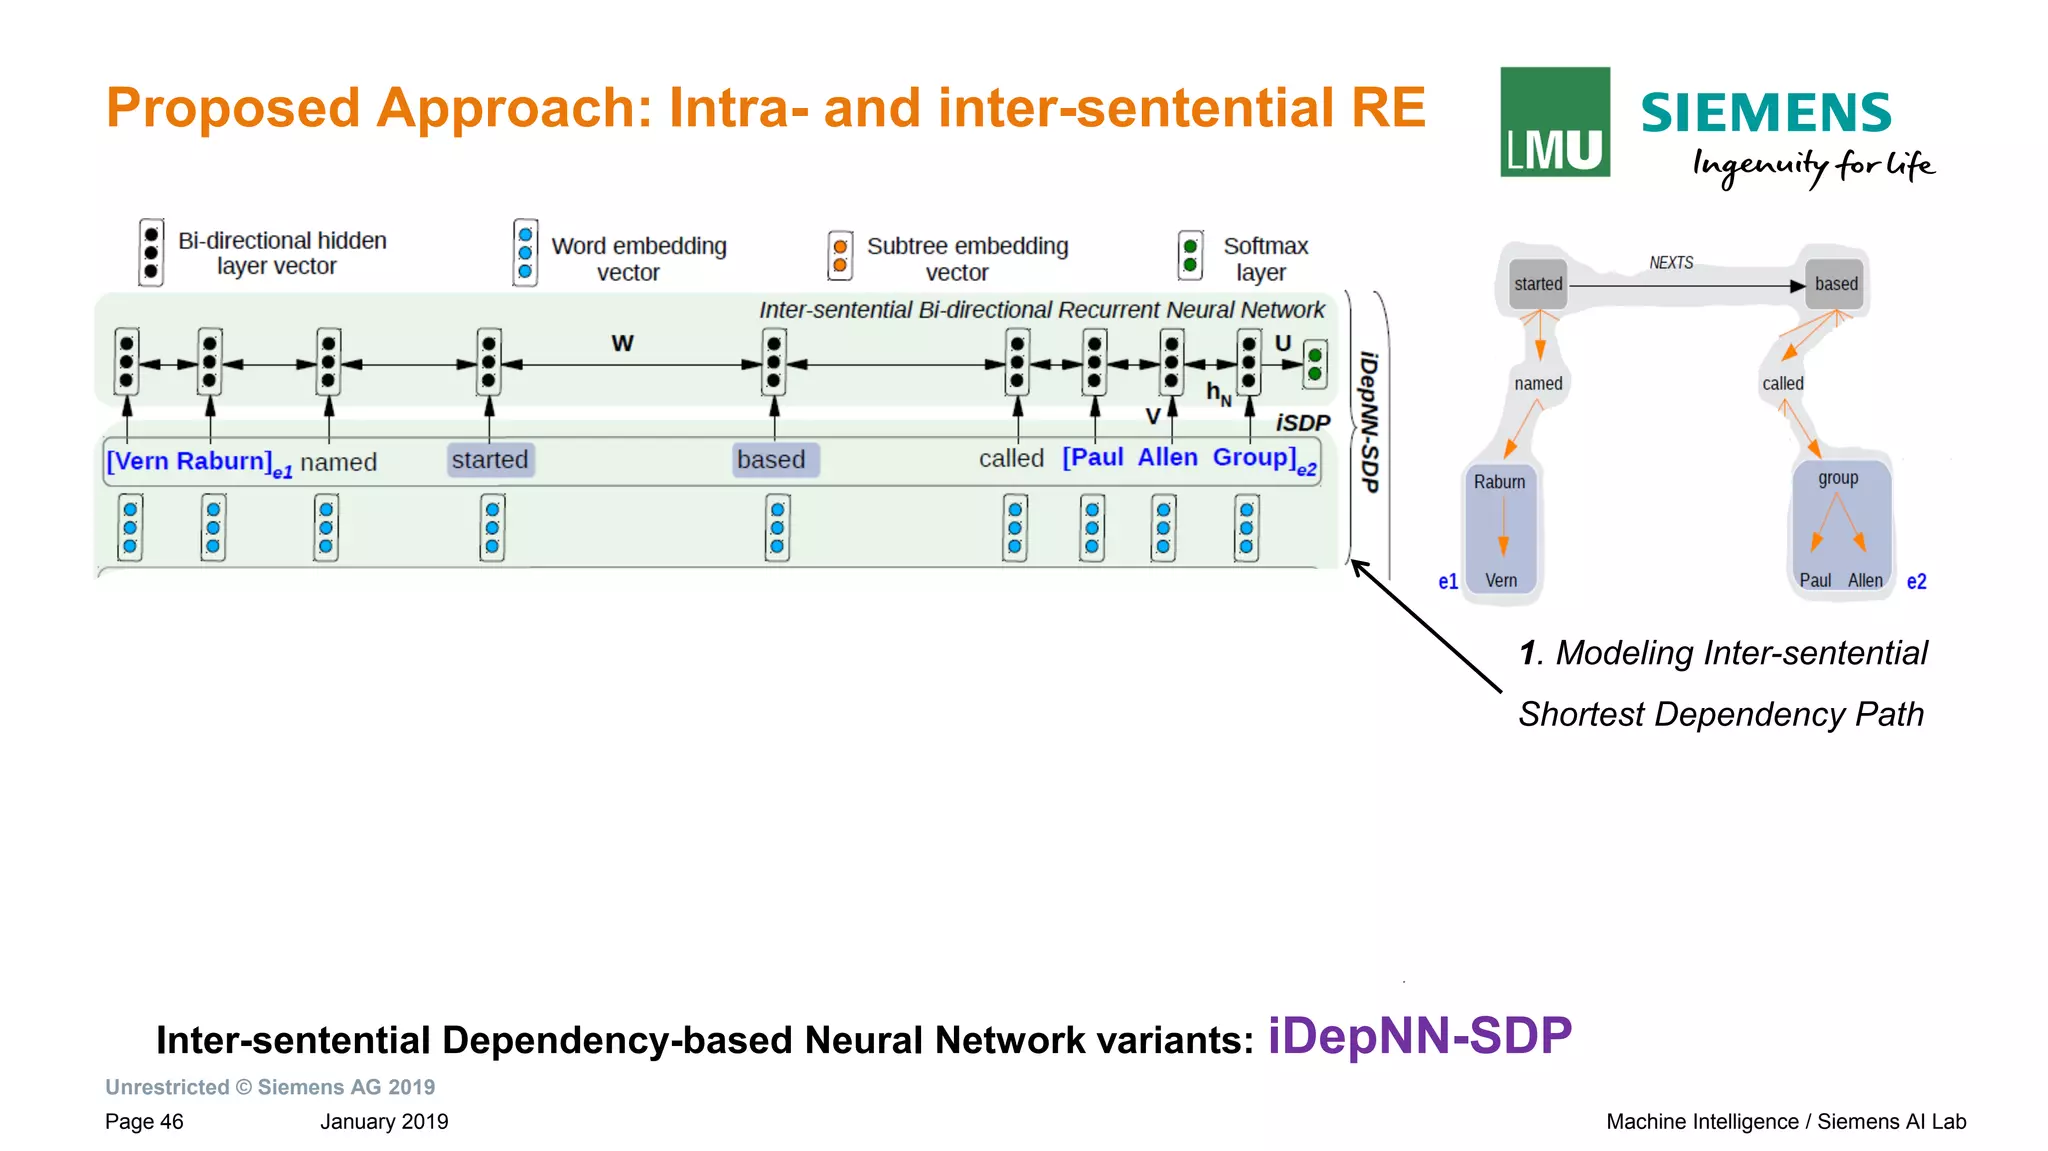
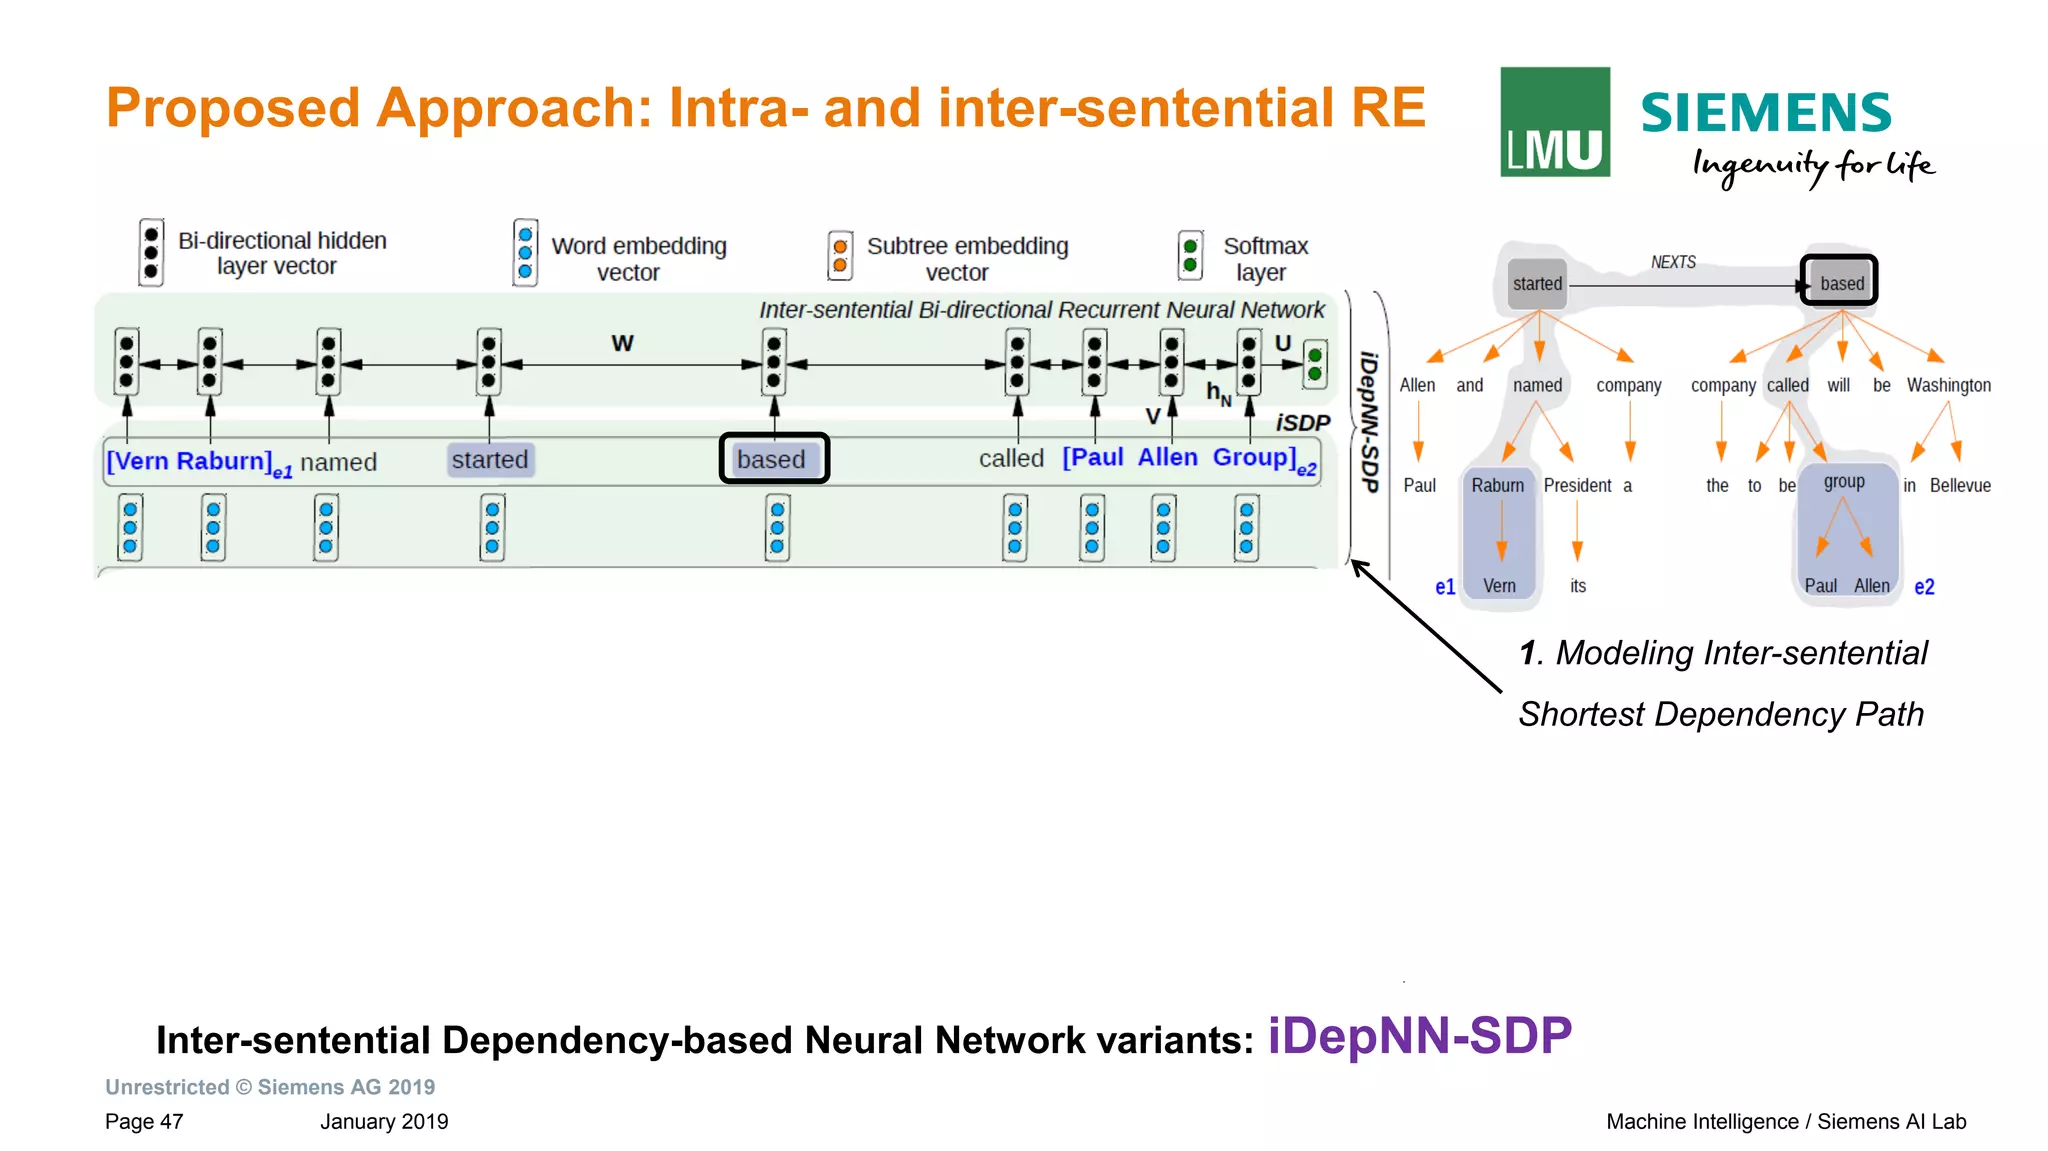
Sentences and their dependency graphs Inter-sentential Shortest Dependency Path
(iSDP) across sentence boundary.
Paul Allen has started a company and named [Vern Raburn]e1 its president. The
company, to be called [Paul Allen Group] e2 will be based in Bellevue, Washington.
iSDP
→ Connection between the roots of adjacent sentences by NEXTS](https://image.slidesharecdn.com/neuralnlpmodelsofinformationextraction-190329170024/75/Neural-NLP-Models-of-Information-Extraction-27-2048.jpg)
![Unrestricted © Siemens AG 2019
January 2019Page 29 Machine Intelligence / Siemens AI Lab
Motivation: Dependency Based Relation Extraction
Sentences and their dependency graphs Inter-sentential Shortest Dependency Path
(iSDP) across sentence boundary.
Paul Allen has started a company and named [Vern Raburn]e1 its president. The
company, to be called [Paul Allen Group] e2 will be based in Bellevue, Washington.
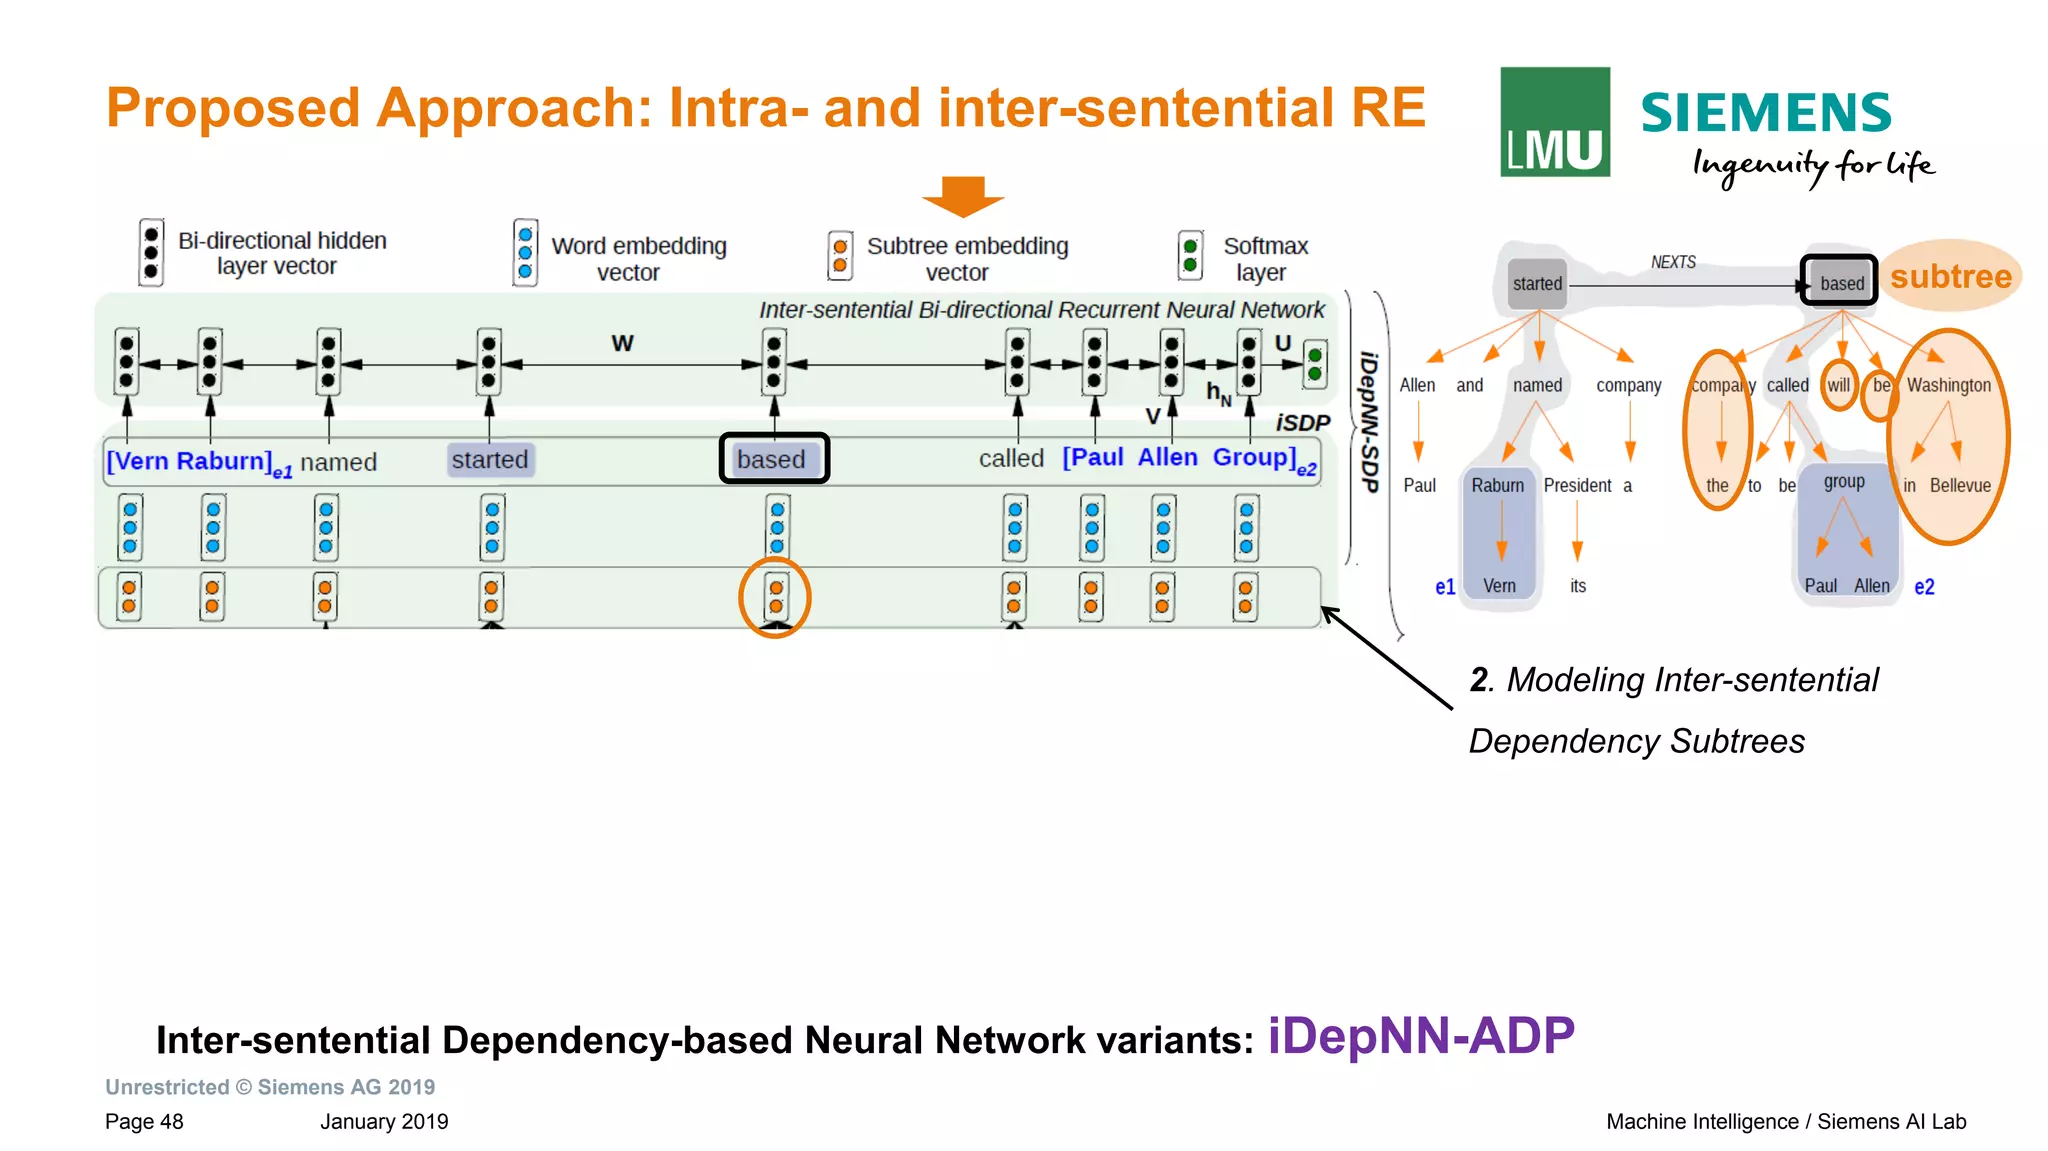
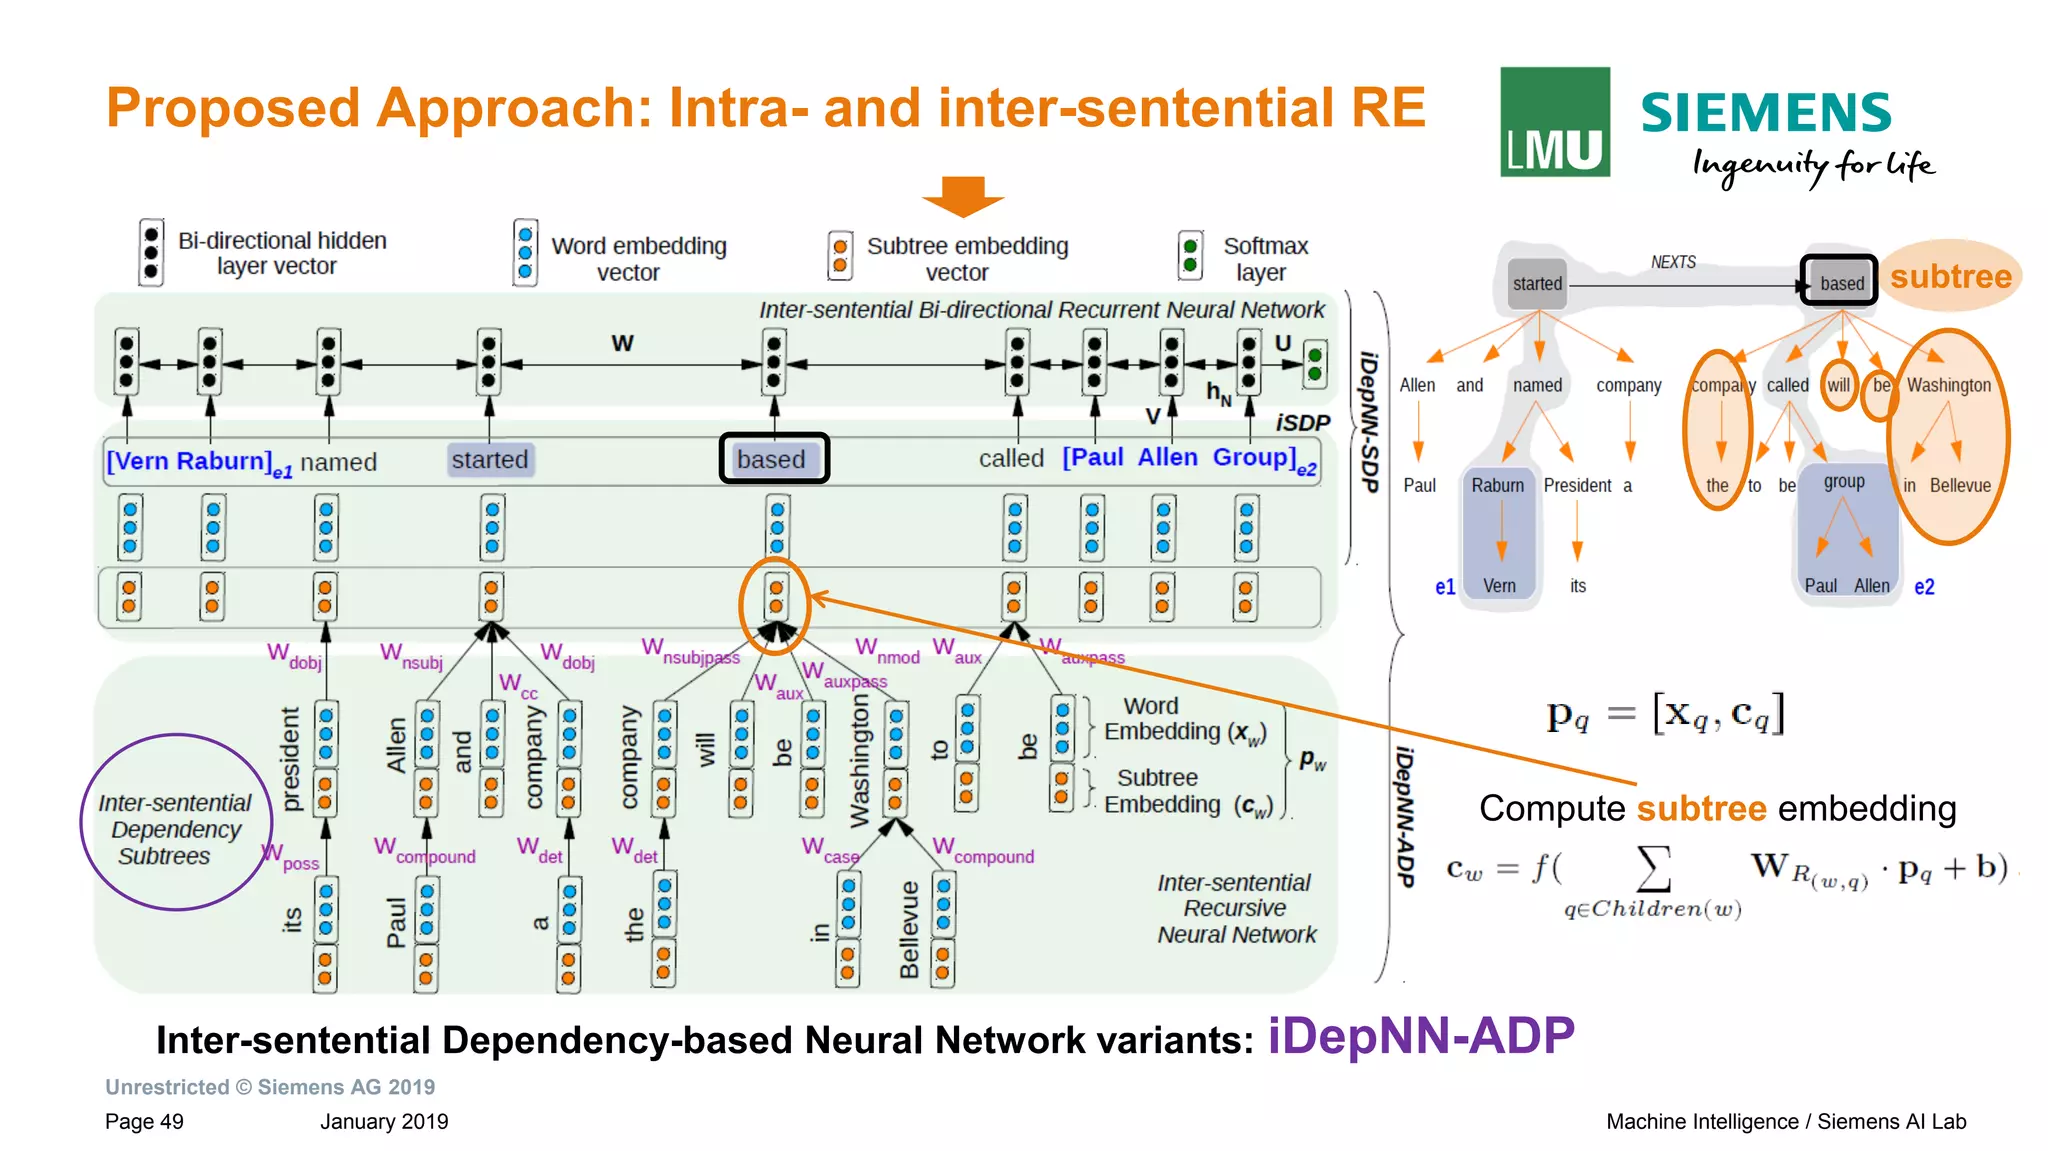
subtreeiSDP
→ Connection between the roots of adjacent sentences by NEXTS](https://image.slidesharecdn.com/neuralnlpmodelsofinformationextraction-190329170024/75/Neural-NLP-Models-of-Information-Extraction-29-2048.jpg)
![Unrestricted © Siemens AG 2019
January 2019Page 31 Machine Intelligence / Siemens AI Lab
Motivation: Dependency Based Relation Extraction
Sentences and their dependency graphs Inter-sentential Shortest Dependency Path
(iSDP) across sentence boundary.
Paul Allen has started a company and named [Vern Raburn]e1 its president. The
company, to be called [Paul Allen Group] e2 will be based in Bellevue, Washington.
subtreeiSDP
→ Connection between the roots of adjacent sentences by NEXTS](https://image.slidesharecdn.com/neuralnlpmodelsofinformationextraction-190329170024/75/Neural-NLP-Models-of-Information-Extraction-31-2048.jpg)
![Unrestricted © Siemens AG 2019
January 2019Page 32 Machine Intelligence / Siemens AI Lab
Motivation: Dependency Based Relation Extraction
Sentences and their dependency graphs Inter-sentential Shortest Dependency Path
(iSDP) across sentence boundary.
Paul Allen has started a company and named [Vern Raburn]e1 its president. The
company, to be called [Paul Allen Group] e2 will be based in Bellevue, Washington.
subtreeiSDP
→ Connection between the roots of adjacent sentences by NEXTS](https://image.slidesharecdn.com/neuralnlpmodelsofinformationextraction-190329170024/75/Neural-NLP-Models-of-Information-Extraction-32-2048.jpg)
![Unrestricted © Siemens AG 2019
January 2019Page 33 Machine Intelligence / Siemens AI Lab
Motivation: Dependency Based Relation Extraction
Sentences and their dependency graphs Inter-sentential Shortest Dependency Path
(iSDP) across sentence boundary.
Paul Allen has started a company and named [Vern Raburn]e1 its president. The
company, to be called [Paul Allen Group] e2 will be based in Bellevue, Washington.
subtreeiSDP
→ Connection between the roots of adjacent sentences by NEXTS](https://image.slidesharecdn.com/neuralnlpmodelsofinformationextraction-190329170024/75/Neural-NLP-Models-of-Information-Extraction-33-2048.jpg)
![Unrestricted © Siemens AG 2019
January 2019Page 34 Machine Intelligence / Siemens AI Lab
Motivation: Dependency Based Relation Extraction
Sentences and their dependency graphs Inter-sentential Shortest Dependency Path
(iSDP) across sentence boundary.
Paul Allen has started a company and named [Vern Raburn]e1 its president. The
company, to be called [Paul Allen Group] e2 will be based in Bellevue, Washington.
subtreeiSDP
→ Connection between the roots of adjacent sentences by NEXTS](https://image.slidesharecdn.com/neuralnlpmodelsofinformationextraction-190329170024/75/Neural-NLP-Models-of-Information-Extraction-34-2048.jpg)
![Unrestricted © Siemens AG 2019
January 2019Page 35 Machine Intelligence / Siemens AI Lab
Motivation: Dependency Based Relation Extraction
Sentences and their dependency graphs Inter-sentential Shortest Dependency Path
(iSDP) across sentence boundary.
Paul Allen has started a company and named [Vern Raburn]e1 its president. The
company, to be called [Paul Allen Group] e2 will be based in Bellevue, Washington.
subtreeiSDP
→ Connection between the roots of adjacent sentences by NEXTS](https://image.slidesharecdn.com/neuralnlpmodelsofinformationextraction-190329170024/75/Neural-NLP-Models-of-Information-Extraction-35-2048.jpg)


![[DSC Europe 25] Ivan Peric - Intelligence Swarm Logic and Techno-Functional M...](https://cdn.slidesharecdn.com/ss_thumbnails/7my7c97fsduiccadgavw-2-251212103249-5a03f7c6-thumbnail.jpg?width=640&height=640&fit=bounds)
![[DSC Europe 25] Miodrag Pesovic & Vladislav Radonjic - Federated Data Archite...](https://cdn.slidesharecdn.com/ss_thumbnails/gsbe3y5it5uhndi4e08e-1-251212103249-f1008e0c-thumbnail.jpg?width=640&height=640&fit=bounds)
![[DSC Europe 25] Behzad Hosseini - AI Agents in the Wild: Deploying Models tha...](https://cdn.slidesharecdn.com/ss_thumbnails/3qtejajvsjqrzwfept2c-10-251212103250-7f2b1068-thumbnail.jpg?width=640&height=640&fit=bounds)


![[DSC Europe 25] Uros Pesic - The Reality of AI in Marketing.pdf](https://cdn.slidesharecdn.com/ss_thumbnails/rtkodnmtycovsllvzsyn-9-251215095918-b0c6bfe3-thumbnail.jpg?width=640&height=640&fit=bounds)
![[DSC Europe 25] Danica Soc - The Science Behind Marketing: Experimentation me...](https://cdn.slidesharecdn.com/ss_thumbnails/c0nofsggs9gw5ucmallr-3-251216103155-56bd64d1-thumbnail.jpg?width=640&height=640&fit=bounds)

![[DSC Europe 25] Branko Urosevic -Rethinking Financial Talent: Integrating Cod...](https://cdn.slidesharecdn.com/ss_thumbnails/8jjrus8ttko6qj64f58f-3-251212103250-642c6374-thumbnail.jpg?width=640&height=640&fit=bounds)
![[DSC Europe 25] Jon Dajci - Bridging TradFi and DeFi: Building the Future of ...](https://cdn.slidesharecdn.com/ss_thumbnails/fqmhfvlbqhkihjvqvhmu-7-251211083849-6af7e325-thumbnail.jpg?width=640&height=640&fit=bounds)

![[DSC Europe 25] Dusan Nesic - Securing Tomorrow’s Infrastructure: Why Cyber-P...](https://cdn.slidesharecdn.com/ss_thumbnails/qikbszfftyowjm2q6duw-1-251211083848-8f2ead6b-thumbnail.jpg?width=640&height=640&fit=bounds)


