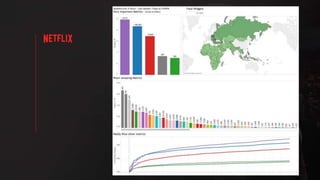
How “Stranger Things” can
happen with Visual
Analytics
Jason Flittner
Senior Analytics Engineer / Manager
Netflix - Content Data Engineering and Analytics
#NetflixData
● About Netflix
● Tableau + Big Data
○ Lessons Learned
○ Where we are today
● Analytics and Iterating Quickly
What is Netflix?
● 93+ million members
● 190 countries
● 1,000+ devices
● 10B hours/qtr
We plan on spending ~$6B in 2017 on
content for our members
Metrics
● ~60 PB DW on S3
● ~1400 Tableau users
● Live & extract connections
● Analytics on billions of rows
(Hadoop
clusters)
Storage Compute Data Interface Data Access, Analytics and Visualization
AWS
S3
● About Netflix
● Tableau + Big Data
○ Lessons Learned
○ Where we are today
● Analytics and Iterating Quickly
Choosing a source
● Hive
● Spark
● Presto
● Redshift
● Published Data Source
● etc...
● Powerful and scalable
backend
● “Slower” 1,000,000,000/hr
● Hive + Tableau
○ Thrift Servers
○ Custom SQL vs Tables
○ Metadata
○ ODBC Optimization
● Scalable
● Faster than Hive in many
cases
● Spark + Tableau
○ Thrift Servers
○ Long running job on
Cluster
○ Query reliability
● Fast query engine
● Great for experimenting and
“smaller” data sets
● Connecting to Tableau
○ Web data connector
○ ODBC
● About Netflix
● Tableau + Big Data
○ Lessons Learned
○ Where we are today
● Analytics and Iterating Quickly
Tableau Data
Extract Publish to Server
Tableau Extract
API
Create Tableau Data ExtractProvision Container ResourceIssues Command Create
Extract
Publish to Server
Distributed Tableau Extract API
● Very fast loads from S3
● Native Tableau connector
● Quick Tableau Iteration
● Live or Extract
● Concurrency
Amazon
Redshift
BIG Data ● Too big to extract?
● Optimized live connections
○ SQL
● Custom data viz with Druid
● Tableau + Hyper!?
● About Netflix
● Tableau + Big Data
○ Lessons Learned
○ Where we are today
● Analytics and Iterating Quickly
Business
users
Analytics
Engineer
Analytics:
● Binge Analysis
● Viewing Patterns
● Hours Viewed
● Customer Joy
● Content Quality
Bringing it all
together
● Content analytics
● Iterate quickly
● Move between backend sources
● Strong user adoption
Merci
Thank you
Jason Flittner -

Netflix Big Data Paris 2017

  • 1.
    How “Stranger Things”can happen with Visual Analytics Jason Flittner Senior Analytics Engineer / Manager Netflix - Content Data Engineering and Analytics #NetflixData
  • 2.
    ● About Netflix ●Tableau + Big Data ○ Lessons Learned ○ Where we are today ● Analytics and Iterating Quickly
  • 3.
  • 6.
    ● 93+ millionmembers ● 190 countries ● 1,000+ devices ● 10B hours/qtr We plan on spending ~$6B in 2017 on content for our members Metrics
  • 7.
    ● ~60 PBDW on S3 ● ~1400 Tableau users ● Live & extract connections ● Analytics on billions of rows
  • 8.
    (Hadoop clusters) Storage Compute DataInterface Data Access, Analytics and Visualization AWS S3
  • 9.
    ● About Netflix ●Tableau + Big Data ○ Lessons Learned ○ Where we are today ● Analytics and Iterating Quickly
  • 10.
    Choosing a source ●Hive ● Spark ● Presto ● Redshift ● Published Data Source ● etc...
  • 11.
    ● Powerful andscalable backend ● “Slower” 1,000,000,000/hr ● Hive + Tableau ○ Thrift Servers ○ Custom SQL vs Tables ○ Metadata ○ ODBC Optimization
  • 12.
    ● Scalable ● Fasterthan Hive in many cases ● Spark + Tableau ○ Thrift Servers ○ Long running job on Cluster ○ Query reliability
  • 13.
    ● Fast queryengine ● Great for experimenting and “smaller” data sets ● Connecting to Tableau ○ Web data connector ○ ODBC
  • 14.
    ● About Netflix ●Tableau + Big Data ○ Lessons Learned ○ Where we are today ● Analytics and Iterating Quickly
  • 15.
    Tableau Data Extract Publishto Server Tableau Extract API
  • 16.
    Create Tableau DataExtractProvision Container ResourceIssues Command Create Extract Publish to Server Distributed Tableau Extract API
  • 17.
    ● Very fastloads from S3 ● Native Tableau connector ● Quick Tableau Iteration ● Live or Extract ● Concurrency Amazon Redshift
  • 18.
    BIG Data ●Too big to extract? ● Optimized live connections ○ SQL ● Custom data viz with Druid ● Tableau + Hyper!?
  • 19.
    ● About Netflix ●Tableau + Big Data ○ Lessons Learned ○ Where we are today ● Analytics and Iterating Quickly
  • 20.
    Business users Analytics Engineer Analytics: ● Binge Analysis ●Viewing Patterns ● Hours Viewed ● Customer Joy ● Content Quality
  • 21.
    Bringing it all together ●Content analytics ● Iterate quickly ● Move between backend sources ● Strong user adoption
  • 25.