SlideShare a Scribd company logo
1 of 66
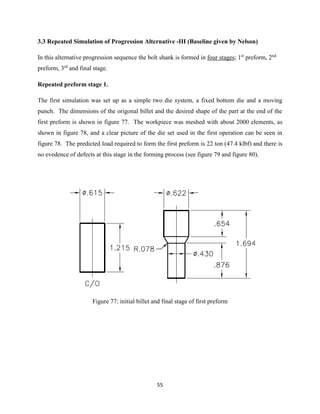
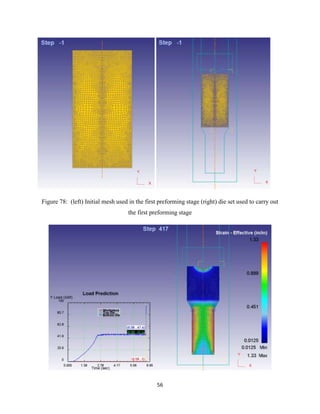
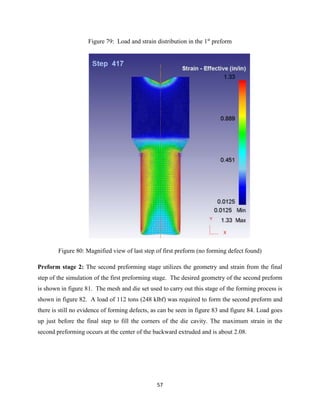
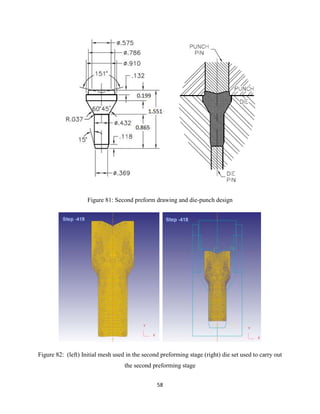
Download to read offline
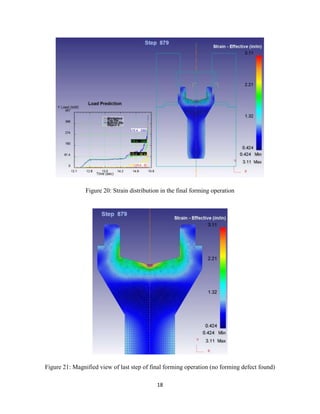
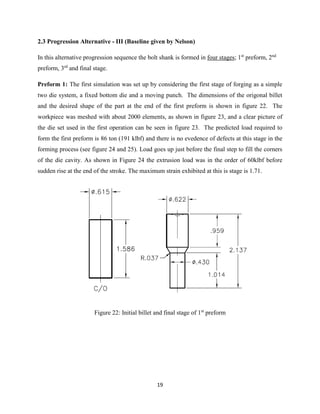
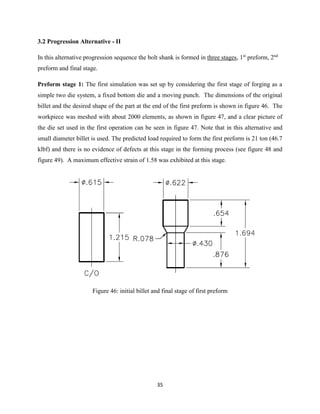
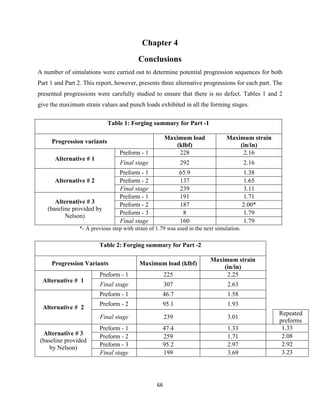
1
Report Number: F/MAE/NG/2015-3
Forging Progression Sequence Development for Bolt Shank
Submitted to
Nelson Stud Welding
By
Fnu Aktaruzzaman – Research Assistant
James Lowrie – Research Assistant
Gracious Ngaile – Associate Professor
North Carolina State University
Department of Mechanical & Aerospace Engineering
Advanced Metal Forming and Tribology Laboratory (AMTL)
December 5, 2015
Confidential Report
2
Foreword
This document has been prepared by the Advanced Metal Forming and Tribology Laboratory in
the Department of Mechanical and Aerospace Engineering at North Carolina State University.
The research focus of this Lab includes manufacturing process modeling and optimization,
triboscience and tribotechnology, tool design, and computational tools. In addition to conducting
industry relevant engineering research, the Lab has the objectives a) establish close cooperation
between industry and the university, b) train students, and c) transfer the research results to
interested companies.
This report, entitled “Forging Progression Sequence Development for Bolt Shank”, presents FE
simulation results for several alternative progression sequences.
For further information, contact Dr. Gracious Ngaile, located at North Carolina State University,
Department of Mechanical & Aerospace Engineering, 911 Oval Drive – 3160 Engineering
Building III, BOX 7910, Raleigh, NC, 27695-7910, phone: 919-515-5222,
email:gracious_ngaile@ncsu.edu, webpage:http://www.mae.ncsu.edu/ngaile.
3
Table of Contents
Foreword …………………………………………….…...2
Table of contents …………………………………………………3
Chapter 1: Introduction …………………………………………………4
1.0 Introduction ………………………………………………....4
1.1 Objectives …………………………………………………5
1.2 Approach …………………………………………………5
1.3 Finite Element Setups ………………………………………………....6
Chapter 2: Forging Progression Alternatives for Part# 1…………………………7
2.1 Progression Alternative – I …………………………………………………7
2.2 Progression Alternative – II …………………………………………………11
2.3 Progression Alternative –III ………………………………………………....18
Chapter 3: Forging Progression Alternatives for Part# 2…………………………28
3.1 Progression Alternative – I …………………………………………………28
3.2 Progression Alternative – II …………………………………………………34
3.3 Progression Alternative – III …………………………………………………41
3.4 Repeated Simulation of Progression Alternative -III ……………………………..54
Chapter 4: Conclusions …………………………………………………51
4
Chapter 1
Introduction
1. Introduction
Nelson stud welding plans to produce bolt shank shown in Figures 1 and 2 by forging. Due to
complex flow of material, these parts can only be produced in several stages. NCSU was asked
to determine potential progression sequences and study material flow using the finite element
method. Conventional forging techniques for forward-backward extrusion of similar parts have
shown to produce folding defects. Thus, in the course of developing progression sequences,
emphasis was given to material follow modes, strain induced, fold formation, under fill and other
defects.
Figure1: Dimensional details of Part-1
5
Figure2: Dimensional details of Part-2
1.1 Objectives
(a) Conduct finite element analysis of the baseline progression provided by Nelson. Reproduce
fold defect that has been encountered in industry when forming these parts. (Reported in
progress report). (b) Establish potential alternative forging sequence for Part 1 and Part 2 that
lead to sound product.
1.2 Approach
Preform design methodology based on geometric resemblance developed at NCSU was used to
narrow down potential progression sequences. Finite element software DEFORM was used in
the study. The baseline progression provided by Nelson was used as a starting point to develop
alternative progression sequences. Before looking for other progression alternatives, fold defect
had to be reproduced by simulating the baseline sequence.
6
1. 3 Finite Element Model Setups
The simulations were carried out using 2D DEFORM software package. The following
assumptions were made to facilitate the solution process.
 The process can be considered a quasi-static problem (No kinetic effects)
 The process is not strain rate dependent because it is a cold forging process (rigid-plasic
material)
 AISI 4140 was used in the simulations
 The dies used in the process do not deform
 All preform and final form shapes are rotationally symmetric about their center axis
 Friction between the dies and workpiece was approximated by a constant shear friction
factor of 0.12
A number of simulations were carried out. This report, however, presents three different
alternatives for each part. The alternative progressions for Part 1 are presented in Chapter 2 and
altenative progressions for Part 2 are presented in Chapter 3.
7
Chapter 2
Forging Progression Alternatives for Part # 1
2.1 Progression Alternative – I
In this alternative progression sequence the bolt shank is formed in two stages, one preform stage
and final stage.
Preform stage: The first simulation was set up by considering the first stage of forging as a
simple two die system, a fixed bottom die and a moving punch. The dimensions of the original
billet and the desired shape of the part at the end of the first preform is shown in figure 3. The
workpiece was meshed with about 2000 elements, as shown in figure 4, and a clear picture of the
die set used in the first operation can be seen in figure 5. The predicted load required to form the
first preform is 103 ton (228 klbf) and there is no evidence of defects at this stage in the forming
process (see figure 5 and figure 6). Load goes up just before the final step to fill the corners of
the die cavity.
Figure 3: Initial billet and the preform dimensions
8
Figure 4: (left) Initial mesh used in the first preforming stage (right) die set used to carry out the
first preforming stage
Figure 5: Strain distribution of the 127th
step of first preforming
9
Figure 6: Magnified view of final step of first preforming (no forming defect found)
Final forming stage: The final stage of the previous simulation is used as the starting point for
this simulation. The mesh and dies used in the final stage are shown in figure 8. According to
the simulation, it takes 132 tons (292 klbf) to form the part. Load goes up just before the final
step to fill the corners of the die cavity. A seen in figure 9 and figure 10, there is no evidence of a
forming defect. The maximum strain induced in the final stage is 2.16 and occurs around the
edge of the bottom surface of the part and the top backward extruded cup.
10
Figure 7: Final forming drawing
Figure 8: (left) Initial mesh used in the final stage (right) die set used to carry out the final
forming operation
11
Figure 9: Strain distribution of the 190th
step of final forming
Figure 10: Magnified view of final step of final forming (no forming defect found)
12
2.2 Progression Alternative- II
In this alternative progression sequence the bolt shank is formed in three stages; 1st
preform, 2nd
preform and final stage.
Preform stage 1: The first simulation was set up by considering the first stage of forging as a
simple two die system, a fixed bottom die and a moving punch. The dimensions of the original
billet and the desired shape of the part at the end of the first preform is shown in figure 11. Note
that in this alternative, the initial billet has a smaller diameter compared to the alternative 1. The
workpiece was meshed with about 2000 elements, as shown in figure 12, and a clear picture of
the die set used in the first operation can be seen in figure 12. The predicted load required to
form the first preform is 30 ton (65.9 klbf) and there is no evidence of defects at this stage in the
forming process (see figure 13 and figure 14). Load goes up just before the final step to fill the
corners of the die cavity.
Figure 11: Initial billet and 1st
preform dimensions
13
Figure 12: (left) Initial mesh used in the first preforming stage (right) die set used to carry out
the first preforming stage
Figure 13: Strain Distribution in the First Preform
14
Figure 14: Magnified view of last step of first preform (no forming defect found)
Preform stage 2: The second preforming stage utilizes the geometry and strain from the final
step of the simulation of the first preforming stage. The mesh and die set used to carry out this
stage of the forming process is shown in figure 15. A load of 62 tons (137klbf) was required to
form the second preform and there is still no evidence of forming defects, as can be seen in
figure 16 and figure 17. Load goes up just before the final step to fill the corners of the die cavity.
The maximum strain in the second preforming occurs at around the edge of the bottom surface of
the part and is about 1.65.
15
Figure 15: (left) Initial mesh used in the second preforming stage (right) die set used to carry out
the second preforming stage
Figure 16: Strain distribution in the second preform
16
Figure 17: Magnified view of last step of second preform (no forming defect found)
Final stage: The final stage of the previous simulation is used as the starting point for this
simulation. The mesh and dies used in the third preforming stage are shown in figure 19.
According to the simulation, it takes 108 tons (239 klbf) to carry out the final forming stage.
Load goes up just before the final step to fill the corners of the die cavity. As shown in figures 20
and 21, there is no evidence of a forming defect. The maximum strain in the final stage occurs at
around the edge of the bottom surface of the extruded cup and is about 3.11. This strain is rather
high for cold forming. However it is localized at the center of the cup.
17
Figure 18: Final forming drawing
Figure 19: (left) Initial mesh used in the second preforming stage (right) die set used to carry out
the final forming stage
18
Figure 20: Strain distribution in the final forming operation
Figure 21: Magnified view of last step of final forming operation (no forming defect found)
19
2.3 Progression Alternative - III (Baseline given by Nelson)
In this alternative progression sequence the bolt shank is formed in four stages; 1st
preform, 2nd
preform, 3rd
and final stage.
Preform 1: The first simulation was set up by considering the first stage of forging as a simple
two die system, a fixed bottom die and a moving punch. The dimensions of the origonal billet
and the desired shape of the part at the end of the first preform is shown in figure 22. The
workpiece was meshed with about 2000 elements, as shown in figure 23, and a clear picture of
the die set used in the first operation can be seen in figure 23. The predicted load required to
form the first preform is 86 ton (191 klbf) and there is no evedence of defects at this stage in the
forming process (see figure 24 and 25). Load goes up just before the final step to fill the corners
of the die cavity. As shown in Figure 24 the extrusion load was in the order of 60klbf before
sudden rise at the end of the stroke. The maximum strain exhibited at this is stage is 1.71.
Figure 22: Initial billet and final stage of 1st
preform
20
Figure 23: (left) Initial mesh used in the first preforming stage (right) die set used to carry out
the 1st
preforming stage
Figure 24: Strain Distribution in the First Preform
21
Figure 25: Magnified view of last step of first preform (no forming defect found)
Preform stage 2: The second preforming stage utilizes the geometry and strain from the final
step of the simulation of the first preforming stage. The desired geometry of the second preform
is shown in figure 26. The mesh and die set used to carry out this stage of the forming process is
shown in figure 27. A load of 85 tons (187klbf) was required to form the second preform and
there is still no evidence of forming defects, as can be seen in figure 28 and figure 29. Load goes
up just before the final step to fill the corners of the die cavity. The maximum strain in the
second preforming occurs at around the edge of the bottom surface of the part and is about 2.00
according to this model of the forging process.
22
Figure 26: Second preform drawing and die-punch design
Figure 27: (left) Initial mesh used in the 2nd
preforming stage (right) die set used to carry out the
second preforming stage
23
Figure 28: Strain distribution in the 2nd
preform
Figure 29: Magnified view of last step of 2nd
preform (no forming defect found)
24
Preform stage 3: The desired shape of the workpiece at the end of the third preforming stage is
shown in figure 30. Again, the final stage of the previous simulation is used as the starting point
for this simulation. The mesh and dies used in the third preforming stage are shown in figure 31.
According to the simulation, it takes 3.6 tons (8 klbf) to carry out the third preforming step. As
seen in figure 32 and figure 33, there is no evidence of a forming defect. The maximum strain in
the third preforming occurs at around the edge of the bottom surface of the part and is about 1.79.
Figure 30: Third preform drawing and die-punch design
25
Figure 31: (left) Initial mesh used in the third preforming stage (right) die set used to carry out
the third preforming stage
Figure 32: Strain distribution in the third preform
26
Figure 33: Magnified view of last step of 3rd preform (no forming defect found)
Final stage 4: The first step of the final step in the forging process was carried over from the
results of the previous simulation. The desired shape of the forging is shown in figure 34 and the
mesh and dies used in the forming process are shown in figure 35. The predicted load to carry
out this stage of the forming is 72.5 tons (160 klbf) and no folding defect was observed for this
forming process. Figure 36 and figure 37 show forming load and strain distribution for the final
stage. Load goes up just before the final step to fill the corners of the die cavity. The maximum
strain in the final forming occurs at around the center of the part and is about 1.79 according to
this model of the forging process.
27
Figure 34: Final forming drawing and die-punch design
Figure 35: (left) Initial mesh used in the final stage (right) die set used to carry out the final
stage
28
Figure 36: Strain distribution of the 630th
step of fourth preform
Figure 37: Magnified view of the final forming stage (no forming defect found)
29
30
Chapter 3
Forging Progression Alternatives for Part # 2
3.1 Alternative progression- I
In this alternative progression sequence the bolt shank is formed in two stages, one preform stage
and final stage.
Preform stage: The first simulation was set up by considering the first stage of forging as a
simple two die system, a fixed bottom die and a moving punch. The dimensions of the original
billet and the desired shape of the part at the end of the first preform is shown in figure 38. The
workpiece was meshed with about 2000 elements, as shown in figure39, and a clear picture of
the die set used in the first operation can be seen in figure 39. The predicted load required to
form the first preform is about 100 ton (225 klbf) and there is no evidence of defects at this stage
in the forming process (see figure 40 and figure 41). The punch load goes up just before the final
step to fill the corners of the die cavity. As seen in Figure 40, the punch load increase from
145klb to 225llbf at the final stroke.
Figure 38: Initial billet and 1st
stage preform dimensions
31
Figure 39: (left) Initial mesh used in the first preforming stage (right) die set used to carry out
the first preforming stage
Figure 40: Load and strain distribution at the final punch stroke of the preforming stage
32
Figure 41: Magnified view of final step of first preforming (no forming defect found)
Final state: The final stage of the previous simulation is used as the starting point for this
simulation. The mesh and dies used in the third preforming stage are shown in figure 43.
According to the simulation, it takes 139 tons (307 klbf) to carry out the third preforming step,
Figure 44. It should be noted that the load goes up from 150klbf to 305 klbf just before the final
step to fill the corners of the die cavity. The strain map figures (Figs 44 and 45) show no
evidence of a forming defect. The maximum strain of 2.63 occurs at the center of the backward
extruded cup.
33
Figure 42: Final forming drawing
Figure 43: (left) Initial mesh used in the final stage (right) die set used to carry out the final
forming operation
34
Figure 44: Load and strain distribution of the 496th
step of final forming stage
Figure 45: Magnified view of final step of forming (no forming defect found)
35
3.2 Progression Alternative - II
In this alternative progression sequence the bolt shank is formed in three stages, 1st
preform, 2nd
preform and final stage.
Preform stage 1: The first simulation was set up by considering the first stage of forging as a
simple two die system, a fixed bottom die and a moving punch. The dimensions of the original
billet and the desired shape of the part at the end of the first preform is shown in figure 46. The
workpiece was meshed with about 2000 elements, as shown in figure 47, and a clear picture of
the die set used in the first operation can be seen in figure 47. Note that in this alternative and
small diameter billet is used. The predicted load required to form the first preform is 21 ton (46.7
klbf) and there is no evidence of defects at this stage in the forming process (see figure 48 and
figure 49). A maximum effective strain of 1.58 was exhibited at this stage.
Figure 46: initial billet and final stage of first preform
36
Figure 47: (left) Initial mesh used in the 1st
preforming stage (right) die set used to carry out the
1st
preforming stage
Figure 48: Load and strain distribution in the 1st
preform
37
Figure 49: Magnified view of last step of 1st
preform (no forming defect found)
Preform stage 2: The second preforming stage utilizes the geometry and strain from the final
step of the simulation of the first preforming stage. The mesh and die set used to carry out this
stage of the forming process is shown in figure 50. A load of 43 tons (95.1klbf) was required to
form the second preform and there is still no evidence of forming defects, as can be seen in
figure 51 and figure 52. The punch load slightly goes up just before the final step to fill the
corners of the die cavity. The maximum strain in the second preforming occurs at around the
edge of the bottom surface of the part and is about 1.93.
38
Figure 50: (left) Initial mesh used in the second preforming stage (right) die set used to carry out
the second preforming stage
Figure 51: Strain distribution in the second preform
39
Figure 52: Magnified view of last step of second preform (no forming defect found)
Final stage: The final stage of the previous simulation is used as the starting point for this
simulation. The mesh and dies used in the third preforming stage are shown in figure 54.
According to the simulation, it takes 108 tons (239 klbf) to carry out the third preforming step.
Load goes up just before the final step to fill the corners of the die cavity. Figures 55 and 56
show that at the end of the punch stroke there is no evidence of a forming defect. The maximum
strain in the final stage occurs at around the center of the backward extruded cup and is about
3.01 (Figure 56). This strain is rather high for cold forging but it is localized at the center of the
extruded cup.
40
Figure 53: Final forming drawing
Figure 54: (left) Initial mesh used in the final stage (right) die set used to carry out the final
stage
41
Figure 55: Load and strain distribution in the final forming operation
Figure 56: Magnified view of last step of final forming operation (no forming defect found)
42
3.3 Progression Alternative -III (Baseline given by Nelson)
In this alternative progression sequence the bolt shank is formed in four stages; 1st
preform, 2nd
preform, 3rd
and final stage.
Preform stage 1: The first simulation was set up by considering the first stage of forging as a
simple two die system, a fixed bottom die and a moving punch. The dimensions of the origonal
billet and the desired shape of the part at the end of the first preform is shown in figure 57. The
workpiece was meshed with about 2000 elements, as shown in figure 58, and a clear picture of
the die set used in the first operation can be seen in figure 58. The predicted load required to
form the first preform is 21.5 ton (47.4 klbf) and there is no evedence of defects at this stage in
the forming process (see figure 59 and figure 60).
Figure 57: initial billet and final stage of first preform
43
Figure 58: (left) Initial mesh used in the first preforming stage (right) die set used to carry out
the first preforming stage
Figure 59: Load and strain distribution in the 1st
preform
44
Figure 60: Magnified view of last step of first preform (no forming defect found)
Preform stage 1 (repeat):
The first simulation (following given baseline) was repeated due to inconsistant strain rate
comparing to strain rate of first preform simulation (given baseline design for part-1) of part-1
(Figure 24). For this step maximum strain for part-1 was 1.71 but for part-2 it is 1.33 which is
considerablly lowar then part-1 first preform strain. To analyse this issure we repeat this
simulation again. Simulation was set up as a simple two die system, a fixed bottom die and a
moving punch. The dimensions of the origonal billet and the desired shape of the part at the end
of the first preform is shown in figure 57. The workpiece was meshed with about 2000 elements,
as shown in figure 61, and a clear picture of the die set used in the first operation can be seen in
figure 61. The predicted load required to form the first preform is 97 ton (213 klbf) (previous
step’s load and strain was 48.7 klbf and 1.55 in/in respectively) and there is no evedence of
defects at this stage in the forming process (see figure 62 and figure 63).
45
Figure 61: (left) Initial mesh used in the first preforming stage (right) die set used to carry out
the first preforming stage
Figure 62: Load and strain distribution in the 1st
preform
46
Figure 63: Magnified view of last step of first preform (no forming defect found)
Strain comparison of preform1 of part-1 and part-2:
Figure 64: (a) first preform of part-2 (b) repeated first preform of part-2 (c) first preform of part -
1 (figure 24)
Part -2 Part -2 Part -1
47
In Figure 64 shows the strain distribution of (a) first preform of part-2, (b) repeated first preform
of part-2 and (c) first preform of part -1. In this three figure parts are extruding from .615 starting
diameter to .430 finish diameter but the maximum strains are not same. Strain concentretration at
the bottom corner of the bolt shank (Figure 64 –(b) and (c)) incraced the maximum strains but
strain distributions along the bolt shank (~ 1.33 in/in) are similer for all the preforms which
confirm the consistancy of forming process. We repeated the all the preforming process of part-2
(folloing given basieline design) to see the reproducebility of the process. Repeated preforms for
part-2 are discuss at the end of this chapter.
Preform stage 2: The second preforming stage utilizes the geometry and strain from the final
step of the simulation of the first preforming stage. The desired geometry of the second preform
is shown in figure 65. The mesh and die set used to carry out this stage of the forming process is
shown in figure 66. A load of 117.5 tons (259 klbf) was required to form the second preform
and there is still no evidence of forming defects, as can be seen in figure 67 and figure 68. Load
goes up just before the final step to fill the corners of the die cavity. The maximum strain in the
second preforming occurs at the center of the backward extruded and is about 1.71.
Figure 65: Second preform drawing and die-punch design
48
Figure 66: (left) Initial mesh used in the second preforming stage (right) die set used to carry out
the second preforming stage
Figure 67: Load and strain distribution in the second preform
49
Figure 68: Magnified view of last step of second preform (no forming defect found)
Preform stage 3: The desired shape of the workpiece at the end of the third preforming stage is
shown in figure 69. Again, the final stage of the previous simulation is used as the starting point
for this simulation. The mesh and dies used in the third preforming stage are shown in figure 70.
According to the simulation, it takes 43 tons (95.2 klbf) to carry out the third preforming step.
Figures 71 and 72 show that at the end of the third simulation, there is no evidence of a forming
defect. The maximum strain in the third preforming occurs at the center of the backward
extruded cup and is about 2.97.
50
Figure 69: Third preform drawing and die-punch design
51
Figure 70: (left) Initial mesh used in the third preforming stage (right) die set used to carry out
the third preforming stage
Figure 71: Load and strain distribution in the third preform
52
Figure 72: Magnified view of last step of third preform (no forming defect found)
Final forming stage: The first step of the final step in the forging process was carried over from
the results of the previous simulation. The desired shape of the forging is shown in figure 69 and
the mesh and dies used in the forming process are shown in figure 73. The predicted load to
carry out this stage of the forming is 90 tons (199 klbf) and no folding defect was observed for
this forming process as shown in figures 74 and 75. Load goes up just before the final step to fill
the corners of the die cavity. The maximum strain in the final forming occurs at around the
center of the backward extruded section and is about 3.69 according to this model of the forging
process. The maximum strain exhibited in this alternative progression is rather high for cold
forming. It should be noted that the same progression was used for Part # 1. But the maximum
strain induced for Part # 1, was relatively low.
53
Figure 73: Final forming drawing and die-punch design
Figure 75: (left) Initial mesh used in the final stage (right) die set used to carry out the final
stage
54
Figure 74: Load and strain distribution of the 896th
step of final forming stage
Figure 76: Magnified view of final forming stage (no forming defect found)
55
3.3 Repeated Simulation of Progression Alternative -III (Baseline given by Nelson)
In this alternative progression sequence the bolt shank is formed in four stages; 1st
preform, 2nd
preform, 3rd
and final stage.
Repeated preform stage 1.
The first simulation was set up as a simple two die system, a fixed bottom die and a moving
punch. The dimensions of the origonal billet and the desired shape of the part at the end of the
first preform is shown in figure 77. The workpiece was meshed with about 2000 elements, as
shown in figure 78, and a clear picture of the die set used in the first operation can be seen in
figure 78. The predicted load required to form the first preform is 22 ton (47.4 klbf) and there is
no evedence of defects at this stage in the forming process (see figure 79 and figure 80).
Figure 77: initial billet and final stage of first preform
56
Figure 78: (left) Initial mesh used in the first preforming stage (right) die set used to carry out
the first preforming stage
57
Figure 79: Load and strain distribution in the 1st
preform
Figure 80: Magnified view of last step of first preform (no forming defect found)
Preform stage 2: The second preforming stage utilizes the geometry and strain from the final
step of the simulation of the first preforming stage. The desired geometry of the second preform
is shown in figure 81. The mesh and die set used to carry out this stage of the forming process is
shown in figure 82. A load of 112 tons (248 klbf) was required to form the second preform and
there is still no evidence of forming defects, as can be seen in figure 83 and figure 84. Load goes
up just before the final step to fill the corners of the die cavity. The maximum strain in the
second preforming occurs at the center of the backward extruded and is about 2.08.
58
Figure 81: Second preform drawing and die-punch design
Figure 82: (left) Initial mesh used in the second preforming stage (right) die set used to carry out
the second preforming stage
59
Figure 83: Load and strain distribution in the second preform
Figure 84: Magnified view of last step of second preform (no forming defect found)
60
Preform stage 3: The desired shape of the workpiece at the end of the third preforming stage is
shown in figure 85. Again, the final stage of the previous simulation is used as the starting point
for this simulation. The mesh and dies used in the third preforming stage are shown in figure 86.
According to the simulation, it takes 43 tons (93.4 klbf) to carry out the third preforming step.
Figures 87 and 88 show that at the end of the third simulation, there is no evidence of a forming
defect. The maximum strain in the third preforming occurs at the center of the backward
extruded cup and is about 2.92.
Figure 85: Third preform drawing and die-punch design
61
Figure 86: (left) Initial mesh used in the third preforming stage (right) die set used to carry out
the third preforming stage
Figure 87: Load and strain distribution in the third preform
62
Figure 88: Magnified view of last step of third preform (no forming defect found)
Final forming stage: The first step of the final step in the forging process was carried over from
the results of the previous simulation. The desired shape of the forging is shown in figure 89 and
the mesh and dies used in the forming process are shown in figure 80. The predicted load to
carry out this stage of the forming is 79 tons (176 klbf) and no folding defect was observed for
this forming process as shown in figures 91 and 92. Load goes up just before the final step to fill
the corners of the die cavity. The maximum strain in the final forming occurs at around the
center of the backward extruded section and is about 3.23 according to this model of the forging
process. The maximum strain exhibited in this alternative progression is rather high for cold
forming. It should be noted that the same progression was used for Part # 1. But the maximum
strain induced for Part # 1, was relatively low.
63
Figure 89: Final forming drawing and die-punch design
Figure 90: (left) Initial mesh used in the final stage (right) die set used to carry out the final
stage
64
Figure 91: Load and strain distribution of the 896th
step of final forming stage
Figure 92: Magnified view of final forming stage (no forming defect found)
65
66
Chapter 4
Conclusions
A number of simulations were carried out to determine potential progression sequences for both
Part 1 and Part 2. This report, however, presents three alternative progressions for each part. The
presented progressions were carefully studied to ensure that there is no defect. Tables 1 and 2
give the maximum strain values and punch loads exhibited in all the forming stages.
*- A previous step with strain of 1.79 was used in the next simulation.
Table 1: Forging summary for Part -1
Progression variants
Maximum load
(klbf)
Maximum strain
(in/in)
Alternative # 1
Preform - 1 228 2.16
Final stage 292 2.16
Alternative # 2
Preform - 1 65.9 1.38
Preform - 2 137 1.65
Final stage 239 3.11
Alternative # 3
(baseline provided by
Nelson)
Preform - 1 191 1.71
Preform - 2 187 2.00*
Preform - 3 8 1.79
Final stage 160 1.79
Table 2: Forging summary for Part -2
Progression Variants Maximum load (klbf)
Maximum strain
(in/in)
Alternative # 1
Preform - 1 225 2.25
Final stage 307 2.63
Alternative # 2
Preform - 1 46.7 1.58
Preform - 2 95.1 1.93
Final stage 239 3.01
Repeated
preforms
Alternative # 3
(baseline provided
by Nelson)
Preform - 1 47.4 1.33 1.33
Preform - 2 259 1.71 2.08
Preform - 3 95.2 2.97 2.92
Final stage 199 3.69 3.23

More Related Content

What's hot

Lec.3 General rules in quantitative survey. Quantity measuring. Rate analysis
Lec.3  General rules in quantitative survey. Quantity measuring. Rate analysisLec.3  General rules in quantitative survey. Quantity measuring. Rate analysis
Lec.3 General rules in quantitative survey. Quantity measuring. Rate analysisMuthanna Abbu
 
19888 annals 2_head
19888 annals 2_head19888 annals 2_head
19888 annals 2_headsundar sivam
 
Ansys beam problem
Ansys beam problemAnsys beam problem
Ansys beam problemnmahi96
 
Modeling of twain Tunnel water conveyance
Modeling of twain Tunnel water conveyanceModeling of twain Tunnel water conveyance
Modeling of twain Tunnel water conveyanceHamed Zarei
 

What's hot (8)

Lec.3 General rules in quantitative survey. Quantity measuring. Rate analysis
Lec.3  General rules in quantitative survey. Quantity measuring. Rate analysisLec.3  General rules in quantitative survey. Quantity measuring. Rate analysis
Lec.3 General rules in quantitative survey. Quantity measuring. Rate analysis
 
19888 annals 2_head
19888 annals 2_head19888 annals 2_head
19888 annals 2_head
 
3 d
3 d3 d
3 d
 
Ansys beam problem
Ansys beam problemAnsys beam problem
Ansys beam problem
 
B045030610
B045030610B045030610
B045030610
 
Ansys
Ansys Ansys
Ansys
 
Modeling of twain Tunnel water conveyance
Modeling of twain Tunnel water conveyanceModeling of twain Tunnel water conveyance
Modeling of twain Tunnel water conveyance
 
Metal flow simulation
Metal flow simulationMetal flow simulation
Metal flow simulation
 

Viewers also liked

5. Oscar León – Director Agencia Nacional del Espectro.
5. Oscar León – Director Agencia Nacional del Espectro. 5. Oscar León – Director Agencia Nacional del Espectro.
5. Oscar León – Director Agencia Nacional del Espectro. Observatic Externado
 
Vigilancia y Control del Espectro Radioeléctrico - ANE
Vigilancia y Control del Espectro Radioeléctrico - ANEVigilancia y Control del Espectro Radioeléctrico - ANE
Vigilancia y Control del Espectro Radioeléctrico - ANEAgencia Nacional del Espectro
 
Marco Peres - Tendencias normativas en materia de ciudadanía inteligente
Marco Peres - Tendencias normativas en materia de ciudadanía inteligenteMarco Peres - Tendencias normativas en materia de ciudadanía inteligente
Marco Peres - Tendencias normativas en materia de ciudadanía inteligenteObservatic Externado
 
Plan de negocio optica
Plan de negocio opticaPlan de negocio optica
Plan de negocio opticaASESVISION
 
'Cultura de uso de las TIC en los colombianos para relacionarse con el Estado'.
'Cultura de uso de las TIC en los colombianos para relacionarse con el Estado'.'Cultura de uso de las TIC en los colombianos para relacionarse con el Estado'.
'Cultura de uso de las TIC en los colombianos para relacionarse con el Estado'.Ministerio TIC Colombia
 
Espectro electromagnetico
Espectro electromagneticoEspectro electromagnetico
Espectro electromagneticoKarla Mendoza
 
ESPECTRO ELECTROMAGNETICO
ESPECTRO ELECTROMAGNETICOESPECTRO ELECTROMAGNETICO
ESPECTRO ELECTROMAGNETICOLaTia Tuca
 
Vigilancia y Control del Espectro radioeléctrico como elemento de la Calidad ...
Vigilancia y Control del Espectro radioeléctrico como elemento de la Calidad ...Vigilancia y Control del Espectro radioeléctrico como elemento de la Calidad ...
Vigilancia y Control del Espectro radioeléctrico como elemento de la Calidad ...Ministerio TIC Colombia
 

Viewers also liked (8)

5. Oscar León – Director Agencia Nacional del Espectro.
5. Oscar León – Director Agencia Nacional del Espectro. 5. Oscar León – Director Agencia Nacional del Espectro.
5. Oscar León – Director Agencia Nacional del Espectro.
 
Vigilancia y Control del Espectro Radioeléctrico - ANE
Vigilancia y Control del Espectro Radioeléctrico - ANEVigilancia y Control del Espectro Radioeléctrico - ANE
Vigilancia y Control del Espectro Radioeléctrico - ANE
 
Marco Peres - Tendencias normativas en materia de ciudadanía inteligente
Marco Peres - Tendencias normativas en materia de ciudadanía inteligenteMarco Peres - Tendencias normativas en materia de ciudadanía inteligente
Marco Peres - Tendencias normativas en materia de ciudadanía inteligente
 
Plan de negocio optica
Plan de negocio opticaPlan de negocio optica
Plan de negocio optica
 
'Cultura de uso de las TIC en los colombianos para relacionarse con el Estado'.
'Cultura de uso de las TIC en los colombianos para relacionarse con el Estado'.'Cultura de uso de las TIC en los colombianos para relacionarse con el Estado'.
'Cultura de uso de las TIC en los colombianos para relacionarse con el Estado'.
 
Espectro electromagnetico
Espectro electromagneticoEspectro electromagnetico
Espectro electromagnetico
 
ESPECTRO ELECTROMAGNETICO
ESPECTRO ELECTROMAGNETICOESPECTRO ELECTROMAGNETICO
ESPECTRO ELECTROMAGNETICO
 
Vigilancia y Control del Espectro radioeléctrico como elemento de la Calidad ...
Vigilancia y Control del Espectro radioeléctrico como elemento de la Calidad ...Vigilancia y Control del Espectro radioeléctrico como elemento de la Calidad ...
Vigilancia y Control del Espectro radioeléctrico como elemento de la Calidad ...
 

Similar to NELSON_STUD Welding_updated-Dec12

finalreportedit.docx
finalreportedit.docxfinalreportedit.docx
finalreportedit.docxChenXi Liu
 
Solid_Modeling_Project_#2_ Reverse engineering of a connecting rod and docume...
Solid_Modeling_Project_#2_ Reverse engineering of a connecting rod and docume...Solid_Modeling_Project_#2_ Reverse engineering of a connecting rod and docume...
Solid_Modeling_Project_#2_ Reverse engineering of a connecting rod and docume...Mehmet Bariskan
 
2016 optimisation a rear wing endplate in a rotating domain
2016 optimisation a rear wing endplate in a rotating domain2016 optimisation a rear wing endplate in a rotating domain
2016 optimisation a rear wing endplate in a rotating domainHashan Mendis
 
A Case study for near net Shape – Flashless forging for full yoke (Sleeve Yo...
A Case study for near net Shape – Flashless forging for full yoke  (Sleeve Yo...A Case study for near net Shape – Flashless forging for full yoke  (Sleeve Yo...
A Case study for near net Shape – Flashless forging for full yoke (Sleeve Yo...IJMER
 
Die design optimization and die stress analysis of control arm by simulation
Die design optimization and die stress analysis of control arm by simulation Die design optimization and die stress analysis of control arm by simulation
Die design optimization and die stress analysis of control arm by simulation Kundan Kumar
 
Extrusion process
Extrusion processExtrusion process
Extrusion processAli Hameed
 
FEM_Modeling_Project_Evaluation of a Steel Pulley and Shaft Design
FEM_Modeling_Project_Evaluation of a Steel Pulley and Shaft DesignFEM_Modeling_Project_Evaluation of a Steel Pulley and Shaft Design
FEM_Modeling_Project_Evaluation of a Steel Pulley and Shaft DesignMehmet Bariskan
 
Modeling seismic analysis_and_design_of_rc_building_10_story
Modeling seismic analysis_and_design_of_rc_building_10_storyModeling seismic analysis_and_design_of_rc_building_10_story
Modeling seismic analysis_and_design_of_rc_building_10_storyAliAlmayalee
 
Based on The Robust Design of Gear Die Optimization
Based on The Robust Design of Gear Die OptimizationBased on The Robust Design of Gear Die Optimization
Based on The Robust Design of Gear Die OptimizationIJRESJOURNAL
 
Wire and bar Drawing
  Wire and bar Drawing  Wire and bar Drawing
Wire and bar DrawingAli Hameed
 
Sheet Metal Micro Forming: Future Research Potentials
Sheet Metal Micro Forming: Future Research PotentialsSheet Metal Micro Forming: Future Research Potentials
Sheet Metal Micro Forming: Future Research PotentialsIDES Editor
 
Optimization of tube-flange welded joints under Torsional loading
Optimization of tube-flange welded joints under Torsional loadingOptimization of tube-flange welded joints under Torsional loading
Optimization of tube-flange welded joints under Torsional loadingIRJET Journal
 
Two Dimensional Crack Analysis of AL7075-7651 Under Various Tensile Load
Two Dimensional Crack Analysis of AL7075-7651 Under Various Tensile LoadTwo Dimensional Crack Analysis of AL7075-7651 Under Various Tensile Load
Two Dimensional Crack Analysis of AL7075-7651 Under Various Tensile LoadIRJET Journal
 
Rice Transporter Robot Project Report
Rice Transporter Robot Project ReportRice Transporter Robot Project Report
Rice Transporter Robot Project ReportKristopher Brown
 
Design & Optimization of Lever Quadrant Assembly for Light Transport Aircraft
Design & Optimization of Lever Quadrant Assembly for Light Transport AircraftDesign & Optimization of Lever Quadrant Assembly for Light Transport Aircraft
Design & Optimization of Lever Quadrant Assembly for Light Transport AircraftIRJET Journal
 
A Study on Thermo-Mechanical Analysis of Hot Rolling & Estimation of Residual...
A Study on Thermo-Mechanical Analysis of Hot Rolling & Estimation of Residual...A Study on Thermo-Mechanical Analysis of Hot Rolling & Estimation of Residual...
A Study on Thermo-Mechanical Analysis of Hot Rolling & Estimation of Residual...IOSR Journals
 
Final Project_ Design and FEM Analysis of Scissor Jack
Final Project_ Design and FEM Analysis of Scissor JackFinal Project_ Design and FEM Analysis of Scissor Jack
Final Project_ Design and FEM Analysis of Scissor JackMehmet Bariskan
 

Similar to NELSON_STUD Welding_updated-Dec12 (20)

finalreportedit.docx
finalreportedit.docxfinalreportedit.docx
finalreportedit.docx
 
Solid_Modeling_Project_#2_ Reverse engineering of a connecting rod and docume...
Solid_Modeling_Project_#2_ Reverse engineering of a connecting rod and docume...Solid_Modeling_Project_#2_ Reverse engineering of a connecting rod and docume...
Solid_Modeling_Project_#2_ Reverse engineering of a connecting rod and docume...
 
2016 optimisation a rear wing endplate in a rotating domain
2016 optimisation a rear wing endplate in a rotating domain2016 optimisation a rear wing endplate in a rotating domain
2016 optimisation a rear wing endplate in a rotating domain
 
A Case study for near net Shape – Flashless forging for full yoke (Sleeve Yo...
A Case study for near net Shape – Flashless forging for full yoke  (Sleeve Yo...A Case study for near net Shape – Flashless forging for full yoke  (Sleeve Yo...
A Case study for near net Shape – Flashless forging for full yoke (Sleeve Yo...
 
Die design optimization and die stress analysis of control arm by simulation
Die design optimization and die stress analysis of control arm by simulation Die design optimization and die stress analysis of control arm by simulation
Die design optimization and die stress analysis of control arm by simulation
 
Jc jmpt00
Jc jmpt00Jc jmpt00
Jc jmpt00
 
Extrusion process
Extrusion processExtrusion process
Extrusion process
 
FEM_Modeling_Project_Evaluation of a Steel Pulley and Shaft Design
FEM_Modeling_Project_Evaluation of a Steel Pulley and Shaft DesignFEM_Modeling_Project_Evaluation of a Steel Pulley and Shaft Design
FEM_Modeling_Project_Evaluation of a Steel Pulley and Shaft Design
 
Modeling seismic analysis_and_design_of_rc_building_10_story
Modeling seismic analysis_and_design_of_rc_building_10_storyModeling seismic analysis_and_design_of_rc_building_10_story
Modeling seismic analysis_and_design_of_rc_building_10_story
 
Based on The Robust Design of Gear Die Optimization
Based on The Robust Design of Gear Die OptimizationBased on The Robust Design of Gear Die Optimization
Based on The Robust Design of Gear Die Optimization
 
H012526874
H012526874H012526874
H012526874
 
Wire and bar Drawing
  Wire and bar Drawing  Wire and bar Drawing
Wire and bar Drawing
 
Sheet Metal Micro Forming: Future Research Potentials
Sheet Metal Micro Forming: Future Research PotentialsSheet Metal Micro Forming: Future Research Potentials
Sheet Metal Micro Forming: Future Research Potentials
 
Optimization of tube-flange welded joints under Torsional loading
Optimization of tube-flange welded joints under Torsional loadingOptimization of tube-flange welded joints under Torsional loading
Optimization of tube-flange welded joints under Torsional loading
 
Two Dimensional Crack Analysis of AL7075-7651 Under Various Tensile Load
Two Dimensional Crack Analysis of AL7075-7651 Under Various Tensile LoadTwo Dimensional Crack Analysis of AL7075-7651 Under Various Tensile Load
Two Dimensional Crack Analysis of AL7075-7651 Under Various Tensile Load
 
Mini Project for Design of Manufacturing
Mini Project for Design of ManufacturingMini Project for Design of Manufacturing
Mini Project for Design of Manufacturing
 
Rice Transporter Robot Project Report
Rice Transporter Robot Project ReportRice Transporter Robot Project Report
Rice Transporter Robot Project Report
 
Design & Optimization of Lever Quadrant Assembly for Light Transport Aircraft
Design & Optimization of Lever Quadrant Assembly for Light Transport AircraftDesign & Optimization of Lever Quadrant Assembly for Light Transport Aircraft
Design & Optimization of Lever Quadrant Assembly for Light Transport Aircraft
 
A Study on Thermo-Mechanical Analysis of Hot Rolling & Estimation of Residual...
A Study on Thermo-Mechanical Analysis of Hot Rolling & Estimation of Residual...A Study on Thermo-Mechanical Analysis of Hot Rolling & Estimation of Residual...
A Study on Thermo-Mechanical Analysis of Hot Rolling & Estimation of Residual...
 
Final Project_ Design and FEM Analysis of Scissor Jack
Final Project_ Design and FEM Analysis of Scissor JackFinal Project_ Design and FEM Analysis of Scissor Jack
Final Project_ Design and FEM Analysis of Scissor Jack
 

NELSON_STUD Welding_updated-Dec12

  • 1. 1 Report Number: F/MAE/NG/2015-3 Forging Progression Sequence Development for Bolt Shank Submitted to Nelson Stud Welding By Fnu Aktaruzzaman – Research Assistant James Lowrie – Research Assistant Gracious Ngaile – Associate Professor North Carolina State University Department of Mechanical & Aerospace Engineering Advanced Metal Forming and Tribology Laboratory (AMTL) December 5, 2015 Confidential Report
  • 2. 2 Foreword This document has been prepared by the Advanced Metal Forming and Tribology Laboratory in the Department of Mechanical and Aerospace Engineering at North Carolina State University. The research focus of this Lab includes manufacturing process modeling and optimization, triboscience and tribotechnology, tool design, and computational tools. In addition to conducting industry relevant engineering research, the Lab has the objectives a) establish close cooperation between industry and the university, b) train students, and c) transfer the research results to interested companies. This report, entitled “Forging Progression Sequence Development for Bolt Shank”, presents FE simulation results for several alternative progression sequences. For further information, contact Dr. Gracious Ngaile, located at North Carolina State University, Department of Mechanical & Aerospace Engineering, 911 Oval Drive – 3160 Engineering Building III, BOX 7910, Raleigh, NC, 27695-7910, phone: 919-515-5222, email:gracious_ngaile@ncsu.edu, webpage:http://www.mae.ncsu.edu/ngaile.
  • 3. 3 Table of Contents Foreword …………………………………………….…...2 Table of contents …………………………………………………3 Chapter 1: Introduction …………………………………………………4 1.0 Introduction ………………………………………………....4 1.1 Objectives …………………………………………………5 1.2 Approach …………………………………………………5 1.3 Finite Element Setups ………………………………………………....6 Chapter 2: Forging Progression Alternatives for Part# 1…………………………7 2.1 Progression Alternative – I …………………………………………………7 2.2 Progression Alternative – II …………………………………………………11 2.3 Progression Alternative –III ………………………………………………....18 Chapter 3: Forging Progression Alternatives for Part# 2…………………………28 3.1 Progression Alternative – I …………………………………………………28 3.2 Progression Alternative – II …………………………………………………34 3.3 Progression Alternative – III …………………………………………………41 3.4 Repeated Simulation of Progression Alternative -III ……………………………..54 Chapter 4: Conclusions …………………………………………………51
  • 4. 4 Chapter 1 Introduction 1. Introduction Nelson stud welding plans to produce bolt shank shown in Figures 1 and 2 by forging. Due to complex flow of material, these parts can only be produced in several stages. NCSU was asked to determine potential progression sequences and study material flow using the finite element method. Conventional forging techniques for forward-backward extrusion of similar parts have shown to produce folding defects. Thus, in the course of developing progression sequences, emphasis was given to material follow modes, strain induced, fold formation, under fill and other defects. Figure1: Dimensional details of Part-1
  • 5. 5 Figure2: Dimensional details of Part-2 1.1 Objectives (a) Conduct finite element analysis of the baseline progression provided by Nelson. Reproduce fold defect that has been encountered in industry when forming these parts. (Reported in progress report). (b) Establish potential alternative forging sequence for Part 1 and Part 2 that lead to sound product. 1.2 Approach Preform design methodology based on geometric resemblance developed at NCSU was used to narrow down potential progression sequences. Finite element software DEFORM was used in the study. The baseline progression provided by Nelson was used as a starting point to develop alternative progression sequences. Before looking for other progression alternatives, fold defect had to be reproduced by simulating the baseline sequence.
  • 6. 6 1. 3 Finite Element Model Setups The simulations were carried out using 2D DEFORM software package. The following assumptions were made to facilitate the solution process.  The process can be considered a quasi-static problem (No kinetic effects)  The process is not strain rate dependent because it is a cold forging process (rigid-plasic material)  AISI 4140 was used in the simulations  The dies used in the process do not deform  All preform and final form shapes are rotationally symmetric about their center axis  Friction between the dies and workpiece was approximated by a constant shear friction factor of 0.12 A number of simulations were carried out. This report, however, presents three different alternatives for each part. The alternative progressions for Part 1 are presented in Chapter 2 and altenative progressions for Part 2 are presented in Chapter 3.
  • 7. 7 Chapter 2 Forging Progression Alternatives for Part # 1 2.1 Progression Alternative – I In this alternative progression sequence the bolt shank is formed in two stages, one preform stage and final stage. Preform stage: The first simulation was set up by considering the first stage of forging as a simple two die system, a fixed bottom die and a moving punch. The dimensions of the original billet and the desired shape of the part at the end of the first preform is shown in figure 3. The workpiece was meshed with about 2000 elements, as shown in figure 4, and a clear picture of the die set used in the first operation can be seen in figure 5. The predicted load required to form the first preform is 103 ton (228 klbf) and there is no evidence of defects at this stage in the forming process (see figure 5 and figure 6). Load goes up just before the final step to fill the corners of the die cavity. Figure 3: Initial billet and the preform dimensions
  • 8. 8 Figure 4: (left) Initial mesh used in the first preforming stage (right) die set used to carry out the first preforming stage Figure 5: Strain distribution of the 127th step of first preforming
  • 9. 9 Figure 6: Magnified view of final step of first preforming (no forming defect found) Final forming stage: The final stage of the previous simulation is used as the starting point for this simulation. The mesh and dies used in the final stage are shown in figure 8. According to the simulation, it takes 132 tons (292 klbf) to form the part. Load goes up just before the final step to fill the corners of the die cavity. A seen in figure 9 and figure 10, there is no evidence of a forming defect. The maximum strain induced in the final stage is 2.16 and occurs around the edge of the bottom surface of the part and the top backward extruded cup.
  • 10. 10 Figure 7: Final forming drawing Figure 8: (left) Initial mesh used in the final stage (right) die set used to carry out the final forming operation
  • 11. 11 Figure 9: Strain distribution of the 190th step of final forming Figure 10: Magnified view of final step of final forming (no forming defect found)
  • 12. 12 2.2 Progression Alternative- II In this alternative progression sequence the bolt shank is formed in three stages; 1st preform, 2nd preform and final stage. Preform stage 1: The first simulation was set up by considering the first stage of forging as a simple two die system, a fixed bottom die and a moving punch. The dimensions of the original billet and the desired shape of the part at the end of the first preform is shown in figure 11. Note that in this alternative, the initial billet has a smaller diameter compared to the alternative 1. The workpiece was meshed with about 2000 elements, as shown in figure 12, and a clear picture of the die set used in the first operation can be seen in figure 12. The predicted load required to form the first preform is 30 ton (65.9 klbf) and there is no evidence of defects at this stage in the forming process (see figure 13 and figure 14). Load goes up just before the final step to fill the corners of the die cavity. Figure 11: Initial billet and 1st preform dimensions
  • 13. 13 Figure 12: (left) Initial mesh used in the first preforming stage (right) die set used to carry out the first preforming stage Figure 13: Strain Distribution in the First Preform
  • 14. 14 Figure 14: Magnified view of last step of first preform (no forming defect found) Preform stage 2: The second preforming stage utilizes the geometry and strain from the final step of the simulation of the first preforming stage. The mesh and die set used to carry out this stage of the forming process is shown in figure 15. A load of 62 tons (137klbf) was required to form the second preform and there is still no evidence of forming defects, as can be seen in figure 16 and figure 17. Load goes up just before the final step to fill the corners of the die cavity. The maximum strain in the second preforming occurs at around the edge of the bottom surface of the part and is about 1.65.
  • 15. 15 Figure 15: (left) Initial mesh used in the second preforming stage (right) die set used to carry out the second preforming stage Figure 16: Strain distribution in the second preform
  • 16. 16 Figure 17: Magnified view of last step of second preform (no forming defect found) Final stage: The final stage of the previous simulation is used as the starting point for this simulation. The mesh and dies used in the third preforming stage are shown in figure 19. According to the simulation, it takes 108 tons (239 klbf) to carry out the final forming stage. Load goes up just before the final step to fill the corners of the die cavity. As shown in figures 20 and 21, there is no evidence of a forming defect. The maximum strain in the final stage occurs at around the edge of the bottom surface of the extruded cup and is about 3.11. This strain is rather high for cold forming. However it is localized at the center of the cup.
  • 17. 17 Figure 18: Final forming drawing Figure 19: (left) Initial mesh used in the second preforming stage (right) die set used to carry out the final forming stage
  • 18. 18 Figure 20: Strain distribution in the final forming operation Figure 21: Magnified view of last step of final forming operation (no forming defect found)
  • 19. 19 2.3 Progression Alternative - III (Baseline given by Nelson) In this alternative progression sequence the bolt shank is formed in four stages; 1st preform, 2nd preform, 3rd and final stage. Preform 1: The first simulation was set up by considering the first stage of forging as a simple two die system, a fixed bottom die and a moving punch. The dimensions of the origonal billet and the desired shape of the part at the end of the first preform is shown in figure 22. The workpiece was meshed with about 2000 elements, as shown in figure 23, and a clear picture of the die set used in the first operation can be seen in figure 23. The predicted load required to form the first preform is 86 ton (191 klbf) and there is no evedence of defects at this stage in the forming process (see figure 24 and 25). Load goes up just before the final step to fill the corners of the die cavity. As shown in Figure 24 the extrusion load was in the order of 60klbf before sudden rise at the end of the stroke. The maximum strain exhibited at this is stage is 1.71. Figure 22: Initial billet and final stage of 1st preform
  • 20. 20 Figure 23: (left) Initial mesh used in the first preforming stage (right) die set used to carry out the 1st preforming stage Figure 24: Strain Distribution in the First Preform
  • 21. 21 Figure 25: Magnified view of last step of first preform (no forming defect found) Preform stage 2: The second preforming stage utilizes the geometry and strain from the final step of the simulation of the first preforming stage. The desired geometry of the second preform is shown in figure 26. The mesh and die set used to carry out this stage of the forming process is shown in figure 27. A load of 85 tons (187klbf) was required to form the second preform and there is still no evidence of forming defects, as can be seen in figure 28 and figure 29. Load goes up just before the final step to fill the corners of the die cavity. The maximum strain in the second preforming occurs at around the edge of the bottom surface of the part and is about 2.00 according to this model of the forging process.
  • 22. 22 Figure 26: Second preform drawing and die-punch design Figure 27: (left) Initial mesh used in the 2nd preforming stage (right) die set used to carry out the second preforming stage
  • 23. 23 Figure 28: Strain distribution in the 2nd preform Figure 29: Magnified view of last step of 2nd preform (no forming defect found)
  • 24. 24 Preform stage 3: The desired shape of the workpiece at the end of the third preforming stage is shown in figure 30. Again, the final stage of the previous simulation is used as the starting point for this simulation. The mesh and dies used in the third preforming stage are shown in figure 31. According to the simulation, it takes 3.6 tons (8 klbf) to carry out the third preforming step. As seen in figure 32 and figure 33, there is no evidence of a forming defect. The maximum strain in the third preforming occurs at around the edge of the bottom surface of the part and is about 1.79. Figure 30: Third preform drawing and die-punch design
  • 25. 25 Figure 31: (left) Initial mesh used in the third preforming stage (right) die set used to carry out the third preforming stage Figure 32: Strain distribution in the third preform
  • 26. 26 Figure 33: Magnified view of last step of 3rd preform (no forming defect found) Final stage 4: The first step of the final step in the forging process was carried over from the results of the previous simulation. The desired shape of the forging is shown in figure 34 and the mesh and dies used in the forming process are shown in figure 35. The predicted load to carry out this stage of the forming is 72.5 tons (160 klbf) and no folding defect was observed for this forming process. Figure 36 and figure 37 show forming load and strain distribution for the final stage. Load goes up just before the final step to fill the corners of the die cavity. The maximum strain in the final forming occurs at around the center of the part and is about 1.79 according to this model of the forging process.
  • 27. 27 Figure 34: Final forming drawing and die-punch design Figure 35: (left) Initial mesh used in the final stage (right) die set used to carry out the final stage
  • 28. 28 Figure 36: Strain distribution of the 630th step of fourth preform Figure 37: Magnified view of the final forming stage (no forming defect found)
  • 29. 29
  • 30. 30 Chapter 3 Forging Progression Alternatives for Part # 2 3.1 Alternative progression- I In this alternative progression sequence the bolt shank is formed in two stages, one preform stage and final stage. Preform stage: The first simulation was set up by considering the first stage of forging as a simple two die system, a fixed bottom die and a moving punch. The dimensions of the original billet and the desired shape of the part at the end of the first preform is shown in figure 38. The workpiece was meshed with about 2000 elements, as shown in figure39, and a clear picture of the die set used in the first operation can be seen in figure 39. The predicted load required to form the first preform is about 100 ton (225 klbf) and there is no evidence of defects at this stage in the forming process (see figure 40 and figure 41). The punch load goes up just before the final step to fill the corners of the die cavity. As seen in Figure 40, the punch load increase from 145klb to 225llbf at the final stroke. Figure 38: Initial billet and 1st stage preform dimensions
  • 31. 31 Figure 39: (left) Initial mesh used in the first preforming stage (right) die set used to carry out the first preforming stage Figure 40: Load and strain distribution at the final punch stroke of the preforming stage
  • 32. 32 Figure 41: Magnified view of final step of first preforming (no forming defect found) Final state: The final stage of the previous simulation is used as the starting point for this simulation. The mesh and dies used in the third preforming stage are shown in figure 43. According to the simulation, it takes 139 tons (307 klbf) to carry out the third preforming step, Figure 44. It should be noted that the load goes up from 150klbf to 305 klbf just before the final step to fill the corners of the die cavity. The strain map figures (Figs 44 and 45) show no evidence of a forming defect. The maximum strain of 2.63 occurs at the center of the backward extruded cup.
  • 33. 33 Figure 42: Final forming drawing Figure 43: (left) Initial mesh used in the final stage (right) die set used to carry out the final forming operation
  • 34. 34 Figure 44: Load and strain distribution of the 496th step of final forming stage Figure 45: Magnified view of final step of forming (no forming defect found)
  • 35. 35 3.2 Progression Alternative - II In this alternative progression sequence the bolt shank is formed in three stages, 1st preform, 2nd preform and final stage. Preform stage 1: The first simulation was set up by considering the first stage of forging as a simple two die system, a fixed bottom die and a moving punch. The dimensions of the original billet and the desired shape of the part at the end of the first preform is shown in figure 46. The workpiece was meshed with about 2000 elements, as shown in figure 47, and a clear picture of the die set used in the first operation can be seen in figure 47. Note that in this alternative and small diameter billet is used. The predicted load required to form the first preform is 21 ton (46.7 klbf) and there is no evidence of defects at this stage in the forming process (see figure 48 and figure 49). A maximum effective strain of 1.58 was exhibited at this stage. Figure 46: initial billet and final stage of first preform
  • 36. 36 Figure 47: (left) Initial mesh used in the 1st preforming stage (right) die set used to carry out the 1st preforming stage Figure 48: Load and strain distribution in the 1st preform
  • 37. 37 Figure 49: Magnified view of last step of 1st preform (no forming defect found) Preform stage 2: The second preforming stage utilizes the geometry and strain from the final step of the simulation of the first preforming stage. The mesh and die set used to carry out this stage of the forming process is shown in figure 50. A load of 43 tons (95.1klbf) was required to form the second preform and there is still no evidence of forming defects, as can be seen in figure 51 and figure 52. The punch load slightly goes up just before the final step to fill the corners of the die cavity. The maximum strain in the second preforming occurs at around the edge of the bottom surface of the part and is about 1.93.
  • 38. 38 Figure 50: (left) Initial mesh used in the second preforming stage (right) die set used to carry out the second preforming stage Figure 51: Strain distribution in the second preform
  • 39. 39 Figure 52: Magnified view of last step of second preform (no forming defect found) Final stage: The final stage of the previous simulation is used as the starting point for this simulation. The mesh and dies used in the third preforming stage are shown in figure 54. According to the simulation, it takes 108 tons (239 klbf) to carry out the third preforming step. Load goes up just before the final step to fill the corners of the die cavity. Figures 55 and 56 show that at the end of the punch stroke there is no evidence of a forming defect. The maximum strain in the final stage occurs at around the center of the backward extruded cup and is about 3.01 (Figure 56). This strain is rather high for cold forging but it is localized at the center of the extruded cup.
  • 40. 40 Figure 53: Final forming drawing Figure 54: (left) Initial mesh used in the final stage (right) die set used to carry out the final stage
  • 41. 41 Figure 55: Load and strain distribution in the final forming operation Figure 56: Magnified view of last step of final forming operation (no forming defect found)
  • 42. 42 3.3 Progression Alternative -III (Baseline given by Nelson) In this alternative progression sequence the bolt shank is formed in four stages; 1st preform, 2nd preform, 3rd and final stage. Preform stage 1: The first simulation was set up by considering the first stage of forging as a simple two die system, a fixed bottom die and a moving punch. The dimensions of the origonal billet and the desired shape of the part at the end of the first preform is shown in figure 57. The workpiece was meshed with about 2000 elements, as shown in figure 58, and a clear picture of the die set used in the first operation can be seen in figure 58. The predicted load required to form the first preform is 21.5 ton (47.4 klbf) and there is no evedence of defects at this stage in the forming process (see figure 59 and figure 60). Figure 57: initial billet and final stage of first preform
  • 43. 43 Figure 58: (left) Initial mesh used in the first preforming stage (right) die set used to carry out the first preforming stage Figure 59: Load and strain distribution in the 1st preform
  • 44. 44 Figure 60: Magnified view of last step of first preform (no forming defect found) Preform stage 1 (repeat): The first simulation (following given baseline) was repeated due to inconsistant strain rate comparing to strain rate of first preform simulation (given baseline design for part-1) of part-1 (Figure 24). For this step maximum strain for part-1 was 1.71 but for part-2 it is 1.33 which is considerablly lowar then part-1 first preform strain. To analyse this issure we repeat this simulation again. Simulation was set up as a simple two die system, a fixed bottom die and a moving punch. The dimensions of the origonal billet and the desired shape of the part at the end of the first preform is shown in figure 57. The workpiece was meshed with about 2000 elements, as shown in figure 61, and a clear picture of the die set used in the first operation can be seen in figure 61. The predicted load required to form the first preform is 97 ton (213 klbf) (previous step’s load and strain was 48.7 klbf and 1.55 in/in respectively) and there is no evedence of defects at this stage in the forming process (see figure 62 and figure 63).
  • 45. 45 Figure 61: (left) Initial mesh used in the first preforming stage (right) die set used to carry out the first preforming stage Figure 62: Load and strain distribution in the 1st preform
  • 46. 46 Figure 63: Magnified view of last step of first preform (no forming defect found) Strain comparison of preform1 of part-1 and part-2: Figure 64: (a) first preform of part-2 (b) repeated first preform of part-2 (c) first preform of part - 1 (figure 24) Part -2 Part -2 Part -1
  • 47. 47 In Figure 64 shows the strain distribution of (a) first preform of part-2, (b) repeated first preform of part-2 and (c) first preform of part -1. In this three figure parts are extruding from .615 starting diameter to .430 finish diameter but the maximum strains are not same. Strain concentretration at the bottom corner of the bolt shank (Figure 64 –(b) and (c)) incraced the maximum strains but strain distributions along the bolt shank (~ 1.33 in/in) are similer for all the preforms which confirm the consistancy of forming process. We repeated the all the preforming process of part-2 (folloing given basieline design) to see the reproducebility of the process. Repeated preforms for part-2 are discuss at the end of this chapter. Preform stage 2: The second preforming stage utilizes the geometry and strain from the final step of the simulation of the first preforming stage. The desired geometry of the second preform is shown in figure 65. The mesh and die set used to carry out this stage of the forming process is shown in figure 66. A load of 117.5 tons (259 klbf) was required to form the second preform and there is still no evidence of forming defects, as can be seen in figure 67 and figure 68. Load goes up just before the final step to fill the corners of the die cavity. The maximum strain in the second preforming occurs at the center of the backward extruded and is about 1.71. Figure 65: Second preform drawing and die-punch design
  • 48. 48 Figure 66: (left) Initial mesh used in the second preforming stage (right) die set used to carry out the second preforming stage Figure 67: Load and strain distribution in the second preform
  • 49. 49 Figure 68: Magnified view of last step of second preform (no forming defect found) Preform stage 3: The desired shape of the workpiece at the end of the third preforming stage is shown in figure 69. Again, the final stage of the previous simulation is used as the starting point for this simulation. The mesh and dies used in the third preforming stage are shown in figure 70. According to the simulation, it takes 43 tons (95.2 klbf) to carry out the third preforming step. Figures 71 and 72 show that at the end of the third simulation, there is no evidence of a forming defect. The maximum strain in the third preforming occurs at the center of the backward extruded cup and is about 2.97.
  • 50. 50 Figure 69: Third preform drawing and die-punch design
  • 51. 51 Figure 70: (left) Initial mesh used in the third preforming stage (right) die set used to carry out the third preforming stage Figure 71: Load and strain distribution in the third preform
  • 52. 52 Figure 72: Magnified view of last step of third preform (no forming defect found) Final forming stage: The first step of the final step in the forging process was carried over from the results of the previous simulation. The desired shape of the forging is shown in figure 69 and the mesh and dies used in the forming process are shown in figure 73. The predicted load to carry out this stage of the forming is 90 tons (199 klbf) and no folding defect was observed for this forming process as shown in figures 74 and 75. Load goes up just before the final step to fill the corners of the die cavity. The maximum strain in the final forming occurs at around the center of the backward extruded section and is about 3.69 according to this model of the forging process. The maximum strain exhibited in this alternative progression is rather high for cold forming. It should be noted that the same progression was used for Part # 1. But the maximum strain induced for Part # 1, was relatively low.
  • 53. 53 Figure 73: Final forming drawing and die-punch design Figure 75: (left) Initial mesh used in the final stage (right) die set used to carry out the final stage
  • 54. 54 Figure 74: Load and strain distribution of the 896th step of final forming stage Figure 76: Magnified view of final forming stage (no forming defect found)
  • 55. 55 3.3 Repeated Simulation of Progression Alternative -III (Baseline given by Nelson) In this alternative progression sequence the bolt shank is formed in four stages; 1st preform, 2nd preform, 3rd and final stage. Repeated preform stage 1. The first simulation was set up as a simple two die system, a fixed bottom die and a moving punch. The dimensions of the origonal billet and the desired shape of the part at the end of the first preform is shown in figure 77. The workpiece was meshed with about 2000 elements, as shown in figure 78, and a clear picture of the die set used in the first operation can be seen in figure 78. The predicted load required to form the first preform is 22 ton (47.4 klbf) and there is no evedence of defects at this stage in the forming process (see figure 79 and figure 80). Figure 77: initial billet and final stage of first preform
  • 56. 56 Figure 78: (left) Initial mesh used in the first preforming stage (right) die set used to carry out the first preforming stage
  • 57. 57 Figure 79: Load and strain distribution in the 1st preform Figure 80: Magnified view of last step of first preform (no forming defect found) Preform stage 2: The second preforming stage utilizes the geometry and strain from the final step of the simulation of the first preforming stage. The desired geometry of the second preform is shown in figure 81. The mesh and die set used to carry out this stage of the forming process is shown in figure 82. A load of 112 tons (248 klbf) was required to form the second preform and there is still no evidence of forming defects, as can be seen in figure 83 and figure 84. Load goes up just before the final step to fill the corners of the die cavity. The maximum strain in the second preforming occurs at the center of the backward extruded and is about 2.08.
  • 58. 58 Figure 81: Second preform drawing and die-punch design Figure 82: (left) Initial mesh used in the second preforming stage (right) die set used to carry out the second preforming stage
  • 59. 59 Figure 83: Load and strain distribution in the second preform Figure 84: Magnified view of last step of second preform (no forming defect found)
  • 60. 60 Preform stage 3: The desired shape of the workpiece at the end of the third preforming stage is shown in figure 85. Again, the final stage of the previous simulation is used as the starting point for this simulation. The mesh and dies used in the third preforming stage are shown in figure 86. According to the simulation, it takes 43 tons (93.4 klbf) to carry out the third preforming step. Figures 87 and 88 show that at the end of the third simulation, there is no evidence of a forming defect. The maximum strain in the third preforming occurs at the center of the backward extruded cup and is about 2.92. Figure 85: Third preform drawing and die-punch design
  • 61. 61 Figure 86: (left) Initial mesh used in the third preforming stage (right) die set used to carry out the third preforming stage Figure 87: Load and strain distribution in the third preform
  • 62. 62 Figure 88: Magnified view of last step of third preform (no forming defect found) Final forming stage: The first step of the final step in the forging process was carried over from the results of the previous simulation. The desired shape of the forging is shown in figure 89 and the mesh and dies used in the forming process are shown in figure 80. The predicted load to carry out this stage of the forming is 79 tons (176 klbf) and no folding defect was observed for this forming process as shown in figures 91 and 92. Load goes up just before the final step to fill the corners of the die cavity. The maximum strain in the final forming occurs at around the center of the backward extruded section and is about 3.23 according to this model of the forging process. The maximum strain exhibited in this alternative progression is rather high for cold forming. It should be noted that the same progression was used for Part # 1. But the maximum strain induced for Part # 1, was relatively low.
  • 63. 63 Figure 89: Final forming drawing and die-punch design Figure 90: (left) Initial mesh used in the final stage (right) die set used to carry out the final stage
  • 64. 64 Figure 91: Load and strain distribution of the 896th step of final forming stage Figure 92: Magnified view of final forming stage (no forming defect found)
  • 65. 65
  • 66. 66 Chapter 4 Conclusions A number of simulations were carried out to determine potential progression sequences for both Part 1 and Part 2. This report, however, presents three alternative progressions for each part. The presented progressions were carefully studied to ensure that there is no defect. Tables 1 and 2 give the maximum strain values and punch loads exhibited in all the forming stages. *- A previous step with strain of 1.79 was used in the next simulation. Table 1: Forging summary for Part -1 Progression variants Maximum load (klbf) Maximum strain (in/in) Alternative # 1 Preform - 1 228 2.16 Final stage 292 2.16 Alternative # 2 Preform - 1 65.9 1.38 Preform - 2 137 1.65 Final stage 239 3.11 Alternative # 3 (baseline provided by Nelson) Preform - 1 191 1.71 Preform - 2 187 2.00* Preform - 3 8 1.79 Final stage 160 1.79 Table 2: Forging summary for Part -2 Progression Variants Maximum load (klbf) Maximum strain (in/in) Alternative # 1 Preform - 1 225 2.25 Final stage 307 2.63 Alternative # 2 Preform - 1 46.7 1.58 Preform - 2 95.1 1.93 Final stage 239 3.01 Repeated preforms Alternative # 3 (baseline provided by Nelson) Preform - 1 47.4 1.33 1.33 Preform - 2 259 1.71 2.08 Preform - 3 95.2 2.97 2.92 Final stage 199 3.69 3.23