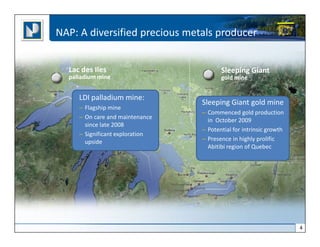
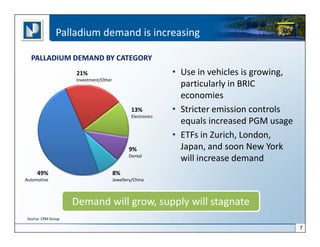
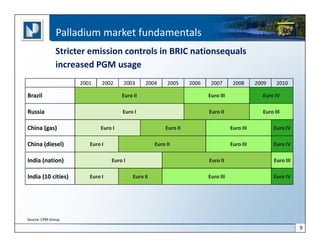
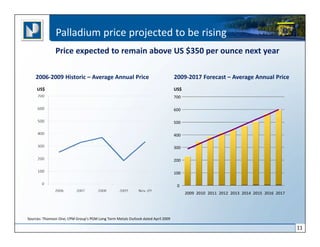
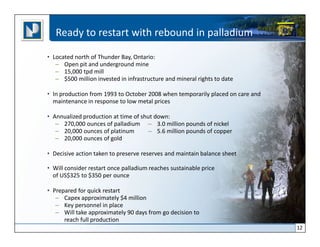
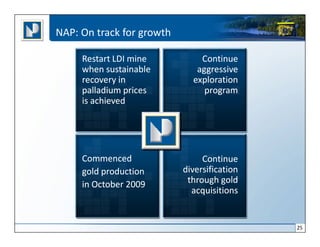
re-engineering the future

Investor Presentation
November 2009

William J. Biggar
President & Chief Executive Officer
Forward-Looking Statements
Certain information included in this presentation, including any information as to our future financial or operating
performance and other statements that express management's expectations or estimates of future performance,
constitute ‘forward-looking statements’ within the meaning of the ‘safe harbor’ provisions of the United States
Private Securities Litigation Reform Act of 1995 and Canadian securities laws. The words ‘expect’, ‘believe’, ‘will’,
‘intend’, ‘estimate’ and similar expressions identify forward-looking statements. Forward-looking statements are
necessarily based upon a number of estimates and assumptions that, while considered reasonable by
management, are inherently subject to significant business, economic and competitive uncertainties, risks and
contingencies. The Company cautions the reader that such forward-looking statements involve known and
unknown risks, uncertainties and other factors that may cause the actual financial results, performance or
achievements of North American Palladium to be materially different from the Company’s estimated future results,
performance or achievements expressed or implied by those forward-looking statements and that the forward-
looking statements are not guarantees of future performance. These statements are also based on certain factors
and assumptions. For more details on these estimates, risks, assumptions and factors, see the Company’s most
recent Form 40-F/Annual Information Form on file with the U.S. Securities and Exchange Commission and Canadian
provincial securities regulatory authorities. In addition, there can be no assurance that the Company’s Lac des Iles
or Sleeping Giant mines will be successfully restarted or that other properties can be successfully developed. The
Company disclaims any obligation to update or revise any forward-looking statements, whether as a result of new
information, events or otherwise, except as expressly required by law. Readers are cautioned not to put undue
reliance on these forward-looking statements.


All dollar amounts in Canadian currency unless otherwise stated.


                                                                                                                        2
NAP: An attractive investment

Delivering on vision to build a diversified mid-tier precious
metals company operating in mining-friendly jurisdictions
World class palladium mine offers significant leverage
to the rising palladium price
Renewed commitment to exploration at Lac des Iles
Commenced gold production at Sleeping Giant mine
Focused on acquiring additional gold assets to grow
gold production to 250,000 ounces
Experienced management and technical teams
Strong balance sheet: over $100 M in cash, no debt

                                                                3
NAP: A diversified precious metals producer


  Lac des Iles                          Sleeping Giant
  palladium mine                        gold mine


     LDI palladium mine:
                                 Sleeping Giant gold mine
     – Flagship mine
                                 – Commenced gold production
     – On care and maintenance
                                   in October 2009
       since late 2008
                                 – Potential for intrinsic growth
     – Significant exploration
       upside                    – Presence in highly prolific
                                   Abitibi region of Quebec


                                                                    4
A liquid stock
                 Stock symbol            NYSE Amex – PAL
                                         TSX – PDL
                 Share price             US $2.87

                 Shares outstanding      127M (154M fully diluted*)
                 Market capitalization   US $364M (US $442M fully diluted)
                 Three-month average     NYSE Amex – 1,030,722
                 daily trading volume    TSX – 352,261
                 2008 high/low           US$9.28/$0.91
                 2009 high/low           US$3.60/$1.14
                 Shareholder base        Institutional – 53%
                                         Retail – 47%
                 Major shareholder       Kaiser Francis Oil Company (30%)
Information as at November 12, 2009
* For details, please see Appendix.
                                                                             5
Palladium: a key value driver
 Supply: limited production

                                             RUSSIA
                                             44%
                                             44%
NORTH AMERICA
   14%
   14%

                      6.5 M oz.
                total worldwide production

                    SOUTH AFRICA
                       38%

                                                      6
Palladium demand is increasing

  PALLADIUM DEMAND BY CATEGORY
                     21%                                       • Use in vehicles is growing,
                     Investment/Other
                                                                 particularly in BRIC
                                                                 economies
                                                 13%           • Stricter emission controls
                                                 Electronics
                                                                 equals increased PGM usage
                                                               • ETFs in Zurich, London,
                                               9%                Japan, and soon New York
                                               Dental
                                                                 will increase demand
      49%                               8%
Automotive                              Jewellery/China


                     Demand will grow, supply will stagnate
 Source: CPM Group

                                                                                               7
Palladium market fundamentals
               Global light vehicle production forecast
 (OOOs)

                                                                 78 M   79 M
                                                          76 M
                                                   73 M
                65 M                        67 M
                                     60 M
                              52 M


Source: CSM Worldwide, March 2009

                                                                               8
Palladium market fundamentals
              Stricter emission controls in BRIC nationsequals
              increased PGM usage
                    2001    2002     2003     2004      2005      2006    2007       2008      2009    2010

Brazil                              Euro II                              Euro III                Euro IV

Russia                              Euro I                               Euro II                 Euro III

China (gas)                Euro I                       Euro II                     Euro III          Euro IV

China (diesel)         Euro I                      Euro II                          Euro III          Euro IV

India (nation)                  Euro I                                   Euro II                      Euro III

India (10 cities)      Euro I            Euro II                         Euro III                     Euro IV


Source: CPM Group

                                                                                                                 9
Palladium market fundamentals
   Growth in Palladium ETFs


Increasingly viewed as an attractive precious metal
         providing portfolio diversification

                                                      10
Palladium price projected to be rising
               Price expected to remain above US $350 per ounce next year

    2006-2009 Historic – Average Annual Price                                     2009-2017 Forecast – Average Annual Price
     US$                                                                          US$
                                                                                  700

                                                                                  600

                                                                                  500

                                                                                  400

                                                                                  300

                                                                                  200

                                                                                  100

                                                                                   0
                                                                                        2009 2010 2011 2012 2013 2014 2015 2016 2017


Sources: Thomson One; CPM Group’s PGM Long Term Metals Outlook dated April 2009

                                                                                                                                       11
Ready to restart with rebound in palladium

• Located north of Thunder Bay, Ontario:
   – Open pit and underground mine
   – 15,000 tpd mill
   – $500 million invested in infrastructure and mineral rights to date

• In production from 1993 to October 2008 when temporarily placed on care and
  maintenance in response to low metal prices

• Annualized production at time of shut down:
   – 270,000 ounces of palladium – 3.0 million pounds of nickel
   – 20,000 ounces of platinum       – 5.6 million pounds of copper
   – 20,000 ounces of gold

• Decisive action taken to preserve reserves and maintain balance sheet

• Will consider restart once palladium reaches sustainable price
  of US$325 to $350 per ounce

• Prepared for quick restart
   – Capex approximately $4 million
   – Key personnel in place
   – Will take approximately 90 days from go decision to
      reach full production
                                                                                12
LDI: A world class mine

                             Open pit


                        Roby
                        Underground
                        Zone


                    Offset Zone


                                  0 __________600 m


                                                      13
A new focus on exploration at LDI


             • $7.0 million exploration program for 2009
             • Working to add to 3.7 million ounces of measured
               and indicated palladium resources*
             • Increase grade of upper portion of Offset Zone
             • Discover new resources on surface
               and underground


* See cautionary note to U.S. Investors in Appendix.

                                                                  14
Extending LDI’s minelife:
 2 new discoveries in 2009


• Two new underground PGM discoveries (Cowboy & Outlaw
  zones)
• Discovered during infill drilling of Offset Zone
• Cowboy is located 30 to 50 metres from Offset Zone,
  extends 250 metres along strike, 350 metres down dip and
  is open in all directions
• Outlaw is located 50 to 75 metres from Cowboy Zone
• Additional drilling underway
• Potential near-surface discovery (West Pit)


  Potential to add at least 10 years of mine life
                                                             15
Two new zones: Cowboy and Outlaw


Additional mineralization has the potential to increase resources
                                                                    16
Discovering additional surface targets

                North
                VT Rim


        North
         Pit


West
Pit


                                         17
Building a gold division: Acquiring Sleeping Giant


• A key step in growing NAP:
    – Reduces risk associated with a single mine operation
    – Bullish on gold
    – Focus on precious metals increases shareholder value
• Completed acquisition of Cadiscor Resources in May 2009 for
  $32 million in an all-share transaction
• First step in NAP’s evolution into a diversified precious metals
  producer
• The Sleeping Giant Mine provides good platform from which to
  grow and expand


  Aim is to build gold division to production of
    approximately 250,000 ounces per year
                                                                     18
Sleeping Giant mine: a foundation for growth


             • 100% owned Sleeping Giant gold mine is located
               northwest of Val d’Or, Quebec in prolific Abitibi region
             • Contained mineralization of 153,000 gold ounces*
             • Previously operated by IAMGOLD, Sleeping Giant
               produced an average of 58,000 ounces of gold over
               last five years
             • Cumulative production of 1 million ounces over
               20 years at an average grade of 11.4 g/t gold


* See cautionary note to U.S. Investors in Appendix.

                                                                          19
First gold poured at Sleeping Giant on Oct. 6

                                                                  • Annual production expected to be
                                                                    50,000 ounces per year with cash
                                                                    cost in the range of US $450 to $500
                                                                    per ounce*
                                                                  • Production restart cost
                                                                    approximately $7.5 million
                                                                  • Full complement of employees on
                                                                    site
                                                                  • Mill was refurbished on time and on
                                                                    budget

                                                                      On track and budget for achieving
                                                                     commercial production in early 2010

* Non-GAAP performance measure. For further information, please see pages 22-23 of the Company’s Second Quarter 2009 Report.

                                                                                                                               20
Potential to grow through exploration

     0                                  0


   500                                  500


  1000                                  1000


  1500                                  1500


                                               21
Discovery: A potential source of additional production


                                                       • 237,000 measured
                                                         and indicated gold ounces*
                                                       • 294,000 inferred gold ounces*
                                                       • Process ore at Sleeping Giant
                                                         mill, which is 70 km away via
                                                         established logging roads
                                                       • August 2008 PEA identified
                                                         44,000 ounces of gold
                                                         production per year over 4-
                                                         year mine life


* See cautionary note to U.S. Investors in Appendix.

                                                                                         22
Eight properties that include 70 km of favourable
geology in 1182 claims over 48,699 hectares


                                          Discovery
                                       Cameron Shear JV
                                          Florence
                                           Flordin


     Harricana North


                            Laflamme


                                                          23
Acquisition: The external growth driver


• Build on presence in Abitibi region of Quebec with
  a focus on gold companies with near-term
  production potential
• Focus on North and South American opportunities
• Disciplined approach that maintains balance sheet
  strength
• Leverage management strengths and expertise


                                                       24
NAP: On track for growth

     Restart LDI mine          Continue
     when sustainable         aggressive
     recovery in             exploration
     palladium prices           program
     is achieved


     Commenced                  Continue
     gold production       diversification
     in October 2009        through gold
                             acquisitions


                                             25
Shareholder information

North American Palladium’s vision is to build a mid-tier diversified precious metals company
operating in mining friendly jurisdictions. Highly leveraged to palladium, the Company is building
on its exposure to gold, and focused on acquiring high quality near-term producing gold assets.
NAP’s experienced management and technical teams have a renewed commitment to exploration
and are dedicated to building shareholder value.

Corporate office:      130 Adelaide Street West, Suite 2116
                       Toronto, Ontario M5H 3P5

Stock Symbols:         NYSE Amex – PAL
                       TSX – PDL

Website:               www.nap.com

Investor Relations:    Annemarie Brissenden
                       Director, Investor Relations
                       abrissenden@nap.com
                       416 -360-7971 ext. 226


                                                                                                     26
re-engineering the future

Investor Presentation
November 2009

Appendices and further information
Appendices – Table of Contents


•   Senior management                slides 29 to 30
•   Board of directors               slides 31 to 34
•   Capitalization                          slide 35
•   Exploration slides               slides 36 to 38
•   Sleeping Giant: History                 slide 40
•   Reserves and resources           slides 41 to 46


                                                       28
Senior management

Bill Biggar – President and CEO
An accomplished businessman with extensive experience in mining and in a broad range of
industries. Mr. Biggar has held senior positions with Barrick Gold Corporation, Horsham
Corporation and Magna International. He also has over 12 years of experience as an
investment banker and private equity investor.
Jeff Swinoga – Vice President, Finance and CFO
Eighteen years of experience in the resource, mining and finance industries. Mr. Swinoga
has held CFO positions with HudBay Minerals and MagIndustries, and was Director, Treasury
Finance of Barrick Gold Corporation for seven years.

Dave Passfield – Vice President, Operations
A professional engineer by training, Mr. Passfield has 30 years experience in open-pit and
underground operations. Mr. Passfield has held key management positions with several
major Canadian and international mining companies and has operating experience in
Canada and overseas.


                                                                                             29
Senior management

Michel Bouchard – Vice President, Exploration and Development
Mr. Bouchard has been involved in exploration, development, and operations in the mining
industry for the past 25 years. He is credited with contributing to the discovery of the
Bouchard Hebert Mine in northwest Quebec. Previously Mr. Bouchard held senior positions
with Audrey Resources, Lyon Lake Mines and SOQUEM. Mr. Bouchard was formerly
President and CEO of Cadiscor Resources Inc.

Trent Mell – Vice President, Corporate Development and General Counsel
Mr. Mell joined NAP in 2007, having previously worked at the corporate head offices of
Barrick Gold Corporation and Sherritt International. Prior to joining the mining industry, Mr.
Mell worked with Stikeman Elliott LLP, where he practiced securities law. Mr. Mell has also
published papers on NI 43-101, and holds a B.A., a B.C.L. (with distinction) and a LL.B. (with
distinction), all from McGill University, as well as a Masters degree in Securities Law from
Osgoode Hall Law School.


                                                                                                 30
Board of Directors

André J. Douchane, Chairman
A mining engineer with over 35 years of mining experience managing precious metals operations,
Mr. Douchane was appointed to the Company’s Board of Directors in April 2003. In addition to
serving on the board of Osisko Mining Corporation, Mr. Douchane is the President and Chief
Executive Officer of Starfield Resources Inc., an exploration and development company operating
in Nunavut, Canada. Mr. Douchane previously served as North American Palladium’s President and
Chief Executive Officer from April 2003 to January 2006, and has held senior management
positions with several international publicly-traded precious metal mining companies including
Vice President, Operations of Franco and Euro-Nevada (Newmont Mining Corporation).

Steven R. Berlin
Mr. Berlin was appointed to the Board of Directors of the Company in February 2001, and is also a
director of Orchids Paper Products, an AMEX listed company. At the end of 2005, Mr. Berlin retired
from his position as Vice-President of KFOC where he worked part-time for two years following
four years of full-time work as Vice-President and Chief Financial Officer. Prior to joining KFOC, Mr.
Berlin taught at the University of Tulsa for three years where he also served a year as acting
associate Dean of the College of Business and acting Director of the School of Accounting. Before
joining the University of Tulsa, Mr. Berlin spent 25 years with Citgo Petroleum Corporation, where
he retired as Senior VP Finance and Administration and Chief Financial Officer. Mr. Berlin has a
bachelor’s degree from Duquesne University, an MBA from the University of Wisconsin Madison
and has completed the Executive Management program at Stanford University.

                                                                                                         31
Board of Directors

Bill Biggar – President and CEO
An accomplished businessman with extensive experience in mining and in a broad range of
industries. Mr. Biggar has held senior positions with Barrick Gold Corporation, Horsham
Corporation and Magna International. He also has over 12 years of experience as an investment
banker and private equity investor.

C. David A. Comba
Mr. Comba, who has over four decades of experience as an exploration advocate and senior
mining executive, was appointed to the Company’s Board of Directors in March 2006. As Chief
Exploration Geologist of Falconbridge Limited in Sudbury, Ontario, he led the team that discovered
the Thayer Lindsley mine. Prior to its takeover by Kinross Gold Corporation, Mr. Comba was Vice-
President, Exploration of Falconbridge Gold Corporation. Following the takeover, he became
President and Chief Executive Officer of a Kinross-controlled junior exploration company listed on
the TSX. Mr. Comba was Director of Issues Management with the Prospectors and Developers
Association of Canada from 1998 to 2005, during which time he led the successful lobby effort for
the re-introduction of enhanced or “super” flow-through shares. Mr. Comba has Bachelor’s and
Masters’ degrees in geology from Queen’s University in Kingston, Ontario.


                                                                                                     32
Board of Directors

Robert J. Quinn
A founding partner of the Houston mining transactional law firm Quinn & Brooks LLP, Mr. Quinn
has over 25 years of legal and management experience, including as Vice President and General
Counsel for Battle Mountain Gold Company. Appointed to the Board of Directors of the Company
in June 2006, he has extensive experience in M&A transactions, corporate governance, public
disclosure, governmental affairs, environmental law and land management. Mr. Quinn has a
Bachelor of Science degree in Economics from the University of Denver, a juris doctorate degree
from the University of Denver College of Law and has completed two years of graduate work in
mineral economics at the Colorado School of Mines.
Greg J. Van Staveren, CA, CPA
Mr. Van Staveren is the President of Strategic Financial Services, a private consulting company
providing business advisory services. Appointed to the Board of Directors of the Company in
February 2003, Mr. Van Staveren is an independent director on the board of two other public
companies and part-time Chief Financial Officer for Starfield Resources Inc. (SRU:TSX) and AIM
Health Group Inc. (AHG:TSX). He was the Chief Financial Officer of MartinRea International Inc.
(MRE:TSX) from 1998 to September 2001, and provided accounting and advisory services until
1998 as a partner of KPMG, which he joined in 1980. Mr. Van Staveren is a Chartered Accountant
and a Certified Public Accountant and holds a Bachelor of Math (Honours) degree from the
University of Waterloo.


                                                                                                  33
Board of Directors

William J. Weymark, P.Eng.
Appointed to the Board of Directors of the Company in January 2007, Mr. Weymark is President of
Weymark Engineering Ltd., a Company providing consulting services to businesses in the private
equity, construction and resource sector. He is also a director of Tirex Resources Ltd. (TXX:TSX-V),
the VGH & UBC Hospital Foundation Board, and several private companies. Mr. Weymark is active
with the BC Lions as a Founder of their business association and a Member of the Industry
Advisory Committee for the Norman B. Keevil Institute of Mining Engineering at the University of
British Columbia. Until June 2007, Mr. Weymark was President and CEO of Vancouver
Wharves/BCR Marine, a transportation firm located on the west coast of British Columbia. Prior to
joining Vancouver Wharves in 1991, Mr. Weymark spent 14 years in the mining industry
throughout western Canada working on the start-up and operation of several mines.


                                                                                                       34
Capitalization

                                                                                                      Potential
                                                                          Number          Price
                                                                                                      Proceeds

               Common Shares Outstanding 1                             127,383,000

               Stock Options 2                                           2,407,100    $    4.02   $   9,700,000
               Warrants 2
                                                                                         4.25 to
               (expiring December 2009 to
                                                                        25,120,000   US $10.73 3 $ 134,500,000
               September 30, 2011)

               Total                                                   154,910,000                $ 144,200,000


              •       27.5 million warrants and options outstanding
              •       10.7 million expire December 13, 2009

1 As at November 12, 2009.
2 As at September 30, 2009.
3 Warrants in both US$ and C$. U$ converted at rate of $1.05 CDN/US.


                                                                                                                  35
Longitudinal section showing Phase 1 and 2
drillhole intercepts
                  Underground development


                        View looking west


                                             36
Interpreted geological cross section 505N
of the Offset Zone


                                            37
Interpreted longitudinal section of the Cowboy Zone


                                                      38
West Pit Area: Phases 1 and 2


        507N Pod


                   Quartz
                   Diorite


                                39
Sleeping Giant: History
1984 to 1987:                                                 Oct. 2007:
Peron Gold Mines                                              Cadiscor signs
(now Aurizon) sinks                                           option to acquire
two shafts                                                    SG and begins        Oct. 2008:
                    1991:
                                                              underground drill    Ownership transferred
                    Cambior acquires
                                                              campaign to          to Cadiscor
                    50% by investing
                                                              identify new
                    in drilling and     April 2005:                                                     May 2009:
                                                              reserves
                    underground work    Cambior acquires                                                NAP acquires Cadiscor
                                        second 50% from                                                 and continues
                                        Aurizon, becomes                                                operational restart
                                        sole owner


                                                    2006:
                                                    IAMGOLD
                                                    becomes owner,                                                  Oct. 6, 2009:
                                                    after acquiring                                                 First gold pour
                                                    Cambior                                    April 2009:
                                                                                               Cadiscor commences
                               1993:                                                           restart
                               Production resumes
                                                                         Sept. 2008:
                                                                         Cadiscor releases
          1988 to 1990:                                                  NI 43-101 report
          Commercial production until                                    indicating new reserves and
          reserves thought depleted                                      resources for 3 years of production


                                                                                                                                      40
Appendix – Resources and Reserves

     1.    Cautionary Note to U.S. Investors Concerning Mineral Reserves and Mineral
           Resources
     2.    Lac des Iles mine
           Mineral Resource Summary – December 31, 2008
     3.    Lac des Iles mine – Offset Zone
           Estimated Mineral Resource – January 20, 2009
     4.    Sleeping Giant mine
           Statement of Reserves and Resources – October 2008
     5.    Discovery Project
           Mineral Resources – August 1, 2008

Dr. William E. Stone, P. Geo, Vice President, Exploration for North American Palladium Ltd., is the
Qualified Person who supervised the preparation of the technical data in this presentation.

Please refer to North American Palladium’s Annual Information Form for the year ended
December 31, 2008 and applicable technical reports available on www.sedar.com, www.sec.gov
and www.nap.com for further information.

                                                                                                      41
Cautionary Note to U.S. Investors Concerning
  Mineral Reserves and Mineral Resources


Mineral reserves and mineral resources have been calculated in accordance with National
Instrument 43-101 as required by Canadian securities regulatory authorities. For United
States reporting purposes, Industry Guide 7, (under the Securities and Exchange Act of
1934), as interpreted by Staff of the SEC, applies different standards in order to classify
mineralization as a reserve. In addition, while the terms “measured”, “indicated” and
“inferred” mineral resources are required pursuant to National Instrument 43-101, the U.S.
Securities and Exchange Commission does not recognize such terms. Canadian standards
differ significantly from the requirements of the U.S. Securities and Exchange Commission,
and mineral resource information contained herein is not comparable to similar information
regarding mineral reserves disclosed in accordance with the requirements of the U.S.
Securities and Exchange Commission. U.S. investors should understand that “inferred”
mineral resources have a great amount of uncertainty as to their existence and great
uncertainty as to their economic and legal feasibility. In addition, U.S. investors are
cautioned not to assume that any part or all of NAP's mineral resources constitute or will be
converted into reserves. For a more detailed description of the key assumptions, parameters
and methods used in calculating NAP’s mineral reserves and mineral resources, see NAP’s
most recent Annual Information Form/Form 40-F on file with Canadian provincial securities
regulatory authorities and the U.S. Securities and Exchange Commission.


                                                                                                42
Lac des Iles mine
               Mineral Resource Summary – December 31, 2008

                                           Tonnes              Pd              Pt           Au              Cu            Ni          PdEq            Pd
              Location
                                           (000’s)           (g/t)          (g/t)         (g/t)            (%)           (%)          (g/t)      (000 oz)
              Measured Resources
              Roby Open Pit                  3,722           1.99           0.23           0.17         0.075          0.065           3.77           238
              Roby Stockpiles                  763           2.09           0.19           0.18         0.060          0.079           3.79            51
              Indicated Resources
              Roby Open Pit                  2,565           2.20           0.24           0.18         0.078          0.068           4.07           181
              Roby RGO Stockpile            13,365           0.97           0.12           0.08         0.034          0.056           2.00           417
              Roby Underground               3,292           7.61           0.44           0.33         0.062          0.077         10.46            805

              Offset Underground            12,331           5.02           0.38           0.37         0.114          0.133           8.28         1,990
              Total M&I Resources           36,038           3.18           0.26           0.22         0.072          0.086           5.29         3,682
              Inferred Resources
              Offset Underground             4,637             4.9           0.4            0.3          0.12           0.13            8.0           730

Notes:
1. CIM definitions were followed for the estimation of Mineral Resources.
2. Mineral Resources for the Roby Open Pit were estimated at a cut-off grade of 1.8 g/t PdEq, within an optimized pit shell run below the current pit survey
   (October 2008).
3. Mineral Resources in stockpiles were estimated at a cut-off grade of 1.9 g/t PdEq.
4. Mineral Resources for the Roby and Offset Zones underground were estimated at a cut-off grade of 5.8 g/t PdEq.
5. Cut-off grades were determined under the assumption that a production rate of 14,000 tpd would be resumed in the event of restarting operations.
6. PdEq factors were calculated separately for each area, based on operating cost and metallurgical performance estimates appropriate for those areas.
7. Metal price assumptions of US $250/oz palladium, US$1,400/oz platinum, US$850/oz gold, US$6.50/lb nickel and US$2.00/lb copper were used in the
   estimation of Pd/Eq and cut-off grade. A US$/C$ exchange rate of 1.11 was used.
Please refer to North American Palladium’s Annual Information Form for the year ended December 31, 2008 and applicable technical reports filed on
www.sedar.com, www.sec.gov and www.nap.com for further information.

                                                                                                                                                               43
Lac des Iles mine – Offset Zone
             Estimated Mineral Resource – March 31, 2008


                         Tonnes               Pd             Pt             Au              Ni             Cu          PdEq             Pd
        Category
                       (millions)           (g/t)          (g/t)          (g/t)            (%)            (%)          (g/t)       (000 oz)
        Indicated            12.3            5.02           0.38           0.37           0.13           0.11           8.28          1,985
        Inferred               4.6           4.85           0.37           0.33           0.13           0.12             8.0           717


Notes:
1. Prepared by Mr. Ian T. Blakley, P. Geo and Senior Consulting Geologies for Scott Wilson Roscoe Postle Associates, an independent Qualified Person
   within the meaning of NI 43-101.
2. Palladium equivalency (PdEq) cut-off of 5.575 g/t, assuming long-term US$ metal prices of $300/oz Pd, $1,000/oz Pt, $850/oz Au, $7.00/lb Ni, $2.50/lb
   Cu and a US$/C$ echange rate of 1.10.
3. Resources were estimated to a maximum depth of 1,200 m.
4. Metal recovery assumptions of 80% Pd, 70% Pt, 75% Au, 40% Ni and 85% Cu were used in estimation of PdEq.

The Offset Zone resource estimate is available on www.sedar.com, www.sec.gov and www.nap.com.


                                                                                                                                                           44
Sleeping Giant mine
   Statement of Reserves & Resources – October, 2008


                                                       Tonnes                   Au                       Au
                     Type
                                                       (000’s)                (g/t)         Contained ounces
                     Reserves
                     Proven                           135,300                  9.3                       40,396
                     Probable                         100,000                  9.4                       30,177
                     Resources
                     Measured                          42,000                  8.7                       11,731
                     Indicated                        211,900                 10.3                       70,068


Notes:
1. CIM definitions were followed for the estimation of Mineral Resources and Reserves.
2. Mineral Resources that are not Mineral Reserves do not have demonstrated economic viability.
3. Mineral Reserves as stated can be produced at or below the production cost of CDN$850 per troy ounce.
   With an exchange rate of $1US=1.07 $CDN, this corresponds to a gold price of US $794 per troy ounce.
4. Reserve estimates are based on historical mine operating costs and gold recoveries at the mine.
   The estimated cost of each stope has included development costs based on current mine costs and per shift production.
5. A series of gold prices have been used to estimate reserves in a number of economic scenarios.
   The gold price has been modified in US$50 increments from US$750 to US$900 per troy ounce.

Please refer to the Technical Report titled “The Sleeping Giant Mine, Northwestern Quebec”, dated October 8, 2008 and prepared
by Genivar LP for further information. It is filed on www.sedar.com under Cadiscor Resources Inc.

Dr. Tyson C. Birkett, Eng. Ph.D., Josee Couture, Eng., and Christian Bezy, Geo, are the Qualified People who supervised the preparation
of the above technical data.


                                                                                                                                          45
Discovery Project
         Mineral Resources – August 1, 2008


                                                                                                   Au                  Au
                            Type                                       Tonnes
                                                                                                 (g/t)      (Contained Oz)
                            Mineral Resources
                            Measured                                     3,109                   8.95                    893

                            Indicated                              1,278,973                     5.74               235,682

                            Inferred                               1,545,500                     5.93               294,223
Notes:
1. CIM definitions were followed for the estimation of Mineral Resources and Reserves.
2. The Independent and Qualified Persons for the Mineral Resource estimates as defined by Regulation 43-101 is Carl Pelletier, B.Sc.,
    P.Geo., of InnovExplo Inc. The effective date of the estimate is June 17, 2008.
3. Mineral Resources, having demonstrated economic viability, are not Mineral Reserves.
4. Results are presented undiluted and in situ. The estimate included six (6) gold-bearing zones (“A”, “B”, “C”, “E”, “20” and “30”)
    and covers the Discovery Project area between sections 1+00E to 9+00W and 4+50E to 15+00E.
5. The resources were compiled using a cut-off grade of 3.0 g/t Au. This cut-off must be re-evaluated in light of present market conditions
    (gold price, exchange rate and mining cost). A fixed density of 2.82 g/cm3 was used. A minimum of 1.6 m horizontal width was applied,
    using the grade of the adjacent material when assayed, or a value of zero when not assayed. High grade capping was done on the raw data
    and established at 35.0 g/t Au. Drill hole compositing was not done. Resources were evaluated from drill hole results using a polygonal
    on longitudinal approach.
    Calculations used metric units (metre, tonnes and g/t Au).
    The company is not aware of any known environmental, permitting, legal, title, taxation, socio-political, marketing or other relevant issue
    that could materially affect the Mineral Resource estimates.

For further information, please refer to the report titled “Technical Report on the Scoping Study and Mineral Resource Estimate
for the Discovery Project (according to Regulation 43-101 and Form 43-101F1) dated August 1, 2008 and prepared by InnovExplo Inc.
It is filed on www.sedar.com under Cadiscor Resources Inc.


                                                                                                                                                  46

Nap inves pres_16nov2009

  • 1.
    re-engineering the future InvestorPresentation November 2009 William J. Biggar President & Chief Executive Officer
  • 2.
    Forward-Looking Statements Certain informationincluded in this presentation, including any information as to our future financial or operating performance and other statements that express management's expectations or estimates of future performance, constitute ‘forward-looking statements’ within the meaning of the ‘safe harbor’ provisions of the United States Private Securities Litigation Reform Act of 1995 and Canadian securities laws. The words ‘expect’, ‘believe’, ‘will’, ‘intend’, ‘estimate’ and similar expressions identify forward-looking statements. Forward-looking statements are necessarily based upon a number of estimates and assumptions that, while considered reasonable by management, are inherently subject to significant business, economic and competitive uncertainties, risks and contingencies. The Company cautions the reader that such forward-looking statements involve known and unknown risks, uncertainties and other factors that may cause the actual financial results, performance or achievements of North American Palladium to be materially different from the Company’s estimated future results, performance or achievements expressed or implied by those forward-looking statements and that the forward- looking statements are not guarantees of future performance. These statements are also based on certain factors and assumptions. For more details on these estimates, risks, assumptions and factors, see the Company’s most recent Form 40-F/Annual Information Form on file with the U.S. Securities and Exchange Commission and Canadian provincial securities regulatory authorities. In addition, there can be no assurance that the Company’s Lac des Iles or Sleeping Giant mines will be successfully restarted or that other properties can be successfully developed. The Company disclaims any obligation to update or revise any forward-looking statements, whether as a result of new information, events or otherwise, except as expressly required by law. Readers are cautioned not to put undue reliance on these forward-looking statements. All dollar amounts in Canadian currency unless otherwise stated. 2
  • 3.
    NAP: An attractiveinvestment Delivering on vision to build a diversified mid-tier precious metals company operating in mining-friendly jurisdictions World class palladium mine offers significant leverage to the rising palladium price Renewed commitment to exploration at Lac des Iles Commenced gold production at Sleeping Giant mine Focused on acquiring additional gold assets to grow gold production to 250,000 ounces Experienced management and technical teams Strong balance sheet: over $100 M in cash, no debt 3
  • 4.
    NAP: A diversifiedprecious metals producer Lac des Iles Sleeping Giant palladium mine gold mine LDI palladium mine: Sleeping Giant gold mine – Flagship mine – Commenced gold production – On care and maintenance in October 2009 since late 2008 – Potential for intrinsic growth – Significant exploration upside – Presence in highly prolific Abitibi region of Quebec 4
  • 5.
    A liquid stock Stock symbol NYSE Amex – PAL TSX – PDL Share price US $2.87 Shares outstanding 127M (154M fully diluted*) Market capitalization US $364M (US $442M fully diluted) Three-month average NYSE Amex – 1,030,722 daily trading volume TSX – 352,261 2008 high/low US$9.28/$0.91 2009 high/low US$3.60/$1.14 Shareholder base Institutional – 53% Retail – 47% Major shareholder Kaiser Francis Oil Company (30%) Information as at November 12, 2009 * For details, please see Appendix. 5
  • 6.
    Palladium: a keyvalue driver Supply: limited production RUSSIA 44% 44% NORTH AMERICA 14% 14% 6.5 M oz. total worldwide production SOUTH AFRICA 38% 6
  • 7.
    Palladium demand isincreasing PALLADIUM DEMAND BY CATEGORY 21% • Use in vehicles is growing, Investment/Other particularly in BRIC economies 13% • Stricter emission controls Electronics equals increased PGM usage • ETFs in Zurich, London, 9% Japan, and soon New York Dental will increase demand 49% 8% Automotive Jewellery/China Demand will grow, supply will stagnate Source: CPM Group 7
  • 8.
    Palladium market fundamentals Global light vehicle production forecast (OOOs) 78 M 79 M 76 M 73 M 65 M 67 M 60 M 52 M Source: CSM Worldwide, March 2009 8
  • 9.
    Palladium market fundamentals Stricter emission controls in BRIC nationsequals increased PGM usage 2001 2002 2003 2004 2005 2006 2007 2008 2009 2010 Brazil Euro II Euro III Euro IV Russia Euro I Euro II Euro III China (gas) Euro I Euro II Euro III Euro IV China (diesel) Euro I Euro II Euro III Euro IV India (nation) Euro I Euro II Euro III India (10 cities) Euro I Euro II Euro III Euro IV Source: CPM Group 9
  • 10.
    Palladium market fundamentals Growth in Palladium ETFs Increasingly viewed as an attractive precious metal providing portfolio diversification 10
  • 11.
    Palladium price projectedto be rising Price expected to remain above US $350 per ounce next year 2006-2009 Historic – Average Annual Price 2009-2017 Forecast – Average Annual Price US$ US$ 700 600 500 400 300 200 100 0 2009 2010 2011 2012 2013 2014 2015 2016 2017 Sources: Thomson One; CPM Group’s PGM Long Term Metals Outlook dated April 2009 11
  • 12.
    Ready to restartwith rebound in palladium • Located north of Thunder Bay, Ontario: – Open pit and underground mine – 15,000 tpd mill – $500 million invested in infrastructure and mineral rights to date • In production from 1993 to October 2008 when temporarily placed on care and maintenance in response to low metal prices • Annualized production at time of shut down: – 270,000 ounces of palladium – 3.0 million pounds of nickel – 20,000 ounces of platinum – 5.6 million pounds of copper – 20,000 ounces of gold • Decisive action taken to preserve reserves and maintain balance sheet • Will consider restart once palladium reaches sustainable price of US$325 to $350 per ounce • Prepared for quick restart – Capex approximately $4 million – Key personnel in place – Will take approximately 90 days from go decision to reach full production 12
  • 13.
    LDI: A worldclass mine Open pit Roby Underground Zone Offset Zone 0 __________600 m 13
  • 14.
    A new focuson exploration at LDI • $7.0 million exploration program for 2009 • Working to add to 3.7 million ounces of measured and indicated palladium resources* • Increase grade of upper portion of Offset Zone • Discover new resources on surface and underground * See cautionary note to U.S. Investors in Appendix. 14
  • 15.
    Extending LDI’s minelife: 2 new discoveries in 2009 • Two new underground PGM discoveries (Cowboy & Outlaw zones) • Discovered during infill drilling of Offset Zone • Cowboy is located 30 to 50 metres from Offset Zone, extends 250 metres along strike, 350 metres down dip and is open in all directions • Outlaw is located 50 to 75 metres from Cowboy Zone • Additional drilling underway • Potential near-surface discovery (West Pit) Potential to add at least 10 years of mine life 15
  • 16.
    Two new zones:Cowboy and Outlaw Additional mineralization has the potential to increase resources 16
  • 17.
    Discovering additional surfacetargets North VT Rim North Pit West Pit 17
  • 18.
    Building a golddivision: Acquiring Sleeping Giant • A key step in growing NAP: – Reduces risk associated with a single mine operation – Bullish on gold – Focus on precious metals increases shareholder value • Completed acquisition of Cadiscor Resources in May 2009 for $32 million in an all-share transaction • First step in NAP’s evolution into a diversified precious metals producer • The Sleeping Giant Mine provides good platform from which to grow and expand Aim is to build gold division to production of approximately 250,000 ounces per year 18
  • 19.
    Sleeping Giant mine:a foundation for growth • 100% owned Sleeping Giant gold mine is located northwest of Val d’Or, Quebec in prolific Abitibi region • Contained mineralization of 153,000 gold ounces* • Previously operated by IAMGOLD, Sleeping Giant produced an average of 58,000 ounces of gold over last five years • Cumulative production of 1 million ounces over 20 years at an average grade of 11.4 g/t gold * See cautionary note to U.S. Investors in Appendix. 19
  • 20.
    First gold pouredat Sleeping Giant on Oct. 6 • Annual production expected to be 50,000 ounces per year with cash cost in the range of US $450 to $500 per ounce* • Production restart cost approximately $7.5 million • Full complement of employees on site • Mill was refurbished on time and on budget On track and budget for achieving commercial production in early 2010 * Non-GAAP performance measure. For further information, please see pages 22-23 of the Company’s Second Quarter 2009 Report. 20
  • 21.
    Potential to growthrough exploration 0 0 500 500 1000 1000 1500 1500 21
  • 22.
    Discovery: A potentialsource of additional production • 237,000 measured and indicated gold ounces* • 294,000 inferred gold ounces* • Process ore at Sleeping Giant mill, which is 70 km away via established logging roads • August 2008 PEA identified 44,000 ounces of gold production per year over 4- year mine life * See cautionary note to U.S. Investors in Appendix. 22
  • 23.
    Eight properties thatinclude 70 km of favourable geology in 1182 claims over 48,699 hectares Discovery Cameron Shear JV Florence Flordin Harricana North Laflamme 23
  • 24.
    Acquisition: The externalgrowth driver • Build on presence in Abitibi region of Quebec with a focus on gold companies with near-term production potential • Focus on North and South American opportunities • Disciplined approach that maintains balance sheet strength • Leverage management strengths and expertise 24
  • 25.
    NAP: On trackfor growth Restart LDI mine Continue when sustainable aggressive recovery in exploration palladium prices program is achieved Commenced Continue gold production diversification in October 2009 through gold acquisitions 25
  • 26.
    Shareholder information North AmericanPalladium’s vision is to build a mid-tier diversified precious metals company operating in mining friendly jurisdictions. Highly leveraged to palladium, the Company is building on its exposure to gold, and focused on acquiring high quality near-term producing gold assets. NAP’s experienced management and technical teams have a renewed commitment to exploration and are dedicated to building shareholder value. Corporate office: 130 Adelaide Street West, Suite 2116 Toronto, Ontario M5H 3P5 Stock Symbols: NYSE Amex – PAL TSX – PDL Website: www.nap.com Investor Relations: Annemarie Brissenden Director, Investor Relations abrissenden@nap.com 416 -360-7971 ext. 226 26
  • 27.
    re-engineering the future InvestorPresentation November 2009 Appendices and further information
  • 28.
    Appendices – Tableof Contents • Senior management slides 29 to 30 • Board of directors slides 31 to 34 • Capitalization slide 35 • Exploration slides slides 36 to 38 • Sleeping Giant: History slide 40 • Reserves and resources slides 41 to 46 28
  • 29.
    Senior management Bill Biggar– President and CEO An accomplished businessman with extensive experience in mining and in a broad range of industries. Mr. Biggar has held senior positions with Barrick Gold Corporation, Horsham Corporation and Magna International. He also has over 12 years of experience as an investment banker and private equity investor. Jeff Swinoga – Vice President, Finance and CFO Eighteen years of experience in the resource, mining and finance industries. Mr. Swinoga has held CFO positions with HudBay Minerals and MagIndustries, and was Director, Treasury Finance of Barrick Gold Corporation for seven years. Dave Passfield – Vice President, Operations A professional engineer by training, Mr. Passfield has 30 years experience in open-pit and underground operations. Mr. Passfield has held key management positions with several major Canadian and international mining companies and has operating experience in Canada and overseas. 29
  • 30.
    Senior management Michel Bouchard– Vice President, Exploration and Development Mr. Bouchard has been involved in exploration, development, and operations in the mining industry for the past 25 years. He is credited with contributing to the discovery of the Bouchard Hebert Mine in northwest Quebec. Previously Mr. Bouchard held senior positions with Audrey Resources, Lyon Lake Mines and SOQUEM. Mr. Bouchard was formerly President and CEO of Cadiscor Resources Inc. Trent Mell – Vice President, Corporate Development and General Counsel Mr. Mell joined NAP in 2007, having previously worked at the corporate head offices of Barrick Gold Corporation and Sherritt International. Prior to joining the mining industry, Mr. Mell worked with Stikeman Elliott LLP, where he practiced securities law. Mr. Mell has also published papers on NI 43-101, and holds a B.A., a B.C.L. (with distinction) and a LL.B. (with distinction), all from McGill University, as well as a Masters degree in Securities Law from Osgoode Hall Law School. 30
  • 31.
    Board of Directors AndréJ. Douchane, Chairman A mining engineer with over 35 years of mining experience managing precious metals operations, Mr. Douchane was appointed to the Company’s Board of Directors in April 2003. In addition to serving on the board of Osisko Mining Corporation, Mr. Douchane is the President and Chief Executive Officer of Starfield Resources Inc., an exploration and development company operating in Nunavut, Canada. Mr. Douchane previously served as North American Palladium’s President and Chief Executive Officer from April 2003 to January 2006, and has held senior management positions with several international publicly-traded precious metal mining companies including Vice President, Operations of Franco and Euro-Nevada (Newmont Mining Corporation). Steven R. Berlin Mr. Berlin was appointed to the Board of Directors of the Company in February 2001, and is also a director of Orchids Paper Products, an AMEX listed company. At the end of 2005, Mr. Berlin retired from his position as Vice-President of KFOC where he worked part-time for two years following four years of full-time work as Vice-President and Chief Financial Officer. Prior to joining KFOC, Mr. Berlin taught at the University of Tulsa for three years where he also served a year as acting associate Dean of the College of Business and acting Director of the School of Accounting. Before joining the University of Tulsa, Mr. Berlin spent 25 years with Citgo Petroleum Corporation, where he retired as Senior VP Finance and Administration and Chief Financial Officer. Mr. Berlin has a bachelor’s degree from Duquesne University, an MBA from the University of Wisconsin Madison and has completed the Executive Management program at Stanford University. 31
  • 32.
    Board of Directors BillBiggar – President and CEO An accomplished businessman with extensive experience in mining and in a broad range of industries. Mr. Biggar has held senior positions with Barrick Gold Corporation, Horsham Corporation and Magna International. He also has over 12 years of experience as an investment banker and private equity investor. C. David A. Comba Mr. Comba, who has over four decades of experience as an exploration advocate and senior mining executive, was appointed to the Company’s Board of Directors in March 2006. As Chief Exploration Geologist of Falconbridge Limited in Sudbury, Ontario, he led the team that discovered the Thayer Lindsley mine. Prior to its takeover by Kinross Gold Corporation, Mr. Comba was Vice- President, Exploration of Falconbridge Gold Corporation. Following the takeover, he became President and Chief Executive Officer of a Kinross-controlled junior exploration company listed on the TSX. Mr. Comba was Director of Issues Management with the Prospectors and Developers Association of Canada from 1998 to 2005, during which time he led the successful lobby effort for the re-introduction of enhanced or “super” flow-through shares. Mr. Comba has Bachelor’s and Masters’ degrees in geology from Queen’s University in Kingston, Ontario. 32
  • 33.
    Board of Directors RobertJ. Quinn A founding partner of the Houston mining transactional law firm Quinn & Brooks LLP, Mr. Quinn has over 25 years of legal and management experience, including as Vice President and General Counsel for Battle Mountain Gold Company. Appointed to the Board of Directors of the Company in June 2006, he has extensive experience in M&A transactions, corporate governance, public disclosure, governmental affairs, environmental law and land management. Mr. Quinn has a Bachelor of Science degree in Economics from the University of Denver, a juris doctorate degree from the University of Denver College of Law and has completed two years of graduate work in mineral economics at the Colorado School of Mines. Greg J. Van Staveren, CA, CPA Mr. Van Staveren is the President of Strategic Financial Services, a private consulting company providing business advisory services. Appointed to the Board of Directors of the Company in February 2003, Mr. Van Staveren is an independent director on the board of two other public companies and part-time Chief Financial Officer for Starfield Resources Inc. (SRU:TSX) and AIM Health Group Inc. (AHG:TSX). He was the Chief Financial Officer of MartinRea International Inc. (MRE:TSX) from 1998 to September 2001, and provided accounting and advisory services until 1998 as a partner of KPMG, which he joined in 1980. Mr. Van Staveren is a Chartered Accountant and a Certified Public Accountant and holds a Bachelor of Math (Honours) degree from the University of Waterloo. 33
  • 34.
    Board of Directors WilliamJ. Weymark, P.Eng. Appointed to the Board of Directors of the Company in January 2007, Mr. Weymark is President of Weymark Engineering Ltd., a Company providing consulting services to businesses in the private equity, construction and resource sector. He is also a director of Tirex Resources Ltd. (TXX:TSX-V), the VGH & UBC Hospital Foundation Board, and several private companies. Mr. Weymark is active with the BC Lions as a Founder of their business association and a Member of the Industry Advisory Committee for the Norman B. Keevil Institute of Mining Engineering at the University of British Columbia. Until June 2007, Mr. Weymark was President and CEO of Vancouver Wharves/BCR Marine, a transportation firm located on the west coast of British Columbia. Prior to joining Vancouver Wharves in 1991, Mr. Weymark spent 14 years in the mining industry throughout western Canada working on the start-up and operation of several mines. 34
  • 35.
    Capitalization Potential Number Price Proceeds Common Shares Outstanding 1 127,383,000 Stock Options 2 2,407,100 $ 4.02 $ 9,700,000 Warrants 2 4.25 to (expiring December 2009 to 25,120,000 US $10.73 3 $ 134,500,000 September 30, 2011) Total 154,910,000 $ 144,200,000 • 27.5 million warrants and options outstanding • 10.7 million expire December 13, 2009 1 As at November 12, 2009. 2 As at September 30, 2009. 3 Warrants in both US$ and C$. U$ converted at rate of $1.05 CDN/US. 35
  • 36.
    Longitudinal section showingPhase 1 and 2 drillhole intercepts Underground development View looking west 36
  • 37.
    Interpreted geological crosssection 505N of the Offset Zone 37
  • 38.
    Interpreted longitudinal sectionof the Cowboy Zone 38
  • 39.
    West Pit Area:Phases 1 and 2 507N Pod Quartz Diorite 39
  • 40.
    Sleeping Giant: History 1984to 1987: Oct. 2007: Peron Gold Mines Cadiscor signs (now Aurizon) sinks option to acquire two shafts SG and begins Oct. 2008: 1991: underground drill Ownership transferred Cambior acquires campaign to to Cadiscor 50% by investing identify new in drilling and April 2005: May 2009: reserves underground work Cambior acquires NAP acquires Cadiscor second 50% from and continues Aurizon, becomes operational restart sole owner 2006: IAMGOLD becomes owner, Oct. 6, 2009: after acquiring First gold pour Cambior April 2009: Cadiscor commences 1993: restart Production resumes Sept. 2008: Cadiscor releases 1988 to 1990: NI 43-101 report Commercial production until indicating new reserves and reserves thought depleted resources for 3 years of production 40
  • 41.
    Appendix – Resourcesand Reserves 1. Cautionary Note to U.S. Investors Concerning Mineral Reserves and Mineral Resources 2. Lac des Iles mine Mineral Resource Summary – December 31, 2008 3. Lac des Iles mine – Offset Zone Estimated Mineral Resource – January 20, 2009 4. Sleeping Giant mine Statement of Reserves and Resources – October 2008 5. Discovery Project Mineral Resources – August 1, 2008 Dr. William E. Stone, P. Geo, Vice President, Exploration for North American Palladium Ltd., is the Qualified Person who supervised the preparation of the technical data in this presentation. Please refer to North American Palladium’s Annual Information Form for the year ended December 31, 2008 and applicable technical reports available on www.sedar.com, www.sec.gov and www.nap.com for further information. 41
  • 42.
    Cautionary Note toU.S. Investors Concerning Mineral Reserves and Mineral Resources Mineral reserves and mineral resources have been calculated in accordance with National Instrument 43-101 as required by Canadian securities regulatory authorities. For United States reporting purposes, Industry Guide 7, (under the Securities and Exchange Act of 1934), as interpreted by Staff of the SEC, applies different standards in order to classify mineralization as a reserve. In addition, while the terms “measured”, “indicated” and “inferred” mineral resources are required pursuant to National Instrument 43-101, the U.S. Securities and Exchange Commission does not recognize such terms. Canadian standards differ significantly from the requirements of the U.S. Securities and Exchange Commission, and mineral resource information contained herein is not comparable to similar information regarding mineral reserves disclosed in accordance with the requirements of the U.S. Securities and Exchange Commission. U.S. investors should understand that “inferred” mineral resources have a great amount of uncertainty as to their existence and great uncertainty as to their economic and legal feasibility. In addition, U.S. investors are cautioned not to assume that any part or all of NAP's mineral resources constitute or will be converted into reserves. For a more detailed description of the key assumptions, parameters and methods used in calculating NAP’s mineral reserves and mineral resources, see NAP’s most recent Annual Information Form/Form 40-F on file with Canadian provincial securities regulatory authorities and the U.S. Securities and Exchange Commission. 42
  • 43.
    Lac des Ilesmine Mineral Resource Summary – December 31, 2008 Tonnes Pd Pt Au Cu Ni PdEq Pd Location (000’s) (g/t) (g/t) (g/t) (%) (%) (g/t) (000 oz) Measured Resources Roby Open Pit 3,722 1.99 0.23 0.17 0.075 0.065 3.77 238 Roby Stockpiles 763 2.09 0.19 0.18 0.060 0.079 3.79 51 Indicated Resources Roby Open Pit 2,565 2.20 0.24 0.18 0.078 0.068 4.07 181 Roby RGO Stockpile 13,365 0.97 0.12 0.08 0.034 0.056 2.00 417 Roby Underground 3,292 7.61 0.44 0.33 0.062 0.077 10.46 805 Offset Underground 12,331 5.02 0.38 0.37 0.114 0.133 8.28 1,990 Total M&I Resources 36,038 3.18 0.26 0.22 0.072 0.086 5.29 3,682 Inferred Resources Offset Underground 4,637 4.9 0.4 0.3 0.12 0.13 8.0 730 Notes: 1. CIM definitions were followed for the estimation of Mineral Resources. 2. Mineral Resources for the Roby Open Pit were estimated at a cut-off grade of 1.8 g/t PdEq, within an optimized pit shell run below the current pit survey (October 2008). 3. Mineral Resources in stockpiles were estimated at a cut-off grade of 1.9 g/t PdEq. 4. Mineral Resources for the Roby and Offset Zones underground were estimated at a cut-off grade of 5.8 g/t PdEq. 5. Cut-off grades were determined under the assumption that a production rate of 14,000 tpd would be resumed in the event of restarting operations. 6. PdEq factors were calculated separately for each area, based on operating cost and metallurgical performance estimates appropriate for those areas. 7. Metal price assumptions of US $250/oz palladium, US$1,400/oz platinum, US$850/oz gold, US$6.50/lb nickel and US$2.00/lb copper were used in the estimation of Pd/Eq and cut-off grade. A US$/C$ exchange rate of 1.11 was used. Please refer to North American Palladium’s Annual Information Form for the year ended December 31, 2008 and applicable technical reports filed on www.sedar.com, www.sec.gov and www.nap.com for further information. 43
  • 44.
    Lac des Ilesmine – Offset Zone Estimated Mineral Resource – March 31, 2008 Tonnes Pd Pt Au Ni Cu PdEq Pd Category (millions) (g/t) (g/t) (g/t) (%) (%) (g/t) (000 oz) Indicated 12.3 5.02 0.38 0.37 0.13 0.11 8.28 1,985 Inferred 4.6 4.85 0.37 0.33 0.13 0.12 8.0 717 Notes: 1. Prepared by Mr. Ian T. Blakley, P. Geo and Senior Consulting Geologies for Scott Wilson Roscoe Postle Associates, an independent Qualified Person within the meaning of NI 43-101. 2. Palladium equivalency (PdEq) cut-off of 5.575 g/t, assuming long-term US$ metal prices of $300/oz Pd, $1,000/oz Pt, $850/oz Au, $7.00/lb Ni, $2.50/lb Cu and a US$/C$ echange rate of 1.10. 3. Resources were estimated to a maximum depth of 1,200 m. 4. Metal recovery assumptions of 80% Pd, 70% Pt, 75% Au, 40% Ni and 85% Cu were used in estimation of PdEq. The Offset Zone resource estimate is available on www.sedar.com, www.sec.gov and www.nap.com. 44
  • 45.
    Sleeping Giant mine Statement of Reserves & Resources – October, 2008 Tonnes Au Au Type (000’s) (g/t) Contained ounces Reserves Proven 135,300 9.3 40,396 Probable 100,000 9.4 30,177 Resources Measured 42,000 8.7 11,731 Indicated 211,900 10.3 70,068 Notes: 1. CIM definitions were followed for the estimation of Mineral Resources and Reserves. 2. Mineral Resources that are not Mineral Reserves do not have demonstrated economic viability. 3. Mineral Reserves as stated can be produced at or below the production cost of CDN$850 per troy ounce. With an exchange rate of $1US=1.07 $CDN, this corresponds to a gold price of US $794 per troy ounce. 4. Reserve estimates are based on historical mine operating costs and gold recoveries at the mine. The estimated cost of each stope has included development costs based on current mine costs and per shift production. 5. A series of gold prices have been used to estimate reserves in a number of economic scenarios. The gold price has been modified in US$50 increments from US$750 to US$900 per troy ounce. Please refer to the Technical Report titled “The Sleeping Giant Mine, Northwestern Quebec”, dated October 8, 2008 and prepared by Genivar LP for further information. It is filed on www.sedar.com under Cadiscor Resources Inc. Dr. Tyson C. Birkett, Eng. Ph.D., Josee Couture, Eng., and Christian Bezy, Geo, are the Qualified People who supervised the preparation of the above technical data. 45
  • 46.
    Discovery Project Mineral Resources – August 1, 2008 Au Au Type Tonnes (g/t) (Contained Oz) Mineral Resources Measured 3,109 8.95 893 Indicated 1,278,973 5.74 235,682 Inferred 1,545,500 5.93 294,223 Notes: 1. CIM definitions were followed for the estimation of Mineral Resources and Reserves. 2. The Independent and Qualified Persons for the Mineral Resource estimates as defined by Regulation 43-101 is Carl Pelletier, B.Sc., P.Geo., of InnovExplo Inc. The effective date of the estimate is June 17, 2008. 3. Mineral Resources, having demonstrated economic viability, are not Mineral Reserves. 4. Results are presented undiluted and in situ. The estimate included six (6) gold-bearing zones (“A”, “B”, “C”, “E”, “20” and “30”) and covers the Discovery Project area between sections 1+00E to 9+00W and 4+50E to 15+00E. 5. The resources were compiled using a cut-off grade of 3.0 g/t Au. This cut-off must be re-evaluated in light of present market conditions (gold price, exchange rate and mining cost). A fixed density of 2.82 g/cm3 was used. A minimum of 1.6 m horizontal width was applied, using the grade of the adjacent material when assayed, or a value of zero when not assayed. High grade capping was done on the raw data and established at 35.0 g/t Au. Drill hole compositing was not done. Resources were evaluated from drill hole results using a polygonal on longitudinal approach. Calculations used metric units (metre, tonnes and g/t Au). The company is not aware of any known environmental, permitting, legal, title, taxation, socio-political, marketing or other relevant issue that could materially affect the Mineral Resource estimates. For further information, please refer to the report titled “Technical Report on the Scoping Study and Mineral Resource Estimate for the Discovery Project (according to Regulation 43-101 and Form 43-101F1) dated August 1, 2008 and prepared by InnovExplo Inc. It is filed on www.sedar.com under Cadiscor Resources Inc. 46