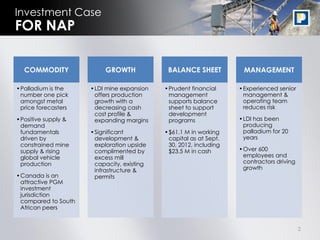
- The presentation provides an investment case for Napier Ventures Inc. (NAP), a palladium mining company, highlighting NAP's commodity growth potential, strong balance sheet, and experienced management team.
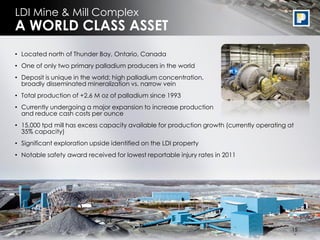
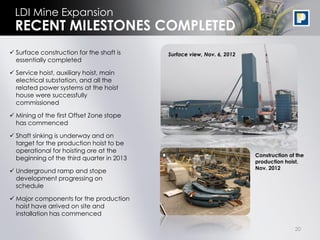
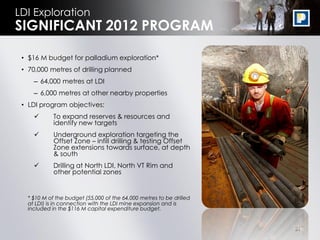
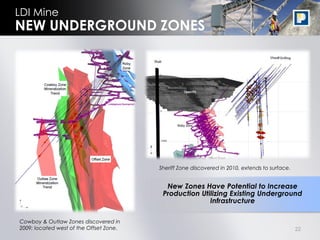
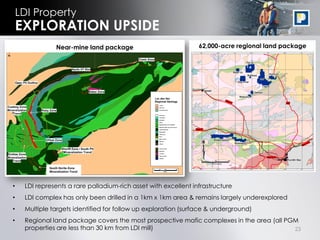
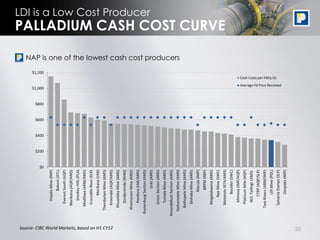
- NAP's Lac des Iles mine expansion offers production and cost profile improvements while significant development and exploration upside is complemented by excess mill capacity and infrastructure.
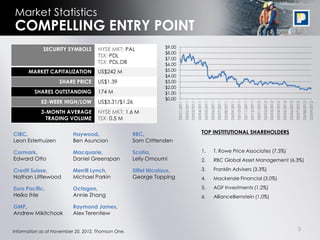
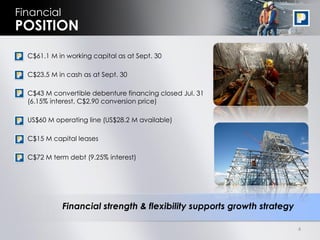
- At a market capitalization of US$242 million and share price of US$1.39, the presentation argues NAP presents a compelling entry point for investment in the palladium mining sector.
- Napier Ventures is an investor presentation for a mining company that produces palladium.
- The company's Lac des Iles mine in Ontario, Canada is a world class palladium asset that has been in production for 20 years and is undergoing an expansion.
- In the first half of 2012, the mine produced over 81,000 ounces of palladium at a cash cost of $404 per ounce as it works towards its 2012 guidance of 150,000 to 160,000 ounces.
This investor presentation provides an overview of North American Palladium as an investment opportunity in the palladium market. It highlights North American Palladium's production growth outlook through expansion of its Lac des Iles mine, a strong balance sheet to fund development programs, and an experienced management team. The presentation also notes positive supply and demand fundamentals for palladium and identifies Canada as an attractive jurisdiction for platinum group metal investments compared to South Africa.
- The presentation provides an overview of North American Palladium's Lac des Iles mine, a primary palladium producer located in Ontario, Canada.
- In the first half of 2012, the mine produced over 81,000 ounces of palladium at a cash cost of $404 per ounce, in line with guidance for the year of 150,000 to 160,000 ounces at a cash cost of $375 to $400 per ounce.
- The mine is undergoing an expansion to increase production and reduce costs through higher mining rates and mill throughput while maintaining grade and recovery.
Has the leveraged finance market finally reached equilibrium? It seemed possible as Marched entered (like a lamb). Syndicated loan prices slipped as weary institutional investors took a step back from February activity, which feature the three R's: Repricings, refinancings and recapitalizations.
Connect with LCD
Facebook: http://www.lcdcomps.com/facebook
LinkedIn: http://www.lcdcomps.com/linkedin
Twitter: http://www.twitter.com/lcdnews
Web: http://www.lcdcomps.com
The document discusses Pepco Holdings' strategic focus on infrastructure investments and customer programs to position the company for continued success. It outlines plans to invest $1.2 billion in the Mid-Atlantic Power Pathway transmission project through 2014 and $646 million in advanced metering infrastructure and other programs through the company's Blueprint for the Future initiative between 2008-2014. Regulatory support is essential for cost recovery for these investments, which aim to enhance reliability, manage costs and protect the environment for customers.
It was a good start to the year for the European Leveraged finance market, though investor cash still greatly outweighed syndicated loan and high yield bond deal flow. In the analysis: loan returns, loan/high yield bond prices, new-issue volume, default rates, more.
Connect with LCD
Facebook: http://www.lcdcomps.com/facebook
LinkedIn: http://www.lcdcomps.com/linkedin
Twitter: http://www.twitter.com/lcdnews
Web: http://www.lcdcomps.com
After Greece's restructuring, the market regained its confidence and players were willing to again take risks. Inflows and volume were positive, while the secondary market finished the month down a bit.
Check out LCD's new, free web site, LeveragedLoan.com
http://www.leveragedloan.com
* Leveraged finance job postings
* Online Loan Market Primer
* LCD News
* Market Stats
Connect with LCD
Facebook: http://www.lcdcomps.com/facebook
Like LCD on Facebook for monthly analysis on LBO/Private equity stats, as well as Default/Restructuring analysis.
LinkedIn: http://www.lcdcomps.com/linkedin
There are some 8,500+ market contacts in LCD's Leveraged Loan Group
Twitter: http://www.twitter.com/lcdnews
News, commentary, other leveraged finance info
Web: http://www.lcdcomps.com
YouTube: http://youtu.be/Bb3qRV9aGrE
This document provides an overview of Banco Santander's 1Q10 results in Brazil. It discusses the improving Brazilian macroeconomic environment in 2010-2011, Santander's strategy to integrate its acquisitions and become the third largest private bank in Brazil, and highlights synergies realized from the integration. Key metrics on loans, deposits, profits, and branch network are also presented.
The loan market was subdued in August, owing to summer break for both investors and bankers. Inflows in high-yield funds were up. Secondary markets were up for both loans and high yield, default rates also rose.
Check out LCD's new, free web site, LeveragedLoan.com
http://www.leveragedloan.com
* Leveraged finance job postings
* Online Loan Market Primer
* LCD News
* Market Stats
View the video on YouTube:
http://youtu.be/1ARr9U_IW6s
Connect with LCD
Facebook: http://www.lcdcomps.com/facebook
Like LCD on Facebook for monthly analysis on LBO/Private equity stats, as well as Default/Restructuring analysis.
LinkedIn: http://www.lcdcomps.com/linkedin
There are over 9,000 market contacts in LCD's Leveraged Loan Group
Twitter: http://www.twitter.com/lcdnews
News, commentary, other leveraged finance info
Web: http://www.lcdcomps.com
Contact: anna_cini@sandp.com
The document discusses U.S. Census Bureau data on manufacturer shipments, inventories, and orders. It also references charts showing Cass Information Systems freight index data from 2006 to 2010, the euro to U.S. dollar exchange rate, and U.S. unemployment rate data from the Bureau of Labor Statistics. The document appears to be compiling various economic indicators and data sources for analysis.
Wayne McCurrie on Fixed Income and Cash Investingmoneyweb
Fixed income and cash investing were to be discussed. The agenda included introductions to fixed income markets and cash investing, as well as broad asset allocations. Fixed income includes government, agency, corporate and municipal bonds. Cash investing provides capital preservation but returns are typically lower than inflation over time. Relative valuations of fixed income versus equities were to also be reviewed.
1. The document summarizes Santander Brasil's 1H10 results, highlighting growth in net profits, loans, and fees.
2. Loan volumes increased across most segments, with notable growth in payroll, mortgage, and credit card loans.
3. Asset quality improved with a comfortable coverage ratio, while performance ratios like efficiency and ROAE also enhanced over the last 12 months.
The document discusses opportunities in fixed income investing given low global interest rates expected to remain low for longer. It notes active management will be crucial to achieve meaningful real returns. Opportunities still exist in areas like corporate credit and utilizing a global fixed income universe. Investec's fixed income funds take active approaches across different geographies and asset classes to generate income and diversification for investors. The Investec Absolute Income and Diversified Income funds are highlighted as alternatives providing higher returns than money markets over time through their flexible multi-asset fixed income mandates.
This document is a leveraged finance analysis from February 2011 by Steve Miller. It summarizes the US leveraged loan market in January 2011, noting that technical factors pushed loan prices higher and yields lower due to massive inflows into loan mutual funds. However, LBO activity remained scarce. It predicts that technical factors will continue to dominate the market until more LBO deals emerge or an external event occurs, allowing issuers to maintain favorable terms and lower spreads. Default rates are also expected to continue easing in 2011.
Thompson Creek Investor Presentation - November 9, 2012Company Spotlight
Third Quarter 2012 Financial Results Investor Call
- The company reported a net loss of $48.2 million for Q3 2012 and $61.9 million YTD due to lower molybdenum production and prices.
- Production and cash costs are expected to increase in 2013 and 2014 as mining resumes at Endako and Thompson Creek mines.
- Capital expenditures will decrease to $295-335 million in 2013 from $838-878 million in 2012 as Mt. Milligan construction nears completion. The company has $360 million in cash and $612 million in committed funding to cover remaining capital needs.
The loan market was relatively flat in November owing to rising supply volume and concern regarding the fiscal cliff. Looking ahead, there are strong indications for demand, however macro concerns abound.
Check out LCD's new, free web site, LeveragedLoan.com
http://www.leveragedloan.com
* Leveraged finance job postings
* Online Loan Market Primer
* LCD News
* Market Stats
Check out the video presentation
http://www.youtube.com/watch?v=Gj76LBhEBt4
Connect with LCD
Facebook: http://www.lcdcomps.com/facebook
Like LCD on Facebook for monthly analysis on LBO/Private equity stats, as well as Default/Restructuring analysis.
LinkedIn: http://www.lcdcomps.com/linkedin
There are over 9,000 market contacts in LCD's Leveraged Loan Group
Twitter: http://www.twitter.com/lcdnews
News, commentary, other leveraged finance info
Web: http://www.lcdcomps.com
Contact: marc_auerbach@spcapitaliq.com
The document discusses the history of public debt credit default swap (CDS) points for several European countries from 2005 to 2012. It shows CDS point charts over time for Greece, Ireland, Portugal, Spain, and Italy that peaked during the European debt crisis period of 2008-2012. It also includes charts comparing 10-year bond interest rate spreads for various European countries to Germany as a benchmark. The text provides background on how CDS contracts and recovery rates are used to derive default probabilities from CDS point levels over 5-year periods.
SEB sees 25 per cent chance of Riksbank cutSEBgroup
The document summarizes an internal survey by SEB of expectations for the upcoming Riksbank monetary policy decision and market reaction. Key points:
1) 82% of respondents expect the Riksbank to keep rates unchanged, while 18% expect a 25 basis point cut.
2) If rates stay unchanged, the survey expects Swedish bond yields to rise up to 10 basis points and the euro to fall 2-6 figures against the krona.
3) If rates are cut, yields could fall 7-12 basis points and the euro rise 4-7 figures against the krona.
4) On average, respondents expect the repo rate to be 1.27% by
This document contains graphs and tables summarizing international aid commitments and disbursements for HIV/AIDS from 2002-2011. It shows that total annual commitments and disbursements increased over time, peaking at $8.8 billion and $8.7 billion respectively in 2011. The United States contributes the largest share at 68% of bilateral disbursements and 32% of Global Fund contributions. Most donor funding is distributed bilaterally, though contributions to the Global Fund and UNITAID are increasing.
SEB Group reported lower profits in Q1 2008 compared to Q1 2007 and Q4 2007. Net profit declined 43% year-over-year and 51% quarter-over-quarter due to lower net interest income and net financial income. Total operating income and net fee and commission income also declined. Asset quality remained stable with a low credit loss level of 0.13%. Return on equity fell to 9.6% from 19% in Q1 2007.
Summary of December 2010 Existing-Home SalesNAR Research
The document summarizes existing home sales statistics for December 2010. It shows that total existing home sales decreased 3.3% from December 2009 but median home prices rose 1.2% year-over-year. Charts depict trends in annualized sales, median prices, and price changes from 2006-2010. Sales were strongest in the South and West and weakest in the Northeast and Midwest. Most homes sold were priced between $100,000-$250,000, though sales of higher-priced homes rose while lower-priced homes fell.
Aveda Transportation and Energy Services is a growing provider of specialized oilfield hauling and rentals in the US and Western Canadian oil and gas industry. The presentation discusses Aveda's operations, management team, growth strategy, and financial performance. Aveda has expanded its fleet of 556 hauling vehicles and 703 rental equipment pieces across 10 North American offices. The company aims to continue growing organically and through acquisitions to capitalize on increasing North American oil and gas activity.
PVA is transitioning from a natural gas producer to an oil and natural gas liquids producer through its focus on oil-rich plays like the Eagle Ford Shale. This shift has improved revenues and cash flows as oil and NGL prices have increased relative to natural gas prices. PVA plans to continue growing its oil and liquids production and considers asset sales to boost liquidity in the near term. The company believes it is undervalued relative to its peers given its leverage to higher-priced oil and natural gas liquids.
Golden Star Resources is a gold mining company operating mines in Ghana. In Q1 2014, production was 65,812 ounces in line with expectations. Costs are decreasing with lower mining contractor expenses. The company is focused on growing production from lower cost, non-refractory ore sources. This includes pursuing underground mining at the Wassa mine, which could increase production and grades while lowering costs per ounce. Drilling continues to show resource growth potential at Wassa.
- WEG held a 2Q13 conference call on August 1st, 2013 to discuss financial results and business updates.
- In 2Q13, WEG saw a 15% increase in net operating revenue compared to 1Q13 and an 11.2% increase compared to 2Q12. Net income increased 19% compared to 1Q13 and 46.6% compared to 2Q12.
- Domestic market revenue grew 13% compared to 1Q13 while external market revenue grew 17.3%. External markets revenue in US dollars grew 13.1% compared to 1Q13 but fell 1.9% compared to 2Q12.
The document presents an investment case for North American Palladium. It discusses the fundamentals of the palladium market including constrained mine supply and strong demand growth from the automotive sector. It highlights NAP's Lac des Iles mine as a world class asset, currently undergoing expansion. The presentation provides an overview of NAP's financial position and market valuation.
Sage Gold's short term plan is to develop near term gold production at their Clavos deposit in Timmins, Ontario to generate cash flow. The Clavos deposit has existing infrastructure and underground development in place from previous owner St. Andrews Goldfields. Sage is completing the earn in of a 60% interest in Clavos and expects a new resource estimate and preliminary economic assessment in 2012. Production could begin in 2013 once permitting is complete. The Clavos deposit and surrounding area has potential for resource expansion at depth and along strike from the existing mineralization.
- Developed country central banks continue monetary easing policies like quantitative easing to stimulate their economies
- China saw a significant trade deficit in January and February due to seasonal factors
- Hungary may become the first country to face financial sanctions from the EU for its budget deficits and rising debt levels
The document analyzes trends in the Korea social game market in the second quarter of 2011. It finds that while Cyworld AppStore saw growth in the number of games launched in the first quarter, the second quarter saw a drop in new users and revenue. Total revenue was still the highest so far at $8 million USD. Demographics remained steady, with females making up the majority of users at 56% and most users being between 16-29 years old. Simulation games like farming and aquarium titles remained very popular and a major driver of revenue.
The issuer-friendly tone returned to the European leveraged loan market in April as investors continue to be cash-rich. This demand for product, of course, is pushing prices higher and yields lower.
Connect with LCD
Facebook: http://www.lcdcomps.com/facebook
Like LCD on Facebook for monthly analysis on LBO/Private equity stats, as well as Default/Restructuring analysis.
LinkedIn: http://www.lcdcomps.com/linkedin
There's almost 6,000 market contacts in LCD's Leveraged Loan Group
Twitter: http://www.twitter.com/lcdnews
News, commentary, other leveraged finance info
Web: http://www.lcdcomps.com
November was uneventful month, Eurozone crisis contained activity, and the high yield bond marked slowed. Default rates were stable in November, though many expect them to rise in the new year.
The European leveraged finance market saw strong investor demand in February, with loan volumes of €3 billion and bond volumes of €2.1 billion. Loan and bond prices finished the month higher, and default rates remain low. Looking ahead, the market remains flush with cash from investors and repayments, which is pushing spreads tighter and making the market more issuer-friendly as companies look to repricing and refinancing deals.
There were no May flowers for the US syndicated loan market. New issues flooded the market, sapping the technicals picture. Subsequently, loans returned negative 0.1% during the month. The outlook for the summer looks to be more of the same, accounts say, as the forward calendar of deals remains impressive.
Connect with LCD
Facebook: http://www.lcdcomps.com/facebook
Like LCD on Facebook for monthly analysis on LBO/Private equity stats, as well as Default/Restructuring analysis.
LinkedIn: http://www.lcdcomps.com/linkedin
There's almost 6,000 market contacts in LCD's Leveraged Loan Group
Twitter: http://www.twitter.com/lcdnews
News, commentary, other leveraged finance info
Web: http://www.lcdcomps.com
The pharmaceutical industry faces significant challenges in developing new drugs including rising costs, decreased returns on investment, and a more complex regulatory environment. Development times and costs have increased dramatically, while success rates have declined. Return on investment for R&D has turned negative as development costs have risen much faster than sales. Additionally, regulatory requirements have increased, requiring more extensive safety data and outcomes evidence prior to approval. These challenges are driving the need for changes across the industry.
This document summarizes the third edition of the Food and Farming News newsletter. It discusses the relatively recession-tolerant agricultural industry and the need for risk management. It provides thoughts on potential funding gaps and how larger farming businesses can learn from corporates and co-operatives. The edition also looks at the main global economic drivers of wheat and milk as well as other topical issues such as the proposed Supermarket Adjudicator and tax on renewables. The newsletter hopes to provide both interesting and useful information to drive and grow businesses.
The Forex Portfolio remains firmly negative towards the USD and to a lesser extent towards the EUR though both net short positions have been reduced in January. The net short exposure to GBP is nearly negligible now
2010 was a good year for the European leveraged finance market, compared to the dismal activity in 2009, at least. High yield bonds posted record volume, loans returned a healthy 8%-plus and investor coffers remain filled, meaning 2011 could be an even healthier year.
Connect with LCD Facebook: http://www.lcdcomps.com/facebook LinkedIn: http://www.lcdcomps.com/linkedin Twitter: http://www.twitter.com/lcdnews Web: http://www.lcdcomps.com
Contact: anna_cini@sandp.com
KBank fx & rates strategies the shortest distance between two points is a s...KBank Fx Dealing Room
or so they say. Low USD dollar liquidity is a cue for the rise in USD/THB volatility
„ As we are in the year of the Rabbit, the markets will tend to be jumpy…with events in Tunisia and Egypt again highlighting USD perceived safe haven stature
„ Resumption of political activities following end of emergency decree is giving a good excuse for foreign investors to take some money off the table
„ …and reintroduces more uncertainty in the USD/THB picture
„ Our main theme for USD/THB downside remains unchanged…but our 4Q11 USD/THB target is scaled back to 29.00 from 28.00
„ Indications from the central bank along with its perceived preference for a less stronger baht coupled with rising commodity prices prompts us to revise up our 4Q11 BOT repo target to 3.25% from 2.75%
This document summarizes the background, research question, theoretical considerations, empirical model, and proposed analysis of a study investigating whether financial globalization decreases welfare. The study aims to empirically examine how the rising importance of valuation effects (changes in asset prices) impacts economic performance, specifically consumption volatility, which is a proxy for welfare. While the theoretical relationship between valuation effects and consumption is unclear, the researcher hypothesizes that consumption volatility may increase with greater valuation effect volatility, representing a welfare loss. An empirical model is proposed to test this relationship conditional on currency composition and risk sharing ability.
It was a June swoon for US leveraged loan market, as inflows trailed issuance, putting investors in the driver seat. In this analysis: a special look at the burgeoning CLO market.
Connect with LCD
Facebook: http://www.lcdcomps.com/facebook
Like LCD on Facebook for monthly analysis on LBO/Private equity stats, as well as Default/Restructuring analysis.
LinkedIn: http://www.lcdcomps.com/linkedin
There's almost 6,000 market contacts in LCD's Leveraged Loan Group
Twitter: http://www.twitter.com/lcdnews
News, commentary, other leveraged finance info
Web: http://www.lcdcomps.com
The document discusses data from Hitwise and AdGooroo that can help companies win new business pitches. It provides insights into:
1) Traffic trends to cruise industry websites, which peaks between January to May.
2) Traffic in 2011 is shaping up to be better than 2010 for the cruise category.
3) As the peak season began in 2011, the cruise industry increased its paid search spending while decreasing the cost-per-click.
The document describes PeopleBrowsr's platform for social intelligence and influence scoring. It discusses how the platform provides real-time analytics on vast amounts of social data to measure influence and returns on investment. PeopleBrowsr has a unique data cloud and analytics capabilities to track influence networks and identify influential individuals and messages over social networks.
The document discusses national giving trends in higher education based on an annual benchmarking index. Some key findings from the index include median changes in revenue, donor counts, new donors, retention rates, and reactivation rates between 2008-2010 for private and public institutions. Participation and retention rates for young alumni from the 1990s and 2000s are also presented for different benchmarking groups.
The document discusses national giving trends in higher education benchmarking. It provides data on median changes in revenue, donors, and retention rates for private and public institutions from 2008-2010. Specifically, it shows median revenue per donor decreased for both private and public schools in this period. The document advocates for institutions to conduct benchmarking to identify strengths and weaknesses, consider new ideas, and improve fundraising.
This document outlines an investment opportunity in emerging and frontier markets debt. It notes that emerging market economies are experiencing high growth while developed markets maintain low interest rates. This creates an opportunity to invest in emerging market corporate bonds, which offer higher yields than US high yield bonds yet carry less risk due to stronger balance sheets of emerging market companies. The proposed investment funds would pursue this opportunity by investing in emerging market sovereign and corporate debt across various countries and industries.
North American Palladium operates the Lac des Iles mine in Ontario, Canada, one of only two primary palladium mines in the world. The presentation outlines NAP's investment proposition including existing infrastructure with excess capacity, increasing production and decreasing costs, and significant exploration potential. It provides guidance for 2015 including payable palladium production of 185,000 to 205,000 ounces at a cash cost of $440 to $466 per ounce.
The document provides an overview of North American Palladium's Lac des Iles palladium mine in Ontario, Canada. It discusses the constrained global palladium supply outlook and growing demand drivers. NAP's Lac des Iles mine is a world-class asset with significant exploration potential and excess processing capacity. The mine is forecast to increase production to over 200,000 ounces of palladium per year while lowering costs, leveraging existing infrastructure. Drilling programs aim to expand reserves and resources in high priority areas of the mine.
This investor presentation provides an overview of North American Palladium Ltd.'s Lac des Iles palladium mine in Ontario, Canada. Some key points:
- The palladium market is expected to remain in deficit due to constrained global supply and growing demand from the automotive sector.
- Lac des Iles is a world-class asset with significant exploration potential. Production is increasing while costs are decreasing.
- In 2014, guidance includes producing 170,000-175,000 ounces of palladium at a cash cost of around $550/ounce, declining to $450/ounce by Q4.
- Exploration drilling continues to show promise in expanding the Offset Zone resource at depth and along strike.
This investor presentation provides an overview of North American Palladium Ltd. (NAP) and its Lac des Iles palladium mine in Ontario, Canada. Some key points:
- The palladium market is expected to remain in deficit due to growing demand from automotive sector and constrained supply from Russia and South Africa.
- NAP's LDI mine is a world-class asset with significant exploration upside potential to increase reserves and resources.
- In 2014, NAP aims to increase production to 170,000-175,000 ounces of palladium at a lower cash cost of $450/ounce by the fourth quarter through expanding mining rates and operational improvements.
- NAP has a strong balance
This document provides an overview of North American Palladium's Lac des Iles mine. It summarizes that the mine has increased proven and probable reserves to 1.3 million ounces of palladium through 2019. It also notes 57 million tonnes of measured and indicated resources beyond reserves, and 15.7 million tonnes of inferred resources. The presentation outlines plans to increase mining rates to 5,000 tonnes per day by the end of 2014 in order to lower costs and extend the mine life.
NAP operates the Lac des Iles mine in Ontario, Canada, one of only two primary palladium mines in the world. The presentation provides an overview of NAP's operations including:
1) Guidance for 2014 of producing 170-175k ounces of palladium at a cash cost of $550/ounce, declining to $450/ounce in Q4.
2) An updated life of mine plan extending the mine life to 2019 with proven and probable reserves of 1.3 million ounces of palladium.
3) Exploration and development upside from existing infrastructure with a $10 million exploration budget to expand resources at depth and along strike.
4) Q1 2014 results that exceeded guidance with
North American Palladium provides an investor presentation covering their flagship Lac des Iles mine. Key points:
1) Lac des Iles is a world class palladium asset that offers production growth potential through increasing mining rates and decreasing costs.
2) As one of only two primary palladium producers globally, North American Palladium is well positioned to benefit from constrained mine supply and growing demand driven by automotive sector growth.
3) The presentation highlights the mine's expansion plans, exploration upside, and leveraging of existing infrastructure to provide future production growth opportunities at Lac des Iles.
NAP's flagship LDI mine offers production growth potential through increasing mining rates and decreasing cash costs. The mine has excess mill and shaft capacity, and exploration upside remains. Palladium prices are expected to remain strong due to constrained mine supply and growing demand from automotive sector emissions regulations. NAP is well positioned to benefit from rising palladium prices as a primary producer.
NAP is a primary palladium producer with its LDI mine in Ontario, Canada. It has a clear strategy to increase production at LDI to 170,000-175,000 ounces in 2014 while lowering costs to $450/ounce. LDI provides leverage to rising palladium prices driven by constrained mine supply and growing demand for palladium from the automotive sector. NAP has additional upside from exploration and development at LDI to leverage its existing infrastructure. The presentation provides an overview of NAP's assets and investment opportunity.
NAP's Lac des Iles mine is a world-class palladium asset that is nearing completion of an expansion to increase production. The expansion targets reaching approximately 4,000 tonnes per day by 2014 through utilization of a new shaft and bulk mining methods. This is expected to lower costs and increase profitability. Additionally, there is significant exploration and development upside to leverage existing infrastructure including at depth, laterally, and through evaluation of a new mining method. The document outlines NAP's investment proposition including production growth, leverage to rising palladium prices, attractive jurisdiction, and development/exploration upside at Lac des Iles.
The document is an investor presentation for North American Palladium that provides an overview of the company and investment case. It discusses North American Palladium's Lac des Iles mine expansion which aims to increase production and lower costs. It also summarizes the palladium market fundamentals of constrained supply and rising demand driven by automotive sector growth.
The document is an investor presentation for North American Palladium. It discusses NAP's investment case including its clear growth strategy to increase palladium production and lower costs through expanding its LDI mine. As one of only two primary palladium producers, NAP is uniquely positioned to benefit from constrained mine supply and rising demand driven by global vehicle production growth. NAP operates in a low-risk jurisdiction with exploration upside and excess milling capacity to accelerate production from new discoveries.
The document is an investor presentation for a mining company that discusses the investment case for palladium. It notes that global palladium supply is constrained, with over 80% coming from Russia and South Africa, which face operating challenges. Demand is growing, led by the automotive sector where palladium is used in catalytic converters. Stricter emissions regulations are driving increased palladium loadings in converters. The company is well positioned to benefit from these supply and demand fundamentals as a primary palladium producer.
The document discusses North American Palladium's investment case and provides an overview of the company. It summarizes that NAP operates the Lac des Iles mine, one of only two primary palladium mines in the world. NAP is undergoing an expansion to increase palladium production to over 250,000 ounces annually at reduced cash costs below $300 per ounce. The Lac des Iles mine has additional exploration upside and excess milling capacity to support future production growth.
The document is an investor presentation that provides an overview of North American Palladium (NAP). It discusses NAP's growth strategy of expanding production at its Lac des Iles mine while lowering costs. It highlights NAP's leverage to rising palladium prices given constrained mine supply and increasing demand from the automotive industry. The presentation also provides market statistics on palladium and an investment case for NAP based on its world-class palladium asset at Lac des Iles.
NAP's Lac des Iles mine in Ontario, Canada is one of only two primary palladium mines in the world. The presentation discusses expanding production at LDI through mine expansion projects which offer production growth and decreasing cash costs. It also notes significant development and exploration upside at LDI and other properties to complement existing mill capacity and infrastructure. Management is experienced and aims to reduce risks through projects at LDI, which has been producing palladium for 20 years.
The document presents an investment case for investing in palladium mining company North American Palladium. It notes that palladium prices are forecast to rise significantly due to strong demand fundamentals and constrained mine supply. Demand is expected to continue growing from the automotive sector, while mine production is concentrated in risky jurisdictions like Russia and South Africa and unable to keep up with demand. North American Palladium offers palladium production growth through mine expansion and has an experienced management team and prudent financial position to support further development.
NAP is an investment opportunity in the palladium market. It owns the Lac des Iles mine, one of only two primary palladium mines globally. The mine is undergoing an expansion to increase production and reduce costs per ounce. Palladium fundamentals are strong due to constrained supply and increasing demand from the automotive sector. NAP offers production growth through the mine expansion and exploration upside on its properties.
- Palladium prices are forecasted to reach historical highs of up to $1,000/oz due to a supply deficit. Demand has historically exceeded mine supply and is expected to continue growing.
- Mine supply is constrained and unable to match rising demand. Over 80% of global mine supply comes from Russia and South Africa, which are high-risk jurisdictions.
- Only 6.3 million ounces of palladium are produced annually worldwide from mines. Major producers in Russia and South Africa have shown constrained production.
NAP is an investment opportunity in the palladium market. It owns the Lac des Iles mine, one of only two primary palladium mines globally. The mine is undergoing an expansion to increase production and reduce costs per ounce. Palladium fundamentals are strong due to constrained supply and increasing demand from the automotive sector. NAP offers production growth through the mine expansion and exploration upside on its properties.
1. Investor
PRESENTATION
• PRESENTATION
November 2012
2. Forward Looking
STATEMENTS
Certain information included in this presentation constitutes ‘forward-looking statements’ within the meaning of the ‘safe
harbor’ provisions of the United States Private Securities Litigation Reform Act of 1995 and Canadian securities laws. The
words ‘expect’, ‘believe’, ‘will’, ‘intend’, ‘estimate’, ‘forecast’, and similar expressions identify forward-looking statements.
Such statements include, without limitation, any information as to our future exploration, financial or operating
performance, including: the Company's forward looking production guidance, projected capital expenditures, operating
cost estimates, project timelines, mining and milling rates, the methods by which ore will be extracted, projected grades,
mill recoveries, and other statements that express management's expectations or estimates of future performance.
Forward-looking statements are necessarily based upon a number of factors and assumptions that, while considered
reasonable by management, are inherently subject to significant business, economic and competitive uncertainties and
contingencies. The factors and assumptions contained in this press release, which may prove to be incorrect, include, but
are not limited to: metal prices assumptions, Canadian and U.S. dollar exchange rate assumptions, that there will be no
significant disruptions affecting operations, that prices for key mining and construction supplies, including labour and
transportation costs, will remain consistent with the Company's expectations, that the Company's current estimates of
mineral reserves and resources are accurate, and that there are no material delays in the timing of ongoing development
projects. The forward-looking statements are not guarantees of future performance. The Company cautions the reader
that such forward-looking statements involve known and unknown risks that may cause the actual results to be materially
different from those expressed or implied by the forward-looking statements. Such risks include, but are not limited to: the
possibility that metal prices, foreign exchange rates or operating costs may differ from management's expectations,
uncertainty of mineral reserves and resources, inherent risks associated with mining and processing, the risk that the Lac des
Iles and Vezza mines may not perform as planned and that the Offset Zone and other properties may not be successfully
developed, and uncertainty of the ability of the Company to obtain financing. For more details on the factors, assumptions
and risks see the Company's most recent Form 40-F/Annual Information Form on file with the U.S. Securities and Exchange
Commission and Canadian provincial securities regulatory authorities. The Company disclaims any obligation to update or
revise any forward-looking statements, whether as a result of new information, events or otherwise, except as expressly
required by law. Readers are cautioned not to put undue reliance on these forward-looking statements.
All dollar amounts are in Canadian currency unless otherwise stated, all references to production refer to payable
production, and all reference to tonnes refer to metric tonnes.
U.S. investors are encouraged to refer to the “Cautionary Note to U.S. Investors Concerning Estimates of Measured,
Indicated and Inferred Resources” in the appendix.
1
3. Investment Case
FOR NAP
COMMODITY GROWTH BALANCE SHEET MANAGEMENT
•Palladium is the •LDI mine expansion •Prudent financial •Experienced senior
number one pick offers production management management &
amongst metal growth with a supports balance operating team
price forecasters decreasing cash sheet to support reduces risk
cost profile & development
•Positive supply & expanding margins programs •LDI has been
demand producing
fundamentals •Significant •$61.1 M in working palladium for 20
driven by development & capital as at Sept. years
constrained mine exploration upside 30, 2012, including
supply & rising complimented by $23.5 M in cash •Over 600
global vehicle excess mill employees and
production capacity, existing contractors driving
infrastructure & growth
•Canada is an permits
attractive PGM
investment
jurisdiction
compared to South
African peers
2
4. Market Statistics
COMPELLING ENTRY POINT
$9.00
SECURITY SYMBOLS NYSE MKT: PAL
$8.00
TSX: PDL
$7.00
TSX: PDL.DB $6.00
MARKET CAPITALIZATION US$242 M $5.00
$4.00
SHARE PRICE US$1.39 $3.00
$2.00
SHARES OUTSTANDING 174 M $1.00
$0.00
52-WEEK HIGH/LOW US$3.31/$1.26
03/01/2011
03/02/2011
03/03/2011
03/04/2011
03/05/2011
03/06/2011
03/07/2011
03/08/2011
03/09/2011
03/10/2011
03/11/2011
03/12/2011
03/01/2012
03/02/2012
03/03/2012
03/04/2012
03/05/2012
03/06/2012
03/07/2012
03/08/2012
03/09/2012
3-MONTH AVERAGE NYSE MKT: 1.6 M
TRADING VOLUME TSX: 0.5 M
CIBC, Haywood, RBC, TOP INSTITUTIONAL SHAREHOLDERS
Leon Esterhuizen Ben Asuncion Sam Crittenden
Cormark, Macquarie, Scotia, 1. T. Rowe Price Associates (7.3%)
Edward Otto Daniel Greenspan Leily Omoumi 2. RBC Global Asset Management (6.3%)
Credit Suisse, Merrill Lynch, Stifel Nicolaus, 3. Franklin Advisers (3.3%)
Nathan Littlewood Michael Parkin George Topping 4. Mackenzie Financial (3.0%)
Euro Pacific, Octagon, 5. AGF Investments (1.2%)
Heiko Ihle Annie Zhang 6. AllianceBernstein (1.0%)
GMP, Raymond James,
Andrew Mikitchook Alex Terentiew
Information as at November 20, 2012, Thomson One. 3
5. Financial
POSITION
• C$61.1 M in working capital as at Sept. 30
• C$23.5 M in cash as at Sept. 30
• C$43 M convertible debenture financing closed Jul. 31
(6.15% interest, C$2.90 conversion price)
• US$60 M operating line (US$28.2 M available)
• C$15 M capital leases
• C$72 M term debt (9.25% interest)
Financial strength & flexibility supports growth strategy
4
7. Palladium Market
FUNDAMENTALS
• Palladium prices forecasted to return to historical highs – up to $1,000/oz
– Palladium price forecasts projected to remain strong: most analysts forecast palladium will
reach US$700 – US$1,000 in 2013
– Supply deficit expected to persist in the future
• Strong demand fundamentals – demand has historically exceeded mine supply
– Majority of demand derived from automobile sector with light vehicle production expected
to increase at a 4% CAGR from 2012 and 2016 (autocatalyst demand for palladium to reach
a record high in 2012)
– Recent significant increase in palladium investment demand reflects positive supply/demand
fundamentals and automotive industry outlook
• Constrained mine supply – unable to match growth in demand
– Majority of mine production comes from challenging jurisdictions (Russia and South Africa –
less attractive regions for committing capital due to ongoing geopolitical risk
– Russian stockpiles, a historical overhang on the market, are now believed to be at or near
depletion
6
8. Palladium Market
MINE SUPPLY
RUSSIA
NORTH
AMERICA 41%
14%
ONLY 6.3 M oz. ANNUAL PRODUCTION WORLDWIDE
~80% OF GLOBAL MINE SUPPLY COMING FROM HIGH-RISK JURISDICTIONS
SOUTH AFRICA
38%
Notes:
1. Source: Johnson Matthey, November 2012 (forecasts for 2012 supply)
2. Other producing countries (~7%) include Zimbabwe, Australia, Botswana, China, Serbia and Montenegro. 7
3. Excludes secondary recycling supply of 2.2 M oz. and ~250,000 oz. From Russian stock sales.
9. Palladium Market
MINE SUPPLY
Constrained Mine Supply From Major Producers
(000’s ounces)
6,000 South Africa Russia
5,500
5,000
4,500
4,000
3,500
3,000
2,500
2,000
1,500
1,000
500
0
2008 2009 2010 2011 2012p 2013p 2014p 2015p
Source: CPM Group, June 2012
• 2012 global palladium supply is expected to fall to the lowest level since 2003 (down11% YoY)
• South African production particularly challenged by deeper mines, power/water limitations,
higher operating costs, geopolitical risks, shortages of skilled labour and strengthening of
currencies
• Considering the recent supply disruption in South Africa and a contraction of underlying output
in Russia, the future production forecasts are expected to be significantly challenged
Notes:
1. Russian supply is entirely from Norilsk Nickel, which produces palladium as a by-product from nickel production.
2. South African supply includes the major platinum producers who produce palladium as a by-product from platinum 8
production.
10. Palladium Market
DEMAND
2012 Gross Demand: 9.7 M oz.
• Demand diversified by
Dental
Other
geography & end market
Investment 5%
Chemical 1% Jewellery
4% • Strongest demand growth in
5%
Automotive 5% regions outside of North
67% Electronics America, Europe and Japan –
12% BRIC economies
• 2012 forecasted to be record
year for autocatalyst demand
(driven by China, North America
& Japan)
Pd. Demand: 2011A 2012E
Autocatalyst 6,030,000 6,480,000
Industrial 2,480,000 2,410,000
Jewellery 505,000 450,000
Investment (565,000) 385,000
Gross demand 8,450,000 9,725,000
Source: Johnson Matthey, November 2012
9
11. Palladium Market
DEMAND FROM AUTO SECTOR
Global Light Vehicle Production Forecast
(000’s)
110,000 102M 104M
95M 99M
100,000 91M Other1
90,000 85M
77M 81M
80,000 Europe
70,000
60,000 North
50,000 America
40,000
30,000 BRIC
Economies2
20,000
10,000
0
2011 2012 2013 2014 2015 2016 2017 2018
Source: IHS Automotive, February 2012
1. Other includes: Japan, Korea, Middle East and Africa
2. BRIC Economies include: Greater China, South America and South Asia
• Global vehicle production biggest source of palladium demand
• Light vehicle production is forecasted to increase to over 100 M units by 2017
• Strong growth to +100 M units by 2017 driven by BRIC economies 10
12. Palladium Market
FABRICATION DEMAND
Adoption of Stricter Emission Control Standards
2005 2006 2007 2008 2009 2010 2011 2012 2013 2014 2015
Europe Euro IV Euro V Euro VI
Beijing Euro III Euro IV Euro V
China
Nationwide Euro II Euro III Euro IV Euro V
Select Cities Euro III Euro IV
India
Nationwide Euro II Euro III
Russia Euro I Euro II Euro III Euro IV Euro V
USA Tier 2 and LEV II
Brazil Prconve 3 Prconve 4 Prconve 5 Prconve 6
Source: CPM Group, June 2012
• Emerging economies have adopted emission control standards that mandate the
use of catalytic converters
• Advancing to a higher level of emission controls results in higher PGM loadings in
the catalytic converter
• Tightening emission control regulations for heavy-duty trucks
11
13. Use of Palladium in
CATALYTIC CONVERTERS
Vast majority of 2020 cars still projected to be gas and diesel
Gasoline Engines Hybrids & Other New Forms
• Use +90% palladium (of total required • Neutral impact on PGM use
PGM content) • Gasoline hybrids tend to use as much
palladium as normal gasoline engines
Diesel Engines • Currently account for only 1% of global
• Historically used platinum due to cars sales1
technical requirements • Forecasted to be 14% of overall market
• Currently use 30% palladium, with scope by 20202
to increase to 50% due to advent of low
sulphur diesel fuel Electric
• No requirement for catalytic converters
• Challenged by lack of infrastructure to
recharge, high costs, long charging
periods and short driving range
• Forecasted to account for only 2% of
global car sales by 20202
1. CPM Group, June 2010
2. Stefan Bratzel, director of the Centre of Automotive Management in Germany; as reported in Mitsui Global Precious
Metals “Pole Position” Report, June 2010 12
14. Palladium Market
INVESTMENT DEMAND
Exchange Traded Funds' Physical Palladium Holdings
M oz. Pd. M oz. Pd.
2.5 2.5
Mitsubishi
SPAL
2.0 SPDM 2.0
WITE
GLTR
1.5 Julius Baer 1.5
PALL
MSL ASX
1.0 Palladium ZKB 1.0
PHPD LSE
0.5 0.5
0.0 0.0
2007 2008 2009 2010 2011 2012
• Large increase in palladium investment demand
• Investment demand driven by supply/demand fundamentals for palladium --
constrained mine supply and growth in global vehicle production
Source: CPM Group, as at May 28, 2012 13
15. Palladium Market
PRICE PERFORMANCE
Historic Price Performance (US$/oz) Average Annual Price Forecast (US$/oz)
$900 PALLADIUM 2012 2013
BMO $643 $725
$800
Canaccord Genuity $656 $775
$700 CIBC $610 $700
$600 Cormark $650 $750
$500 Credit Suisse $640 $700
$400 Deutsche Bank $679 $750
Dundee $678 $700
$300
J.P.Morgan $635 $700
$200 Macquarie $746 $1,019
$100 Morgan Stanley $638 $708
$0 National Bank Financial $672 $750
02/01/2008 02/01/2009 02/01/2010 02/01/2011 02/01/2012 Raymond James $648 $856
RBC $650 $750
Historic High: US$1,090 (2001) Scotiabank $644 $725
2011 Average Price: US$733 Societe Generale $710 $800
Recent Price: US$641 (Nov. 21, 2012 NY close) TD Securities $653 $600
Average $660 $751
Sources: Thomson One, Bloomberg and available equity research.
14
17. LDI Mine & Mill Complex
A WORLD CLASS ASSET
• Located north of Thunder Bay, Ontario, Canada
• One of only two primary palladium producers in the world
• Deposit is unique in the world: high palladium concentration,
broadly disseminated mineralization vs. narrow vein
• Total production of +2.6 M oz of palladium since 1993
• Currently undergoing a major expansion to increase production
and reduce cash costs per ounce
• 15,000 tpd mill has excess capacity available for production growth (currently operating at
35% capacity)
• Significant exploration upside identified on the LDI property
• Notable safety award received for lowest reportable injury rates in 2011
16
15
18. LDI Mine
OPERATING METRICS
Q1 2012 Q2 2012 Q3 2012 YTD* 2012 Guidance
Payable Pd. Production1 41,760 oz. 40,017 oz. 37,908 119,685 150,000 - 160,000 oz.
Cash Cost (US$/oz)1 $380 $429 $423 $412 $375 - $400
Total Tonnes Of Ore Milled
519,944 528,068 504,022 1,552,034 1.8 M – 2.0 M
(Underground & Surface)
Average Pd. Head Grade 3.5 g/t 3.4 g/t 3.3 g/t 3.4 g/t 3.7 g/t
Pd. Mill Recovery 77% 77% 77% 77% 78%
*For the nine month period ended Sept. 30, 2012.
On track to meet 2012 production guidance
1. Cash cost per ounce is a non-IFRS measure. For reconciliation of historical total cash costs per ounce to production costs, please
refer to the Company’s financial statements. Cash costs per ounce are presented net of byproduct credits and can be
materially affected by changes in byproduct metal prices, as well as the Canadian/US dollar exchange rate. The 2012 cash cost
guidance assumes: US$1,600 per ounce gold, US$1,600 per ounce platinum, US$8.50 per pound nickel, US$3.50 per pound copper 17
and an exchange rate of C$1.00 to US$1.00.
19. LDI Mine Expansion
PLAN FOR GROWTH
• Transitioning from mining via ramp to via
Surface
shaft access in 2013
OPEN PIT
• Bulk mining method:
ROBY
– long-hole stoping with primary &
ZONE
secondary stoping blocks SHAFT
North
• Currently sinking a shaft to 795 metres from
surface
• Targeting production via shaft at 3,500 tpd
795 Metres
in Q3, 2013
• Shaft is being sized for 7,000 tpd OFFSET
ZONE
• Plan to ramp up underground mining rate
to 5,500 tpd by 2015
– Production expected at ~250,000 oz/yr
– Cash costs expected to decline to the 1,345 Metres
low US$200/oz range
The underground design schematic of LDI, showing the deposit and
underground ramp infrastructure, looking east.
18
20. LDI Mine Expansion
DEVELOPMENT PROGRAM
2012 Capital budget of $116 M to:
Complete surface construction activities • $93 M spent YTD as at Sept. 30, 2012
Advance shaft sinking to the 795-metre
level • Mine expansion capital cost
Complete development of 735-metre summary:
mine level
Year Capex
Commence set up of mining stopes for
Offset Zone production 2010 $26 M
Commence shaft commissioning by YE 2011 $143 M
2012 E $116 M
2013 development work to focus on:
Advancing underground development
(including mine level development and
setting up mining stopes)
Completing sinking the shaft to the 795-
metre level
19
21. LDI Mine Expansion
RECENT MILESTONES COMPLETED
Surface construction for the shaft is Surface view, Nov. 6, 2012
essentially completed
Service hoist, auxiliary hoist, main
electrical substation, and all the
related power systems at the hoist
house were successfully
commissioned
Mining of the first Offset Zone stope
has commenced
Shaft sinking is underway and on
target for the production hoist to be
operational for hoisting ore at the
Construction of the
beginning of the third quarter in 2013
production hoist,
Nov. 2012
Underground ramp and stope
development progressing on
schedule
Major components for the production
hoist have arrived on site and
installation has commenced
20
22. LDI Exploration
SIGNIFICANT 2012 PROGRAM
• $16 M budget for palladium exploration*
• 70,000 metres of drilling planned
– 64,000 metres at LDI
– 6,000 metres at other nearby properties
• LDI program objectives:
To expand reserves & resources and
identify new targets
Underground exploration targeting the
Offset Zone – infill drilling & testing Offset
Zone extensions towards surface, at depth
& south
Drilling at North LDI, North VT Rim and
other potential zones
* $10 M of the budget (55,000 of the 64,000 metres to be drilled
at LDI) is in connection with the LDI mine expansion and is
included in the $116 M capital expenditure budget.
21
23. LDI Mine
NEW UNDERGROUND ZONES
Sheriff Zone discovered in 2010, extends to surface.
New Zones Have Potential to Increase
Production Utilizing Existing Underground
Infrastructure
Cowboy & Outlaw Zones discovered in
2009; located west of the Offset Zone. 22
24. LDI Property
EXPLORATION UPSIDE
Near-mine land package 62,000-acre regional land package
South Norite Zone
Mineralization Trend
• LDI represents a rare palladium-rich asset with excellent infrastructure
• LDI complex has only been drilled in a 1km x 1km area & remains largely underexplored
• Multiple targets identified for follow up exploration (surface & underground)
• Regional land package covers the most prospective mafic complexes in the area (all PGM
properties are less than 30 km from LDI mill) 23
25. Plan:
PRODUCE MORE, FOR LESS
Transition to shaft mining
Leverage existing infrastructure
Realize exploration upside
24
26. Upcoming
MILESTONES
CURRENT PRIORITIES
• Advancing LDI mine expansion
• Realizing value for the gold division assets
• Advancing ongoing near-mine & greenfields palladium exploration
programs
UPCOMING MILESTONES
• Providing 2013 production & capex guidance (January 2013)
• Converting Offset Zone resources to reserves (Q1, 2013)
• Filing updated NI 43-101 report on the Offset Zone (Q1, 2013)
• Commencing mining via shaft at LDI (Q3, 2013)
25
27. Compelling
INVESTMENT OPPORTUNITY
LEVERAGE TO RISING PALLADIUM PRICES
CLEAR STRATEGY TO INCREASE
PRODUCTION & LOWER CASH COSTS
ATTRACTIVE PGM INVESTMENT
JURSIDICTION
UPSIDE IN EXPLORATION & DEVELOPMENT
26
28. Shareholder
INFORMATION
North American Palladium’s vision is to become a low cost, mid-tier precious metals company operating in
mining friendly jurisdictions. NAP is an established precious metals producer that has been operating its flagship
Lac des Iles mine (LDI) located in Ontario, Canada since 1993. LDI is one of only two primary producers of
palladium in the world, and is currently undergoing a major expansion to increase production and reduce cash
costs per ounce. NAP also operates the Vezza gold mine located in the Abitibi region of Quebec. NAP’s
experienced management and technical teams have a significant commitment to exploration and are
dedicated to building shareholder value.
Corporate Office: Royal Bank Plaza, South Tower
200 Bay St., Suite 2350
Toronto, ON M5J 2J2
Security Symbols: NYSE MKT– PAL
TSX – PDL, PDL.DB
Website: www.nap.com
Investor Relations: Camilla Bartosiewicz
Director, Investor Relations & Corporate Communications
camilla@nap.com
416-360-7374 27
30. Senior
MANAGEMENT
Andre Douchane – Chairman and Interim CEO
Mr. Douchane is a seasoned mining executive with over 40 years of experience in the mining industry with a solid track record of successfully
bringing development projects into production. He was appointed to the Company’s Board of Directors in April 2003, and served as the
President and CEO until January 2006. Mr. Douchane is currently the Chief Executive Officer of THEMAC Resources Group Ltd., a Vancouver-
based resource company focused on exploring and developing natural resource properties. Previously, he held senior positions with several
precious and base metal international mining companies including President and CEO of Starfield Resources Inc., President and COO of Chief
Consolidated Mining Co., and Vice President, Operations of Franco and Euro-Nevada (Newmont Mining Corporation). He holds a Bachelor’s
degree in Mining Engineering from the New Mexico Institute of Mining and Technology and is a graduate of the Executive Business Program at
the Kellogg School of Business in Toronto.
Greg Struble – VP and COO
Mr. Struble is a mine engineer with over 30 years of experience in underground mining. Prior to joining NAP, he served as Executive Vice
President and Chief Operating Officer of Stillwater Mining Company, where he was responsible for two underground palladium mines as well as
smelter and refinery operations. Prior to this, he worked as underground project manager for Barrick Gold’s Cortez Hills Joint Venture. Mr. Struble
has also worked internationally at a number of large gold mines, including General Manager of the El Penon Mine in Chile and the Jerritt
Canyon Mines in Nevada. Previously, he worked for the Homestake Mining Company and held various positions including Mine Superintendent
at their Homestake Mine in South Dakota.
Jeff Swinoga – VP, Finance and CFO
Mr. Swinoga has over eighteen years of experience in the resource, mining and finance industries. He brings a wealth of experience in leading
debt and equity transactions, including project financings for mine development. He has served as Senior Vice President, Finance & CFO of
MagIndustries Corp., Vice President, Finance & CFO of HudBay Minerals Inc., and was Director, Treasury Finance of Barrick Gold Corporation for
seven years. Mr. Swinoga is a Chartered Accountant and also holds a Master of Business Administration degree from the University of Toronto
and a Honours Economics degree from the University of Western Ontario. Mr. Swinoga has overall responsibility for the company’s financial
activities.
David C. Peck – Head of Exploration
Dr. Peck is a Professional Geoscientist with nearly 30 years of exploration and research experience specializing in magmatic Ni-Cu-PGE ore
deposits. Dr. Peck holds global recognition as an expert in PGE exploration after serving as a senior technical and strategic consultant to
several public and private companies and having worked on exploration and mining projects in more than a dozen countries. He was directly
involved in several significant magmatic Ni-Cu-PGE discoveries in Canada and overseas. Prior to joining NAP, Dr. Peck served as President and
Senior Technical and Strategic Consultant at Revelation Geoscience Ltd., and prior to this, he served as Global Nickel Commodity Leader at
Anglo American plc, a Senior Geologist for Falconbridge Ltd., a Senior Mineral Deposits Geologist with the Manitoba Geological Survey, held
various academic roles in Canadian universities, and was the technical lead on a multi-year mineral potential study funded by the Ontario
Geological Survey. He has authored numerous public presentations and government and academic publications addressing his area of
specialization.
29
31. Cautionary Note to U.S. Investors Concerning
MINERAL RESERVES AND MINERAL RESOURCE
• Mineral reserves and mineral resources have been calculated in accordance with National Instrument
43-101 as required by Canadian securities regulatory authorities. For United States reporting purposes,
Industry Guide 7, (under the Securities and Exchange Act of 1934), as interpreted by Staff of the Securities
Exchange Commission (SEC), applies different standards in order to classify mineralization as a reserve. In
addition, while the terms “measured”, “indicated” and “inferred” mineral resources are required pursuant
to National Instrument 43-101, the U.S. Securities and Exchange Commission does not recognize such
terms. Canadian standards differ significantly from the requirements of the SEC, and mineral resource
information contained herein is not comparable to similar information regarding mineral reserves
disclosed in accordance with the requirements of the U.S. Securities and Exchange Commission. U.S.
investors should understand that “inferred” mineral resources have a great amount of uncertainty as to
their existence and great uncertainty as to their economic and legal feasibility. In addition, U.S. investors
are cautioned not to assume that any part or all of NAP's mineral resources constitute or will be
converted into reserves. For a more detailed description of the key assumptions, parameters and
methods used in calculating NAP’s mineral reserves and mineral resources, see NAP’s most recent Annual
Information Form/Form 40-F on file with Canadian provincial securities regulatory authorities and the SEC.
• Please refer to North American Palladium’s most current Annual Information Form and applicable
technical reports available on www.sedar.com, www.sec.gov and www.nap.com for further information.
30
32. LDI Palladium Mine
RESERVES & RESOURCES
March 31, 2012
LDI MINERAL RESERVES
Tonnes Pd Pt Au Ni Cu Pd
CATEGORY (000'S) (g/t) (g/t) (g/t) (%) (%) (000's oz)
PROVEN
Roby Zone 420 6.38 0.42 0.34 0.08 0.07 86
Open Pit 722 1.99 0.21 0.22 0.11 0.10 46
PROBABLE
None Reported - - - - - - -
TOTAL PROVEN & PROBABLE 1,143 3.61 0.29 0.26 0.10 0.09 132
LDI MINERAL RESOURCES
Tonnes Pd Pt Au Ni Cu Pd
CATEGORY (000'S) (g/t) (g/t) (g/t) (%) (%) (000's oz)
MEASURED
Offset Zone 7,136 5.45 0.37 0.37 0.13 0.10 1,251
Open Pit 1,971 2.00 0.24 0.15 0.05 0.07 126
Stockpile 83 1.63 0.17 0.14 0.08 0.06 4
TOTAL MEASURED 9,189 4.68 0.34 0.32 0.11 0.09 1,382
INDICATED
Offset Zone 7,062 4.98 0.35 0.34 0.12 0.10 1,131
Roby Zone 1,269 7.16 0.41 0.33 0.08 0.06 292
Open Pit 2,565 2.20 0.24 0.18 0.07 0.08 181
Low Grade Stockpile 13,188 0.97 0.12 0.08 0.06 0.03 411
TOTAL INDICATED 24,084 2.60 0.22 0.18 0.08 0.06 2,016
TOTAL MEASURED & INDICATED 33,273 3.18 0.25 0.22 0.09 0.07 3,398
INFERRED
Offset Zone 6,292 4.40 0.37 0.30 0.10 0.09 889
31
See accompanying Notes on the next page.
33. LDI Reserves & Resources
NOTES
1. Prepared in accordance with National Instrument 43-101 – Standards of Disclosure for Mineral Projects (NI 43-101) and the Canadian
Institute of Mining, Metallurgy and Petroleum classification system. U.S. investors should refer to the Annual Information Form for an
overview on how Canadian standards differ significantly from U.S. requirements.
2. Palladium ounces are stated as contained ounces. Disclosure of contained ounces is permitted under Canadian regulations; however,
the SEC generally permits resources to be reported only as in place tonnage and grade.
3. Mineral Resources for the Offset Zone were estimated from drilling completed to March 31, 2012 by Todd McCracken, P.Geo., of Tetra
Tech, an independent Qualified Person within the meaning of NI 43-101. The mineral resource calculation uses a minimum 3.5 g/t Pd
resource block cut-off. The mineral resource estimate is based on the combination of geological modeling, geostatistics and
conventional block modeling (5 m x 5 m x 5 m blocks). Assay grade capping was determined not to be necessary. The Offset Zone
resource models used the ordinary kriging (OK) grade interpolation method within a three-dimensional block model with mineralized
zones defined by wireframed solids. The QA/QC protocols and corresponding sample preparation and shipment procedures for the
Offset Zone have been reviewed by Tetra Tech. Resources were estimated to the 4070 Mine Level (-930 m elevation), a maximum depth
of 1,430 m. The following metal price assumptions were used: US$475/oz palladium, US$1,500/oz platinum, US$1,200/oz gold, US$9.00/lb
nickel, and US$3.25/lb copper. A US$/Cdn$ exchange rate of US$0.95 = CDN$1.00 was also applied.
4. The mineral reserve and resource estimate for the Roby Zone, open pit and stockpiles were estimated as of June 30, 2010 by Scott
Wilson RPA and updated by David Penna, P.Geo., an employee of the Company and a Qualified Person under 43-101 to reflect: (i)
additions to mineral reserves in the Roby Zone as a result of a lower cut-off palladium grade; (ii) depletion from production up to March
31, 2012, and (iii) mineral reserves from the crown pillar (supported by an internal engineering report). The following cut-off grades were
used: (i) 1.8 g/t PdEq for the Roby open pit, within an optimized pit shell run below the current pit survey; (ii) 1.9 g/t PdEq for the mine
stockpiles; and (iii) 5.8 g/t PdEq for the underground Roby Zone. These cut-off grades were determined under the assumption that
production would take place at a rate of 14,000 tpd. Metal price assumptions of US$350/oz palladium, US$1,400/oz platinum, US$850/oz
gold, US$6.50/lb nickel, and US$2.00/lb copper were used in the estimation of cut-off grade. A US$/Cdn$ exchange rate of 1.11 was also
applied.
5. Mineral resources which are not mineral reserves do not have demonstrated economic viability. The estimate of mineral resources may
be materially affected by environmental, permitting, legal, title, taxation, sociopolitical, marketing, or other relevant issues. The quantity
and grade of reported inferred resources in this estimation are uncertain in nature and there has been insufficient exploration to define
these Inferred resources as an Indicated or Measured mineral resource and it is uncertain if further exploration will result in upgrading
them to an Indicated or Measured mineral resource category.
6. Numbers may not add due to rounding.
32
34. $0
$200
$400
$600
$800
$1,000
$1,200
Impala Mine (IMP)
Bokoni (ATL)
Everest South (AQP)
Marikana (AQP/AMS)
Smokey Hills (PLA)
Modikwa (ARM/AMS)
Crocodile River (ELR)
Marikana (LMI)
Thembelani Mine (AMS)
Source: CIBC World Markets, based on H1 CY12
Kroondal (AQP/AMS)
Khuseleka Mine (AMS)
Zondereinde (NHM)
Khomanani Mine (AMS)
Pandora (LMI/AMS)
Rustenburg Section (AMS)
LDI is a Low Cost Producer
Unki (AMS)
Union Section (AMS)
Tumela Mine (AMS)
Amandelbult Section (AMS)
• NAP is one of the lowest cash cost producers
Siphumelele Mine (AMS)
Bathopele Mine (AMS)
Dishaba Mine (AMS)
Marula (IMP)
BRPM (RBP)
Mogalakwena (AMS)
Nye Mine (SWC)
PALLADIUM CASH COST CURVE
Mototolo (XTA/AMS)
Boulder (SWC)
Mimosa (IMP/AQP)
Platinum Mile (AQP)
W/L Tailings (AMS)
CTRP (AQP/SLP)
Two Rivers (ARM/IMP)
LDI Mine (PDL)
Cash Costs per PdEq Oz
Sylvania Dumps (SLP)
Average Pd Price Received
Zimplats (IMP)
33
35. Palladium Market
MARKET DYNAMICS
• The palladium market is expected to remain in a position of undersupply over
the 2012 to 2016 period – will allow prices to remain robust
World Palladium Supply and Demand Forecast
2009 2010 2011 2012E 2013E 2014E 2015E
(In koz, unless otherwise noted)
Supply
Mine Production 6,320 6,613 6,966 6,825 6,925 7,125 7,225
Scrap 1,184 1,454 1,620 1,770 1,980 2,130 2,250
Total Palladium Supply 7,504 8,067 8,586 8,595 8,905 9,255 9,475
Change (YoY %) (3.2%) 7.5% 6.4% 0.1% 3.6% 3.9% 2.4%
Total Palladium Consumption 7,591 8,642 8,740 8,920 9,475 9,790 10,000
Change (YoY %) (9.5%) 13.9% 1.1% 2.1% 6.2% 3.3% 2.1%
Implied Market Balance (87) (575) (154) (325) (570) (535) (525)
Stock Releases 1,100 800 800 150 150 -- --
ETF Investment 507 1,038 (514) -- -- -- --
Implied Residual Balance 507 (813) 1,160 (175) (420) (535) (525)
Source: Thomson Reuters GFMS, LPPM, RBS (Commodity Companion - Truly Precious, May 4th 2012) 34
36. Palladium Market
HISTORIC PRICE AND FORECAST
• Palladium is trading at the highest levels since 2001 and is projected to remain
strong through 2017 Street Consensus
Year Pd Price
Recent performance of Palladium (US$/oz) 2012E
2013E
$640
$740
$1,200 2014E $815
Stockpiling by Auto Manufacturers 2015E $810
(to meet emission control standards) 2016E $785
$1,000 LT $765
Palladium Price (US$/oz)
$800
Financial Crisis
$600
Palladium has averaged US$640/oz
$400 YTD in 2012
(low of US$563/oz to high of US$724/oz)
*Most forecasts are only available
$200 until 2015
Russian stockpile sales suppress prices
$0
94 95 96 97 98 99 00 01 02 03 04 05 06 07 08 09 10 11 12 13 14 15 16 17
Note: Forecast based on available consensus estimates 35
37. Palladium
PRICE FORECASTS
PALLADIUM 2012 2013 2014 2015 2016 LT
BMO $643 $725 $750 $700 $650 $650
Canaccord Genuity $656 $775 $850 $900
CIBC $610 $700 $900 $1,000 $800 $700
Cormark $650 $750 $750
Credit Suisse $640 $700 $800 $850 $900
Deutsche Bank $679 $750 $800 $900 $1,000 $1,000
Dundee $678 $700 $775 $750 $700 $600
J.P.Morgan $635 $700 $881 $1,000
Macquarie $746 $1,019 $950 $800
Morgan Stanley $638 $708 $780 $850 $1,092 $1,106
National Bank Financial $672 $750 $750 $750 $750 $550
Paradigm $700 $560 $560 $560 $560 $560
Raymond James $648 $856 $1,000 $950 $850 $800
RBC $650 $750 $850 $850 $750 $750
Scotiabank $644 $725 $750 $750 $700 $650
Societe Generale $710 $800
TD Securities $653 $600 $550
Average $660 $740 $815 $810 $785 $765
Source: Scotiabank – based on available equity research 36
38. Gold Division
OVERVIEW
• NAP is currently exploring divestiture opportunities of its non-
core portfolio of gold assets
• Portfolio consists of significantly de-risked gold assets in
Quebec with total mineral resource inventory of 1.5 MM oz Au:
• Vezza Mine – High-grade, underground, fully permitted
gold mine with near-term cash generation potential
(ready for commercial production)
• Sleeping Giant Mine & Mill Complex – Fully permitted,
900 tpd regional mill with potential to be expanded to
1,750 tpd
• Dormex, Flordin & Discovery Projects – Advanced and
early stage exploration properties with blue sky potential,
within trucking distance to regional mill
37
39. Gold Division
OVERVIEW
Divestiture strategy driven by:
• Gold assets are non-core to NAP
• Equity investor preference for pure play PGM exposure (gold diversification strategy
perceived to dilute the palladium brand)
• Newly identified exploration & development upside in palladium assets that will give the
Company growth in palladium (therefore not relying on growth through diversification)
• Lack of “mass scale” in gold production growth due to Sleeping Giant mine closure in early
2012
• Significant development milestones reached at Vezza have well positioned the asset for
sale (warrants more attractive valuation now that operations have commenced)
38