Downloaded 10 times


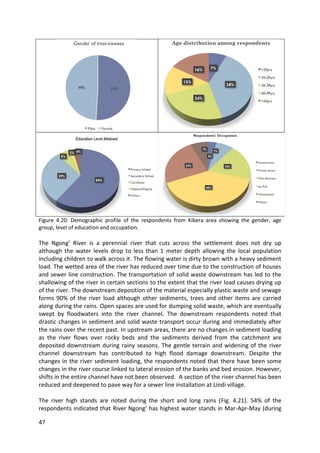
![25
m) Literacy levels
Majority of the population in Kibera are youth between the ages of 15-36. Due to the
economic situation most have attained primary school education.
3.4 Nairobi Informal Settlements - Typology of Mukuru Kwa Njenga Slum
3.4.1 Introduction
Mukuru kwa Njenga is a slum in the East of Nairobi, the capital of Kenya. It belongs
to Embakasi Constituency. The genesis of this settlement dates back to 1958. Part of the
place was an old quarry where most stones that built the factories were excavated. To solve
this problem, different villages were created in 2002 as a way of providing security, pointing
leaders in each village in order to have control over the affairs in the area. From then, the
area was sub divided into eight villages (zones): Sisal, Milimani, Vietnam, Riara, Moto Moto,
Wape Wape, Zone 48 and MCC. Most of the inhabitants are immigrants from rural areas
looking for job opportunities.
Sisal was the first area built up in 1984, followed by Milimani, Vietnam and the North part of
Zone 48 in the next ten years. These areas, built up as demand for shelter increased, are
characterized by high urban congestion, an organic and unplanned urban layout but also by
a more organized population. The other four villages started from a need of expansion of
the congested villages from 1998 to 2000. They were planned by the community and are
characterized by a more organized urban layout.
The name Mukuru Slum is coined from the Kikuyu word "Mukuru" meaning place of
depression. The other four villages started from a need of expansion of the congested
villages from 1998 to 2000. They were planned by the community and are characterized by
a more organized urban layout.
3.4.2 Context
Mukuru Kwa Njenga is part of the larger cluster of Mukuru informal settlements situated
about 8 km to the southeastern side of Nairobi’s central business district, along the
industrial area. Mukuru Kwa Njenga Settlement is strategically located, within 20-30 minute
drive from the city Centre of Nairobi. Its proximity to the city and to the industrial area gives
it numerous advantages. The slum is surrounded by three major roads: Mombasa Road on
the Southern Side, Outering Road on the North Eastern side and Airport North Road on the
South Eastern side. The settlement spreads over two sub locations, namely Imara Daima
Sub-location to the West and Mukuru Kwa Njenga Sub-location to the East [IEBC 2011].](https://image.slidesharecdn.com/1b6aeb51-f198-48ef-8a66-1574e68e8b82-160924193859/85/Nairobi-Informal-Settlements_CC_Final-Report_22Apr2016-1-25-320.jpg)

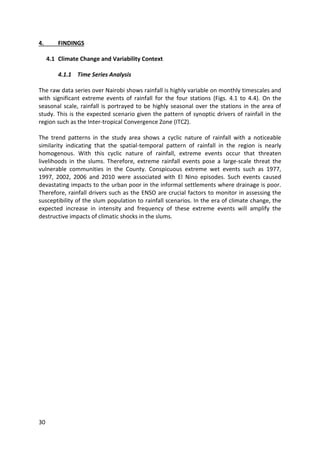


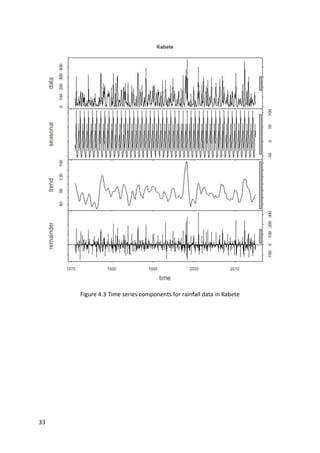


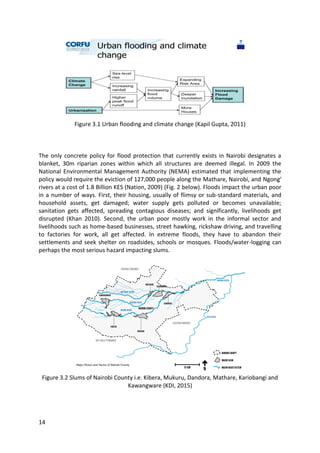
This report summarizes research on climate resilience options for slums and informal settlements in Nairobi, Kenya. It finds that population density exacerbates flood impacts within the slums. Analysis of rainfall data from four stations shows flooding occurs mainly during two rainy seasons and is associated with extreme short-term rainfall events as well as El Niño rains. Flooding hotspots were identified in all three studied slums. However, non-climatic factors like location in ecologically fragile areas and poor drainage and waste management also increase vulnerability. The report recommends adaptation actions including climate-proofed housing, flood early warning systems, climate-proofed infrastructure, cooperation between organizations, strengthened disaster response institutions, and education on risk reduction. Data


