The document summarizes real estate data for the Greater Toronto Area in April 2012. It reports that home sales were up 18% compared to April 2011, with the strongest growth in single-detached homes which saw a 22% increase. The average home price rose 8.5% year-over-year to $517,556. While price growth was highest for single-detached homes, condominiums saw a more moderate 4% increase. Affordability remains good due to low mortgage rates, though rates are expected to rise in the next two years.
Toronto real estate statistics january 2012John Helfrich
Toronto Real Estate Market Statistics for January 2012. Focus on East End Toronto Homes and East End Toronto Real Estate. The Toronto Beaches, Riverdale, Leslieville, Danforth Village, East Danforth, Danforth Mosaic.
Below is the latest resale market figures for August in Greater Toronto Area which inlcude both the 416 and 905 region. There has been a reduction in Sales for August from last year at this time however it should be noted that last year was the second highest year in the history of the Toronto Real Estate Board. Personally I continue to be quite bullish about the Toronto market as I am noticing more the ever, a more suburban City turning into a more urban City: Larger population and immigration, making homes more expensive and expanding upward.
Toronto real estate statistics December 2011John Helfrich
Toronto Real Estate Market Statistics for December 2011. Focus on East End Toronto Homes and East End Toronto Real Estate. The Toronto Beaches, Riverdale, Leslieville, Danforth Village, East Danforth, Danforth Mosaic
Greater Toronto Area REALTORS® reported 5,793 sales in November 2012 – down by 16 per cent compared to November 2011. “Transactions have been down on a year-over-year basis since June, after being up substantially in the last half of 2011 and the first half of 2012. Some buyers pulled
Toronto real estate statistics august 2011John Helfrich
Toronto Real Estate Market Statistics for August 2011. Focus on East End Toronto Homes and East End Toronto Real Estate. The Beaches, Riverdale, Leslieville, Danforth Village, East Danforth, Danforth Mosaic
Toronto real estate statistics july 2011John Helfrich
Toronto Real Estate Market Statistics for July 2011. Focus on East End Toronto Homes and East End Toronto Real Estate. The Beaches, Riverdale, Leslieville, Danforth Village, East Danforth, Danforth Mosaic
Toronto real estate statistics October 2011John Helfrich
Toronto Real Estate Market Statistics for October 2011. Focus on East End Toronto Homes and East End Toronto Real Estate. The Beaches, Riverdale, Leslieville, Danforth Village, East Danforth, Danforth Mosaic
Toronto real estate statistics november 2011John Helfrich
Toronto Real Estate Market Statistics for November 2011. Focus on East End Toronto Homes and East End Toronto Real Estate. The Beaches, Riverdale, Leslieville, Danforth Village, East Danforth, Danforth Mosaic
Toronto Real Estate Statistics september 2011John Helfrich
Toronto Real Estate Market Statistics for September 2011. Focus on East End Toronto Homes and East End Toronto Real Estate. The Beaches, Riverdale, Leslieville, Danforth Village, East Danforth, Danforth Mosaic
Here are the most recent reports from the Toronto Real Estate Board about the activity in the Condominium resale market...Not to be confused with the New Condo Market which is mostly direct through the builder.
Here is the most recent 4th quarter reports from the Toronto Real Estate Board provided by Richard Silver. Here are the sales and listings of Condominiums or Condos in the Greater Toronto Area. This would include houses, apartments and townhouses...
Kseniya Leshchenko: Shared development support service model as the way to ma...Lviv Startup Club
Kseniya Leshchenko: Shared development support service model as the way to make small projects with small budgets profitable for the company (UA)
Kyiv PMDay 2024 Summer
Website – www.pmday.org
Youtube – https://www.youtube.com/startuplviv
FB – https://www.facebook.com/pmdayconference
VAT Registration Outlined In UAE: Benefits and Requirementsuae taxgpt
Vat Registration is a legal obligation for businesses meeting the threshold requirement, helping companies avoid fines and ramifications. Contact now!
https://viralsocialtrends.com/vat-registration-outlined-in-uae/
Attending a job Interview for B1 and B2 Englsih learnersErika906060
It is a sample of an interview for a business english class for pre-intermediate and intermediate english students with emphasis on the speking ability.
Falcon stands out as a top-tier P2P Invoice Discounting platform in India, bridging esteemed blue-chip companies and eager investors. Our goal is to transform the investment landscape in India by establishing a comprehensive destination for borrowers and investors with diverse profiles and needs, all while minimizing risk. What sets Falcon apart is the elimination of intermediaries such as commercial banks and depository institutions, allowing investors to enjoy higher yields.
Buy Verified PayPal Account | Buy Google 5 Star Reviewsusawebmarket
Buy Verified PayPal Account
Looking to buy verified PayPal accounts? Discover 7 expert tips for safely purchasing a verified PayPal account in 2024. Ensure security and reliability for your transactions.
PayPal Services Features-
🟢 Email Access
🟢 Bank Added
🟢 Card Verified
🟢 Full SSN Provided
🟢 Phone Number Access
🟢 Driving License Copy
🟢 Fasted Delivery
Client Satisfaction is Our First priority. Our services is very appropriate to buy. We assume that the first-rate way to purchase our offerings is to order on the website. If you have any worry in our cooperation usually You can order us on Skype or Telegram.
24/7 Hours Reply/Please Contact
usawebmarketEmail: support@usawebmarket.com
Skype: usawebmarket
Telegram: @usawebmarket
WhatsApp: +1(218) 203-5951
USA WEB MARKET is the Best Verified PayPal, Payoneer, Cash App, Skrill, Neteller, Stripe Account and SEO, SMM Service provider.100%Satisfection granted.100% replacement Granted.
Business Valuation Principles for EntrepreneursBen Wann
This insightful presentation is designed to equip entrepreneurs with the essential knowledge and tools needed to accurately value their businesses. Understanding business valuation is crucial for making informed decisions, whether you're seeking investment, planning to sell, or simply want to gauge your company's worth.
Premium MEAN Stack Development Solutions for Modern BusinessesSynapseIndia
Stay ahead of the curve with our premium MEAN Stack Development Solutions. Our expert developers utilize MongoDB, Express.js, AngularJS, and Node.js to create modern and responsive web applications. Trust us for cutting-edge solutions that drive your business growth and success.
Know more: https://www.synapseindia.com/technology/mean-stack-development-company.html
Enterprise Excellence is Inclusive Excellence.pdfKaiNexus
Enterprise excellence and inclusive excellence are closely linked, and real-world challenges have shown that both are essential to the success of any organization. To achieve enterprise excellence, organizations must focus on improving their operations and processes while creating an inclusive environment that engages everyone. In this interactive session, the facilitator will highlight commonly established business practices and how they limit our ability to engage everyone every day. More importantly, though, participants will likely gain increased awareness of what we can do differently to maximize enterprise excellence through deliberate inclusion.
What is Enterprise Excellence?
Enterprise Excellence is a holistic approach that's aimed at achieving world-class performance across all aspects of the organization.
What might I learn?
A way to engage all in creating Inclusive Excellence. Lessons from the US military and their parallels to the story of Harry Potter. How belt systems and CI teams can destroy inclusive practices. How leadership language invites people to the party. There are three things leaders can do to engage everyone every day: maximizing psychological safety to create environments where folks learn, contribute, and challenge the status quo.
Who might benefit? Anyone and everyone leading folks from the shop floor to top floor.
Dr. William Harvey is a seasoned Operations Leader with extensive experience in chemical processing, manufacturing, and operations management. At Michelman, he currently oversees multiple sites, leading teams in strategic planning and coaching/practicing continuous improvement. William is set to start his eighth year of teaching at the University of Cincinnati where he teaches marketing, finance, and management. William holds various certifications in change management, quality, leadership, operational excellence, team building, and DiSC, among others.
Personal Brand Statement:
As an Army veteran dedicated to lifelong learning, I bring a disciplined, strategic mindset to my pursuits. I am constantly expanding my knowledge to innovate and lead effectively. My journey is driven by a commitment to excellence, and to make a meaningful impact in the world.
Affordable Stationery Printing Services in Jaipur | Navpack n PrintNavpack & Print
Looking for professional printing services in Jaipur? Navpack n Print offers high-quality and affordable stationery printing for all your business needs. Stand out with custom stationery designs and fast turnaround times. Contact us today for a quote!
1. For All TREB Member Inquiries:
(416) 443-8152
For All Media/Public Inquiries:
April 2012 (416) 443-8158
Economic Indicators Market Remains Tight with Sales Up in April TorontoMLS Sales Activity1,7
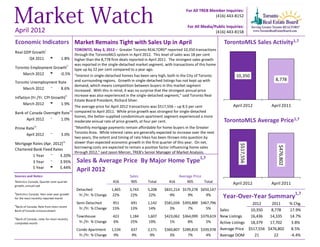
TORONTO, May 3, 2012 – Greater Toronto REALTORS® reported 10,350 transactions
Real GDP Growthi
through the TorontoMLS system in April 2012. This level of sales was 18 per cent
Q4 2011 t 1.8% higher than the 8,778 firm deals reported in April 2011. The strongest sales growth
was reported in the single-detached market segment, with transactions of this home
Toronto Employment Growthi i type up by 22 per cent compared to a year ago.
March 2012 u -0.5% “Interest in single-detached homes has been very high, both in the City of Toronto 10,350
and surrounding regions. Growth in single-detached listings has not kept up with 8,778
Toronto Unemployment Rate
demand, which means competition between buyers in this market segment
March 2012 q 8.6% increased. With this in mind, it was no surprise that the strongest annual price
increase was also experienced in the single-detached segment,” said Toronto Real
Inflation (Yr./Yr. CPI Growth)i i
Estate Board President, Richard Silver.
March 2012 u 1.9% April 2012 April 2011
The average price for April 2012 transactions was $517,556 – up 8.5 per cent
Bank of Canada Overnight Rate iii compared to April 2011. While price growth was strongest for single-detached
homes, the better-supplied condominium apartment segment experienced a more
April 2012 q 1.0% moderate annual rate of price growth, at four per cent. TorontoMLS Average Price1,7
iv “Monthly mortgage payments remain affordable for home buyers in the Greater
Prime Rate
Toronto Area. While interest rates are generally expected to increase over the next
April 2012 q 3.0%
two years, the extent and timing of rate hikes has been thrown into question by
Mortgage Rates (Apr. 2012)
iv slower than expected economic growth in the first quarter of this year. On net,
$517,556
$476,802
borrowing costs are expected to remain a positive factor influencing home sales
Chartered Bank Fixed Rates
through 2012,” said Jason Mercer, TREB’s Senior Manager of Market Analysis.
1 Year q 3.20%
3 Year q 3.95% Sales & Average Price By Major Home Type1,7
5 Year t 5.44%
April 2012
Sources and Notes: Sales Average Price
i
Statistics Canada, Quarter-over-quarter 416 905 Total 416 905 Total April 2012 April 2011
growth, annualized
Detached 1,465 3,743 5,208 $831,214 $579,278 $650,147
ii
Statistics Canada, Year-over-year growth 1,7
for the most recently reported month
Yr./Yr. % Change 22% 22% 22% 9% 9% 9% Year-Over-Year Summary
Semi-Detached 451 691 1,142 $581,034 $393,889 $467,796 2012 2011 % Chg.
iii
Bank of Canada, Rate from most recent
Yr./Yr. % Change 15% 13% 14% 3% 7% 5% Sales 10,350 8,778 17.9%
Bank of Canada announcement
iv
Townhouse 423 1,184 1,607 $423,062 $364,099 $379,619 New Listings 16,436 14,335 14.7%
Bank of Canada, rates for most recently
completed month Yr./Yr. % Change 6% 25% 19% 1% 8% 5% Active Listings 18,379 17,702 3.8%
Condo Apartment 1,534 637 2,171 $360,807 $289,819 $339,978 Average Price $517,556 $476,802 8.5%
Yr./Yr. % Change 9% 9% 9% 3% 7% 4% Average DOM 21 22 -4.4%
2. Toronto Real Estate Board
SALES BY PRICE RANGE AND HOUSE TYPE1,7 APRIL 2012
Price Range Detached Semi-Detached Att/Row/Twnhouse Condo Townhouse Condo Apt Link Co-op Apt Det Condo Co-ownership Apt Total
$0 to $99,999 2 0 0 1 22 0 1 0 0 26
$100,000 to $199,999 73 20 10 73 270 3 8 0 2 459
$200,000 to $299,999 318 82 138 269 728 48 2 6 8 1,599
$300,000 to $399,999 771 340 275 271 626 31 3 5 2 2,324
$400,000 to $499,999 949 358 236 93 291 34 3 0 1 1,965
$500,000 to $599,999 891 151 92 21 116 39 1 2 0 1,313
$600,000 to $699,999 677 85 49 19 50 17 0 1 0 898
$700,000 to $799,999 485 49 15 14 17 3 0 1 0 584
$800,000 to $899,999 289 25 14 7 16 0 0 0 0 351
$900,000 to $999,999 159 15 2 2 10 0 0 0 0 188
$1,000,000 to $1,249,999 239 11 2 2 11 0 1 0 0 266
$1,250,000 to $1,499,999 152 4 0 0 5 0 0 0 0 161
$1,500,000 to $1,749,999 71 1 0 0 7 0 0 0 0 79
$1,750,000 to $1,999,999 42 1 1 0 1 0 0 0 0 45
$2,000,000 + 90 0 1 0 1 0 0 0 0 92
Total Sales 5,208 1,142 835 772 2,171 175 19 15 13 10,350
Share of Total Sales 50.3% 11.0% 8.1% 7.5% 21.0% 1.7% 0.2% 0.1% 0.1% -
Average Price $650,147 $467,796 $422,939 $332,765 $339,978 $418,450 $304,389 $391,614 $268,131 $517,556
SALES BY PRICE RANGE AND HOUSE TYPE1,7 YEAR-TO-DATE, 2012
Price Range Detached Semi-Detached Att/Row/Twnhouse Condo Townhouse Condo Apt Link Co-op Apt Det Condo Co-ownership Apt Total
$0 to $99,999 11 1 2 6 104 0 2 0 3 129
$100,000 to $199,999 236 71 23 265 949 7 21 0 3 1,575
$200,000 to $299,999 1,134 259 452 797 2,351 131 12 7 18 5,161
$300,000 to $399,999 2,414 1,095 768 780 2,129 104 11 10 5 7,316
$400,000 to $499,999 2,873 1,099 672 254 909 131 5 2 4 5,949
$500,000 to $599,999 2,537 401 256 78 340 108 1 3 0 3,724
$600,000 to $699,999 1,882 202 122 41 158 38 0 3 0 2,446
$700,000 to $799,999 1,281 115 46 34 72 6 1 1 0 1,556
$800,000 to $899,999 821 65 29 16 44 0 0 0 0 975
$900,000 to $999,999 468 31 9 3 22 0 0 0 0 533
$1,000,000 to $1,249,999 611 32 6 4 41 2 1 1 0 698
$1,250,000 to $1,499,999 395 12 3 0 14 0 0 0 0 424
$1,500,000 to $1,749,999 204 8 5 0 16 0 0 0 0 233
$1,750,000 to $1,999,999 120 2 2 0 3 0 0 0 0 127
$2,000,000 + 252 1 1 0 9 0 0 0 0 263
Total Sales 15,239 3,394 2,396 2,278 7,161 527 54 27 33 31,109
Share of Total Sales 49.0% 10.9% 7.7% 7.3% 23.0% 1.7% 0.2% 0.1% 0.1% -
Average Price $632,521 $455,694 $418,364 $323,072 $336,259 $416,136 $268,741 $434,939 $265,388 $501,020
Page 3 July 2010
Market Watch, April 2012 2