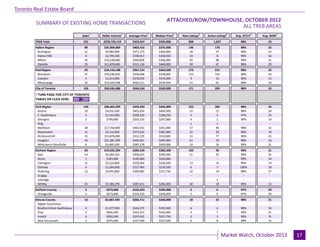
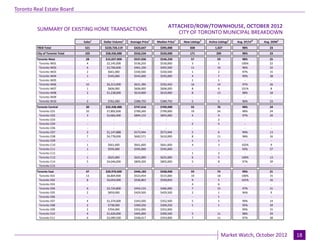
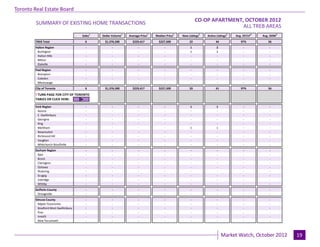
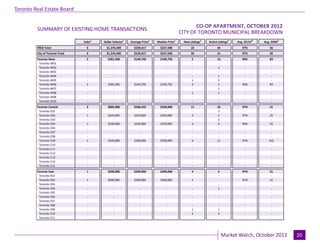
Download to read offline

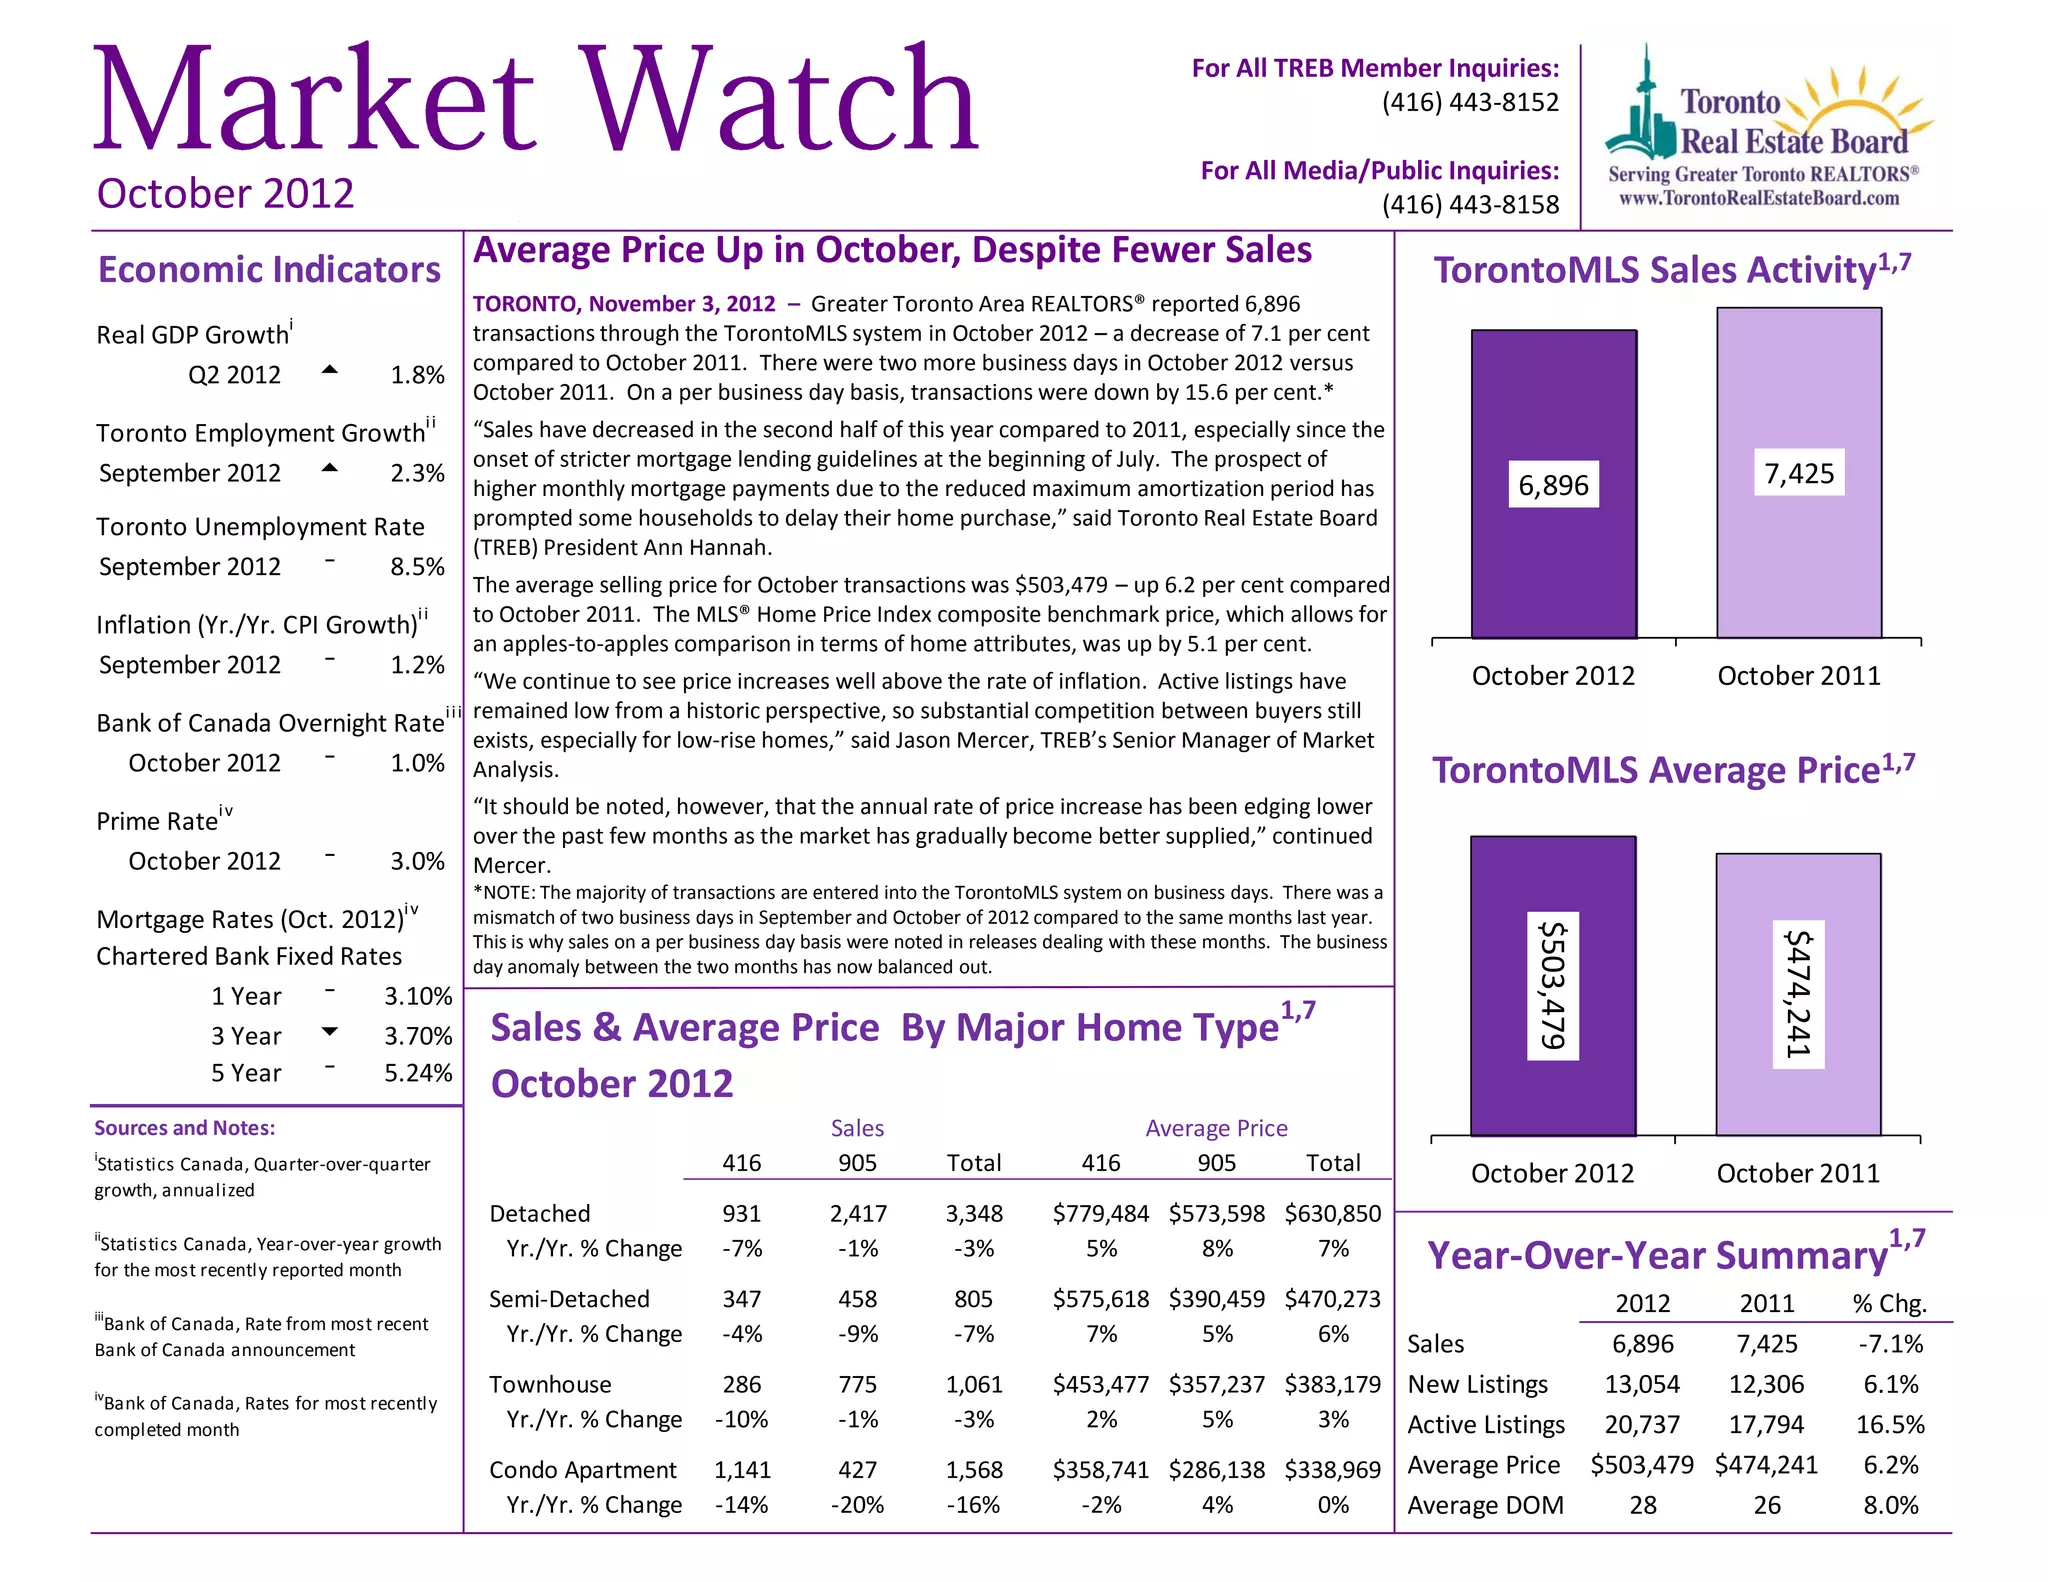
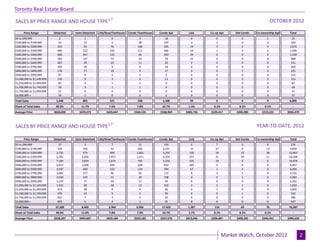
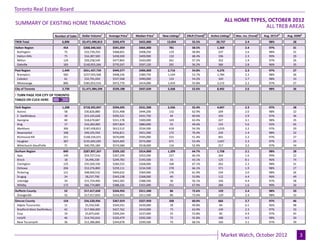
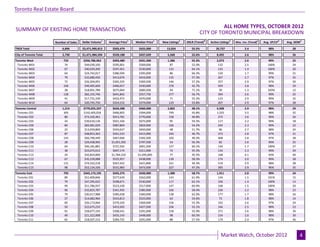
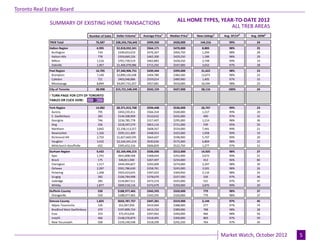
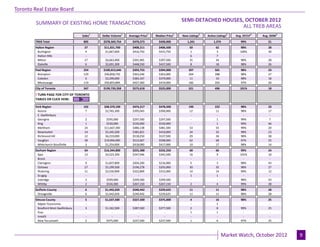
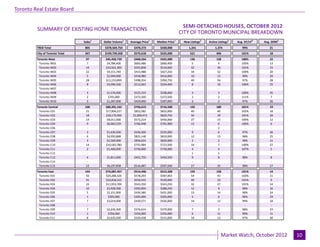
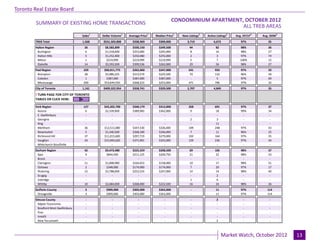
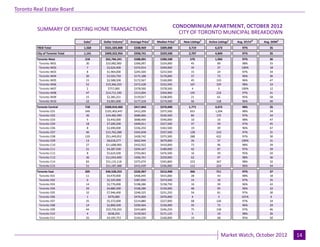

In October 2012, the Greater Toronto Area saw a 7.1% decrease in real estate transactions compared to the previous year, with a total of 6,896 sales reported. Despite fewer sales, the average selling price rose to $503,479, reflecting a 6.2% increase year-over-year, driven by low active listings and ongoing competition among buyers. The report highlights the impact of stricter mortgage lending guidelines on sales activity, prompting some potential buyers to delay purchases.


