TREB Market Watch May 2012
•
0 likes•256 views

The document summarizes real estate data for the Greater Toronto area in May 2012. It reports that home sales increased 11% compared to May 2011, with 10,850 transactions. Average home prices rose 6.5% to $516,787. While sales growth was strongest in areas surrounding Toronto, average price growth was driven by the low-rise market segment within the city. Strong competition between buyers for low-rise homes contributed to price increases, but annual price growth is expected to moderate as new listings rise substantially above year-ago levels.

More Related Content
What's hot
What's hot (10)
Viewers also liked
Similar to TREB Market Watch May 2012
Similar to TREB Market Watch May 2012 (17)
TREB Market Watch May 2012
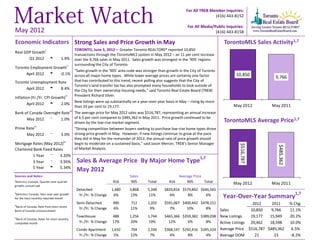
- 1. For All TREB Member Inquiries: (416) 443-8152 For All Media/Public Inquiries: May 2012 (416) 443-8158 Economic Indicators Strong Sales and Price Growth in May TorontoMLS Sales Activity1,7 TORONTO, June 5, 2012 – Greater Toronto REALTORS® reported 10,850 Real GDP Growthi transactions through the TorontoMLS system in May 2012 – an 11 per cent increase Q1 2012 t 1.9% over the 9,766 sales in May 2011. Sales growth was strongest in the ‘905’ regions surrounding the City of Toronto. Toronto Employment Growthi i “Sales growth in the ‘905’ area code was stronger than growth in the City of Toronto April 2012 u -0.1% across all major home types. While lower average prices are certainly one factor 10,850 9,766 Toronto Unemployment Rate that has contributed to this trend, recent polling also suggests that the City of Toronto’s land transfer tax has also prompted many households to look outside of April 2012 u 8.4% the City for their ownership housing needs,” said Toronto Real Estate Board (TREB) ii President Richard Silver. Inflation (Yr./Yr. CPI Growth) New listings were up substantially on a year-over-year basis in May – rising by more April 2012 t 2.0% May 2012 May 2011 than 20 per cent to 19,177. iii Bank of Canada Overnight Rate The average price for May 2012 sales was $516,787, representing an annual increase May 2012 q of 6.5 per cent compared to $485,362 in May 2011. Price growth continued to be 1.0% driven by the low-rise market segment. TorontoMLS Average Price1,7 iv Prime Rate “Strong competition between buyers seeking to purchase low-rise home types drove May 2012 q 3.0% strong price growth in May. However, if new listings continue to grow at the pace they did in May for the remainder of 2012, the annual rate of price growth should iv Mortgage Rates (May 2012) begin to moderate on a sustained basis,” said Jason Mercer, TREB’s Senior Manager $516,787 $485,362 Chartered Bank Fixed Rates of Market Analysis. 1 Year q 3.20% 1,7 3 Year q 3.95% Sales & Average Price By Major Home Type 5 Year u 5.34% May 2012 Sources and Notes: Sales Average Price i Statistics Canada, Quarter-over-quarter 416 905 Total 416 905 Total May 2012 May 2011 growth, annualized Detached 1,480 3,868 5,348 $820,816 $579,892 $646,565 ii Statistics Canada, Year-over-year growth 1,7 for the most recently reported month Yr./Yr. % Change 6% 13% 11% 6% 8% 6% Year-Over-Year Summary Semi-Detached 490 712 1,202 $591,067 $400,442 $478,151 2012 2011 % Chg. iii Bank of Canada, Rate from most recent Yr./Yr. % Change 6% 11% 9% 7% 10% 8% Sales 10,850 9,766 11.1% Bank of Canada announcement iv Townhouse 488 1,256 1,744 $465,366 $359,382 $389,038 New Listings 19,177 15,949 20.2% Bank of Canada, Rates for most recently completed month Yr./Yr. % Change 17% 20% 19% 12% 6% 8% Active Listings 20,462 18,598 10.0% Condo Apartment 1,632 704 2,336 $368,147 $292,416 $345,324 Average Price $516,787 $485,362 6.5% Yr./Yr. % Change 5% 12% 7% 4% 8% 4% Average DOM 21 23 -8.2%
- 2. Toronto Real Estate Board SALES BY PRICE RANGE AND HOUSE TYPE1,7 MAY 2012 Price Range Detached Semi-Detached Att/Row/Twnhouse Condo Townhouse Condo Apt Link Co-op Apt Det Condo Co-ownership Apt Total $0 to $99,999 6 0 0 1 18 0 1 0 0 26 $100,000 to $199,999 73 16 6 74 272 0 2 0 1 444 $200,000 to $299,999 346 65 132 290 731 55 3 0 1 1,623 $300,000 to $399,999 756 355 264 330 784 39 6 3 1 2,538 $400,000 to $499,999 981 419 232 118 291 42 1 3 0 2,087 $500,000 to $599,999 960 159 121 34 104 43 2 0 0 1,423 $600,000 to $699,999 688 79 58 18 54 12 1 1 0 911 $700,000 to $799,999 441 39 16 10 21 2 1 0 0 530 $800,000 to $899,999 338 28 12 4 20 0 0 0 0 402 $900,000 to $999,999 172 12 5 1 8 0 0 0 0 198 $1,000,000 to $1,249,999 225 10 8 4 16 0 0 0 0 263 $1,250,000 to $1,499,999 136 15 3 1 10 0 0 0 0 165 $1,500,000 to $1,749,999 90 1 0 1 1 0 0 0 0 93 $1,750,000 to $1,999,999 42 3 0 0 2 0 0 0 0 47 $2,000,000 + 94 1 0 1 4 0 0 0 0 100 Total Sales 5,348 1,202 857 887 2,336 193 17 7 3 10,850 Share of Total Sales 49.3% 11.1% 7.9% 8.2% 21.5% 1.8% 0.2% 0.1% 0.0% - Average Price $646,565 $478,151 $437,951 $341,780 $345,324 $411,176 $369,200 $434,907 $242,833 $516,787 SALES BY PRICE RANGE AND HOUSE TYPE1,7 YEAR-TO-DATE, 2012 Price Range Detached Semi-Detached Att/Row/Twnhouse Condo Townhouse Condo Apt Link Co-op Apt Det Condo Co-ownership Apt Total $0 to $99,999 17 1 2 7 121 0 3 0 3 154 $100,000 to $199,999 306 87 29 338 1,214 7 23 0 4 2,008 $200,000 to $299,999 1,468 322 582 1,084 3,068 186 15 7 19 6,751 $300,000 to $399,999 3,138 1,438 1,023 1,105 2,902 138 17 13 6 9,780 $400,000 to $499,999 3,828 1,504 892 370 1,195 173 6 5 4 7,977 $500,000 to $599,999 3,469 554 370 110 440 149 3 3 0 5,098 $600,000 to $699,999 2,545 280 180 59 211 50 1 4 0 3,330 $700,000 to $799,999 1,706 152 61 43 93 7 2 1 0 2,065 $800,000 to $899,999 1,157 93 41 19 62 0 0 0 0 1,372 $900,000 to $999,999 636 43 14 4 30 0 0 0 0 727 $1,000,000 to $1,249,999 828 41 14 8 56 2 1 1 0 951 $1,250,000 to $1,499,999 528 27 6 1 23 0 0 0 0 585 $1,500,000 to $1,749,999 287 9 5 1 17 0 0 0 0 319 $1,750,000 to $1,999,999 162 5 2 0 5 0 0 0 0 174 $2,000,000 + 343 2 1 1 13 0 0 0 0 360 Total Sales 20,418 4,558 3,222 3,150 9,450 712 71 34 36 41,651 Share of Total Sales 49.0% 10.9% 7.7% 7.6% 22.7% 1.7% 0.2% 0.1% 0.1% - Average Price $636,264 $461,636 $423,394 $327,823 $338,322 $414,443 $292,794 $434,933 $263,508 $504,897 Page 3 July 2010 Market Watch, May 2012 2
- 3. Toronto Real Estate Board ALL HOME TYPES, MAY 2012 SUMMARY OF EXISTING HOME TRANSACTIONS ALL TREB AREAS Number of Sales Dollar Volume1 Average Price1 Median Price1 New Listings2 SNLR (Trend) 8 Active Listings3 Mos. Inv. (Trend)9 Avg. SP/LP 4 Avg. DOM5 TREB Total 10,850 $5,607,133,659 $516,787 $432,050 19,177 60.0% 20,462 2.2 99% 21 Halton Region 730 $421,720,268 $577,699 $485,000 1,181 62.2% 1,332 2.2 98% 24 Burlington 89 $46,690,125 $524,608 $466,000 182 59.9% 230 2.5 97% 26 Halton Hills 118 $53,559,500 $453,894 $432,500 140 71.1% 166 2.3 99% 30 Milton 219 $101,609,616 $463,971 $427,900 378 63.9% 338 1.6 99% 17 Oakville 304 $219,861,027 $723,227 $620,000 481 58.4% 598 2.6 97% 26 Peel Region 2,357 $1,049,323,268 $445,194 $405,000 4,130 59.7% 4,110 2.0 98% 20 Brampton 999 $409,841,405 $410,252 $389,000 1,674 58.5% 1,592 1.9 98% 20 Caledon 94 $52,202,511 $555,346 $490,500 193 56.3% 298 3.5 97% 25 Mississauga 1,264 $587,279,352 $464,620 $416,000 2,263 60.8% 2,220 1.9 98% 20 City of Toronto 4,130 $2,349,011,252 $568,768 $446,000 7,956 58.0% 8,376 2.2 100% 20 ! TURN PAGE FOR CITY OF TORONTO TABLES OR CLICK HERE: York Region 2,028 $1,233,476,073 $608,223 $544,750 3,600 62.4% 3,647 1.9 99% 19 Aurora 119 $64,916,753 $545,519 $528,000 169 70.8% 163 1.7 100% 16 E. Gwillimbury 42 $21,503,800 $511,995 $429,650 73 64.2% 88 2.9 98% 26 Georgina 107 $36,499,556 $341,117 $310,000 142 65.9% 253 3.2 98% 31 King 35 $27,937,804 $798,223 $710,000 68 51.0% 134 5.8 97% 36 Markham 577 $364,322,954 $631,409 $565,000 1,011 60.9% 925 1.7 100% 18 Newmarket 189 $85,625,600 $453,046 $436,000 277 76.7% 214 1.2 99% 17 Richmond Hill 412 $281,606,666 $683,511 $615,000 798 61.3% 711 1.6 99% 18 Vaughan 458 $290,607,113 $634,513 $581,950 878 60.1% 915 2.0 99% 19 Whitchurch-Stouffville 89 $60,455,827 $679,279 $550,000 184 58.6% 244 2.9 97% 22 Durham Region 1,248 $427,158,073 $342,274 $315,000 1,876 62.2% 2,132 2.3 99% 24 Ajax 231 $87,737,838 $379,817 $359,900 329 64.8% 271 1.7 99% 19 Brock 26 $6,587,900 $253,381 $233,750 55 42.0% 152 8.4 95% 68 Clarington 217 $63,904,367 $294,490 $280,000 293 61.6% 374 2.5 99% 25 Oshawa 275 $73,200,950 $266,185 $255,000 439 63.2% 464 2.2 99% 21 Pickering 155 $61,532,723 $396,985 $365,000 267 61.0% 288 2.0 99% 22 Scugog 37 $12,834,233 $346,871 $317,000 70 51.6% 143 4.6 97% 38 Uxbridge 39 $19,430,988 $498,230 $440,000 72 53.6% 140 4.7 98% 38 Whitby 268 $101,929,074 $380,332 $350,200 351 66.1% 300 1.7 99% 21 Dufferin County 77 $28,023,390 $363,940 $323,000 74 68.2% 117 2.6 98% 32 Orangeville 77 $28,023,390 $363,940 $323,000 74 68.2% 117 2.6 98% 32 Simcoe County 280 $98,421,335 $351,505 $325,000 360 61.3% 748 3.9 98% 41 Adjala-Tosorontio 18 $8,065,500 $448,083 $427,500 32 48.3% 89 7.0 98% 84 Bradford West Gwillimbury 76 $32,531,200 $428,042 $398,750 82 74.4% 101 2.0 98% 23 Essa 49 $14,168,280 $289,149 $258,500 37 54.5% 145 5.1 98% 62 Innisfil 70 $22,477,829 $321,112 $298,000 126 52.1% 255 4.9 97% 42 New Tecumseth 67 $21,178,526 $316,097 $290,000 83 69.0% 158 3.3 97% 34 Page 3 July 2010 Market Watch, May 2012 3
- 4. Toronto Real Estate Board ALL HOME TYPES, MAY 2012 SUMMARY OF EXISTING HOME TRANSACTIONS CITY OF TORONTO MUNICIPAL BREAKDOWN 1 1 1 2 8 3 4 5 Number of Sales Dollar Volume Average Price Median Price New Listings SNLR (Trend) Active Listings Mos. Inv. (Trend)9 Avg. SP/LP Avg. DOM TREB Total 10,850 $5,607,133,659 $516,787 $432,050 19,177 60.0% 20,462 2.2 99% 21 City of Toronto Total 4,130 $2,349,011,252 $568,768 $446,000 7,956 58.0% 8,376 2.2 100% 20 Toronto West 1,087 $547,476,489 $503,658 $438,000 1,877 58.2% 2,180 2.5 101% 21 Toronto W01 86 $54,069,686 $628,717 $580,000 171 58.3% 156 2.1 104% 14 Toronto W02 137 $87,111,204 $635,848 $631,000 182 67.9% 120 1.2 103% 13 Toronto W03 81 $32,221,690 $397,799 $385,000 116 64.0% 111 1.9 102% 21 Toronto W04 108 $44,461,899 $411,684 $397,500 182 60.1% 205 2.6 99% 21 Toronto W05 135 $45,819,700 $339,405 $370,000 236 56.3% 314 3.1 99% 26 Toronto W06 138 $63,420,920 $459,572 $439,500 317 47.7% 440 3.3 99% 26 Toronto W07 49 $33,655,300 $686,843 $640,000 58 68.6% 43 1.4 103% 13 Toronto W08 205 $132,688,604 $647,261 $540,000 332 60.6% 415 2.3 99% 23 Toronto W09 53 $23,311,429 $439,838 $460,000 113 56.5% 146 2.8 101% 21 Toronto W10 95 $30,716,057 $323,327 $365,000 170 56.5% 230 2.9 98% 23 Toronto Central 1,863 $1,269,188,826 $681,261 $470,000 4,038 55.5% 4,385 2.3 100% 20 Toronto C01 469 $220,572,083 $470,303 $398,600 1,135 51.7% 1,383 2.7 100% 24 Toronto C02 104 $110,196,753 $1,059,584 $969,549 235 51.8% 278 3.1 101% 19 Toronto C03 75 $69,506,906 $926,759 $656,000 115 59.6% 115 2.1 100% 18 Toronto C04 124 $151,233,145 $1,219,622 $1,109,000 239 58.0% 245 2.0 99% 20 Toronto C06 34 $24,112,890 $709,203 $657,500 73 60.3% 74 2.1 102% 21 Toronto C07 137 $85,214,833 $622,006 $529,900 317 57.1% 319 2.0 99% 18 Toronto C08 187 $84,828,143 $453,626 $379,000 384 59.4% 417 2.1 100% 19 Toronto C09 47 $65,580,500 $1,395,330 $975,000 68 60.0% 71 2.4 101% 13 Toronto C10 93 $61,214,485 $658,220 $582,000 156 66.3% 129 1.4 101% 15 Toronto C11 50 $34,501,213 $690,024 $428,400 88 64.3% 92 1.8 102% 18 Toronto C12 43 $81,623,300 $1,898,216 $1,600,000 130 50.3% 180 3.5 97% 24 Toronto C13 99 $61,091,075 $617,082 $515,000 189 62.7% 160 1.8 102% 16 Toronto C14 210 $121,877,233 $580,368 $410,000 506 54.4% 523 2.0 99% 21 Toronto C15 191 $97,636,267 $511,185 $412,000 403 53.0% 399 2.2 101% 21 Toronto East 1,180 $532,345,937 $451,141 $432,050 2,041 62.2% 1,811 1.8 101% 17 Toronto E01 107 $65,039,140 $607,842 $565,000 173 62.7% 128 1.5 105% 11 Toronto E02 108 $69,924,450 $647,449 $579,950 182 65.2% 113 1.2 103% 9 Toronto E03 122 $67,393,034 $552,402 $530,000 237 63.4% 175 1.4 103% 14 Toronto E04 138 $49,807,207 $360,922 $392,500 224 63.5% 213 1.9 101% 20 Toronto E05 123 $51,314,718 $417,193 $370,000 215 70.0% 164 1.3 102% 18 Toronto E06 38 $19,858,474 $522,591 $491,500 97 59.7% 78 1.6 101% 20 Toronto E07 130 $48,884,876 $376,038 $332,000 216 58.6% 197 2.2 102% 21 Toronto E08 81 $34,063,730 $420,540 $419,000 128 58.3% 146 2.3 98% 20 Toronto E09 135 $46,447,958 $344,059 $354,000 245 58.5% 280 2.3 99% 21 Toronto E10 91 $41,252,700 $453,326 $436,000 131 64.0% 112 1.9 100% 19 Toronto E11 107 $38,359,650 $358,501 $349,000 193 60.9% 205 2.2 99% 18 Page 3 July 2010 Market Watch, May 2012 4
- 5. Toronto Real Estate Board ALL HOME TYPES, YEAR-TO-DATE 2012 SUMMARY OF EXISTING HOME TRANSACTIONS ALL TREB AREAS Number of Sales Dollar Volume1 Average Price1 Median Price1 New Listings2 Avg. SP/LP 4 Avg. DOM5 TREB Total 41,651 $21,029,481,527 $504,897 $423,000 74,037 99% 23 Halton Region 2,688 $1,527,045,840 $568,097 $473,000 4,563 98% 23 Burlington 337 $164,217,132 $487,291 $413,000 619 97% 28 Halton Hills 441 $205,128,850 $465,145 $430,000 617 98% 28 Milton 825 $380,249,625 $460,909 $425,550 1,365 99% 16 Oakville 1,085 $777,450,233 $716,544 $607,000 1,962 97% 25 Peel Region 8,970 $3,933,677,303 $438,537 $397,000 15,785 98% 21 Brampton 3,851 $1,552,671,733 $403,187 $382,500 6,699 98% 21 Caledon 365 $205,434,216 $562,833 $479,500 720 97% 30 Mississauga 4,754 $2,175,571,354 $457,630 $410,000 8,366 98% 21 City of Toronto 15,872 $8,793,343,051 $554,016 $431,950 29,820 101% 22 ! TURN PAGE FOR CITY OF TORONTO TABLES OR CLICK HERE: York Region 7,875 $4,678,172,841 $594,054 $539,000 13,719 99% 21 Aurora 446 $253,212,279 $567,741 $518,000 695 99% 19 E. Gwillimbury 150 $73,496,581 $489,977 $430,000 249 98% 29 Georgina 413 $130,747,900 $316,581 $295,000 682 98% 31 King 149 $123,439,254 $828,451 $714,000 267 95% 57 Markham 2,144 $1,286,263,188 $599,936 $550,000 3,747 100% 19 Newmarket 717 $322,343,743 $449,573 $427,000 1,015 100% 16 Richmond Hill 1,577 $1,061,871,079 $673,349 $608,500 2,862 100% 17 Vaughan 1,924 $1,211,550,253 $629,704 $580,000 3,521 99% 20 Whitchurch-Stouffville 355 $215,248,564 $606,334 $526,000 681 98% 30 Durham Region 4,968 $1,656,298,022 $333,393 $310,000 8,020 98% 27 Ajax 946 $349,291,112 $369,230 $355,000 1,437 99% 21 Brock 88 $23,740,990 $269,784 $236,250 217 96% 90 Clarington 832 $243,030,560 $292,104 $273,500 1,319 98% 29 Oshawa 1,189 $306,564,224 $257,834 $243,000 1,831 98% 27 Pickering 623 $244,231,368 $392,025 $367,500 1,093 99% 23 Scugog 131 $49,028,983 $374,267 $328,500 285 97% 42 Uxbridge 134 $62,975,538 $469,967 $430,500 287 97% 48 Whitby 1,025 $377,435,247 $368,230 $347,000 1,551 99% 21 Dufferin County 286 $96,902,690 $338,821 $316,750 410 98% 37 Orangeville 286 $96,902,690 $338,821 $316,750 410 98% 37 Simcoe County 992 $344,041,780 $346,816 $318,750 1,720 98% 45 Adjala-Tosorontio 65 $28,218,850 $434,136 $402,250 147 97% 82 Bradford West Gwillimbury 284 $116,855,358 $411,463 $378,588 379 98% 27 Essa 135 $40,813,176 $302,320 $260,000 280 98% 52 Innisfil 226 $69,779,648 $308,760 $294,000 496 97% 50 New Tecumseth 282 $88,374,748 $313,386 $286,600 418 98% 47 Page 3 July 2010 Market Watch, May 2012 5
- 6. Toronto Real Estate Board ALL HOME TYPES, YEAR-TO-DATE 2012 SUMMARY OF EXISTING HOME TRANSACTIONS CITY OF TORONTO MUNICIPAL BREAKDOWN 1 1 1 2 4 5 Number of Sales Dollar Volume Average Price Median Price New Listings Avg. SP/LP Avg. DOM TREB Total 41,651 $21,029,481,527 $504,897 $423,000 74,037 99% 23 City of Toronto Total 15,872 $8,793,343,051 $554,016 $431,950 29,820 101% 22 Toronto West 4,094 $1,961,993,962 $479,236 $418,000 7,500 100% 24 Toronto W01 269 $165,276,104 $614,409 $549,000 569 104% 16 Toronto W02 442 $275,106,910 $622,414 $585,000 666 104% 14 Toronto W03 356 $138,502,422 $389,052 $380,000 528 100% 22 Toronto W04 380 $139,428,375 $366,917 $354,500 677 99% 27 Toronto W05 494 $170,068,870 $344,269 $363,000 933 98% 30 Toronto W06 559 $251,750,067 $450,358 $422,000 1,310 100% 29 Toronto W07 152 $105,451,693 $693,761 $640,000 221 102% 18 Toronto W08 774 $483,382,157 $624,525 $525,200 1,389 99% 24 Toronto W09 252 $105,548,412 $418,843 $442,500 454 100% 27 Toronto W10 416 $127,478,952 $306,440 $331,000 753 99% 24 Toronto Central 7,242 $4,838,341,258 $668,095 $462,000 14,797 100% 22 Toronto C01 1,834 $840,182,704 $458,115 $393,000 4,232 100% 25 Toronto C02 336 $349,803,588 $1,041,082 $847,750 763 100% 24 Toronto C03 278 $273,442,031 $983,604 $650,750 470 100% 20 Toronto C04 491 $540,507,596 $1,100,830 $1,012,000 887 101% 18 Toronto C06 169 $107,755,419 $637,606 $638,000 293 102% 20 Toronto C07 566 $337,293,884 $595,926 $489,000 1,143 100% 20 Toronto C08 722 $315,100,223 $436,427 $387,500 1,393 100% 23 Toronto C09 152 $193,937,456 $1,275,904 $893,000 277 98% 23 Toronto C10 333 $230,102,087 $690,997 $610,000 548 102% 15 Toronto C11 216 $142,118,164 $657,954 $359,000 344 102% 20 Toronto C12 205 $361,421,464 $1,763,032 $1,572,000 459 98% 27 Toronto C13 388 $232,135,290 $598,287 $457,000 663 102% 20 Toronto C14 803 $501,941,303 $625,083 $443,000 1,763 101% 22 Toronto C15 749 $412,600,049 $550,868 $418,000 1,562 101% 24 Toronto East 4,536 $1,993,007,831 $439,376 $416,000 7,523 102% 20 Toronto E01 424 $247,611,576 $583,990 $555,278 655 105% 13 Toronto E02 379 $255,340,275 $673,721 $602,000 612 102% 12 Toronto E03 495 $266,225,395 $537,829 $515,000 812 104% 15 Toronto E04 530 $186,034,821 $351,009 $375,000 882 100% 23 Toronto E05 451 $185,432,003 $411,157 $367,000 709 102% 19 Toronto E06 192 $96,631,145 $503,287 $424,500 361 101% 15 Toronto E07 449 $164,211,968 $365,728 $318,000 719 101% 25 Toronto E08 294 $118,142,215 $401,844 $392,650 528 98% 24 Toronto E09 567 $183,816,977 $324,192 $315,000 986 99% 25 Toronto E10 315 $143,065,800 $454,177 $433,500 480 100% 20 Toronto E11 440 $146,495,656 $332,945 $320,150 779 99% 22 Page 3 July 2010 Market Watch, May 2012 6
- 7. Toronto Real Estate Board DETACHED HOUSES, MAY 2012 Industrial Leasing SUMMARY OF EXISTING HOME TRANSACTIONS ALL TREB AREAS Sales1 Dollar Volume1 Average Price1 Median Price1 New Listings2 Active Listings3 Avg. SP/LP 4 Avg. DOM5 TREB Total 5,348 - $3,457,829,694 - $646,565 - $548,000 - 9,534 - 10,058 - 99% - 21 - Halton Region 435 $305,167,820 $701,535 $593,000 756 973 97% 28 Burlington 50 $34,187,425 $683,749 $609,000 120 168 97% 33 Halton Hills 89 $44,112,400 $495,645 $468,500 113 146 98% 31 Milton 106 $59,166,679 $558,176 $529,700 217 236 98% 22 Oakville 190 - $167,701,316 - $882,639 - $744,050 - 306 - 423 - 97% - 28 - Peel Region 1,061 $612,868,334 $577,633 $528,000 2,043 2,087 98% 20 Brampton 546 $262,700,223 $481,136 $460,000 993 959 98% 19 Caledon 69 $42,864,200 $621,220 $545,000 167 283 96% 30 Mississauga 446 - $307,303,911 - $689,022 - $610,000 - 883 - 845 - 98% - 19 - City of Toronto 1,480 $1,214,807,734 $820,816 $650,000 2,672 2,206 101% 15 ! TURN PAGE FOR CITY OF TORONTO TABLES OR CLICK HERE: - - - - - - - - York Region 1,225 $889,390,806 $726,033 $668,000 2,288 2,414 99% 19 Aurora 76 $46,678,526 $614,191 $565,000 118 128 99% 17 E. Gwillimbury 36 $19,593,800 $544,272 $458,250 61 81 97% 29 Georgina 96 $33,617,756 $350,185 $326,000 129 245 98% 33 King 33 $27,167,054 $823,244 $714,000 66 125 97% 29 Markham 286 $233,922,257 $817,910 $755,900 553 465 101% 16 Newmarket 122 $62,124,300 $509,216 $501,000 182 148 99% 17 Richmond Hill 243 $209,948,348 $863,985 $765,000 494 449 98% 18 Vaughan 257 $201,078,165 $782,405 $703,000 530 552 99% 17 Whitchurch-Stouffville 76 - $55,260,600 - $727,113 - $587,500 - 155 - 221 - 97% - 22 - Durham Region 885 $333,825,349 $377,204 $351,000 1,420 1,647 99% 24 Ajax 155 $66,848,272 $431,279 $401,500 232 186 99% 16 Brock 23 $5,930,500 $257,848 $235,000 52 145 95% 46 Clarington 148 $47,644,887 $321,925 $302,000 221 288 99% 26 Oshawa 219 $62,070,500 $283,427 $274,000 335 333 99% 21 Pickering 88 $42,646,696 $484,622 $439,000 180 192 100% 24 Scugog 35 $12,310,233 $351,721 $320,000 70 143 97% 37 Uxbridge 35 $18,308,888 $523,111 $480,000 64 130 98% 39 Whitby 182 - $78,065,373 - $428,931 - $395,000 - 266 - 230 - 99% - 22 - Dufferin County 62 $24,350,900 $392,756 $354,500 60 84 98% 32 Orangeville 62 - $24,350,900 - $392,756 - $354,500 - 60 - 84 - 98% - 32 - Simcoe County 200 $77,418,751 $387,094 $364,250 295 647 97% 43 Adjala-Tosorontio 18 $8,065,500 $448,083 $427,500 32 88 98% 84 Bradford West Gwillimbury 55 $26,098,400 $474,516 $440,000 63 85 98% 24 Essa 27 $9,243,400 $342,348 $315,000 30 119 98% 65 Innisfil 61 $20,207,250 $331,266 $312,000 120 244 97% 43 New Tecumseth 39 $13,804,201 $353,954 $333,500 50 111 97% 37 Page 3 July 2010 Market Watch, May 2012 7
- 8. Toronto Real Estate Board DETACHED HOUSES, MAY 2012 Industrial Leasing SUMMARY OF EXISTING HOME TRANSACTIONS CITY OF TORONTO MUNICIPAL BREAKDOWN Sales1 Dollar Volume1 Average Price1 Median Price1 New Listings2 Active Listings3 Avg. SP/LP 4 Avg. DOM5 TREB Total 5,348 $3,457,829,694 $646,565 $548,000 9,534 10,058 99% 21 City of Toronto Total 1,480 $1,214,807,734 $820,816 $650,000 2,672 2,206 101% 15 Toronto West 464 $312,055,545 $672,534 $570,500 743 636 101% 16 Toronto W01 20 $19,797,887 $989,894 $906,000 36 25 106% 13 Toronto W02 59 $46,500,123 $788,138 $781,000 85 49 103% 12 Toronto W03 41 $17,257,000 $420,902 $410,000 56 61 103% 23 Toronto W04 62 $31,941,899 $515,192 $486,550 106 100 100% 16 Toronto W05 26 $13,616,921 $523,728 $530,800 49 47 101% 17 Toronto W06 41 $23,120,447 $563,913 $507,000 86 70 101% 14 Toronto W07 35 $25,597,400 $731,354 $672,000 47 35 104% 12 Toronto W08 105 $97,026,682 $924,064 $770,000 158 150 99% 19 Toronto W09 27 $16,543,629 $612,727 $605,300 47 41 102% 18 Toronto W10 48 $20,653,557 $430,282 $423,750 73 58 99% 16 Toronto Central 493 $616,233,947 $1,249,967 $1,050,000 975 895 100% 15 Toronto C01 11 $11,817,000 $1,074,273 $812,000 17 11 108% 8 Toronto C02 23 $35,437,800 $1,540,774 $1,500,000 48 43 101% 20 Toronto C03 50 $54,937,406 $1,098,748 $858,250 78 78 100% 18 Toronto C04 100 $136,645,707 $1,366,457 $1,192,500 185 170 99% 19 Toronto C06 25 $20,705,000 $828,200 $731,000 44 34 102% 14 Toronto C07 55 $52,783,865 $959,707 $818,000 135 114 100% 13 Toronto C08 3 $3,600,000 $1,200,000 $1,150,000 5 5 99% 14 Toronto C09 20 $44,918,000 $2,245,900 $2,135,000 32 38 101% 11 Toronto C10 20 $21,576,000 $1,078,800 $965,000 31 21 101% 10 Toronto C11 20 $25,972,500 $1,298,625 $1,144,500 35 29 102% 7 Toronto C12 30 $71,539,900 $2,384,663 $2,097,500 87 126 98% 25 Toronto C13 40 $39,154,175 $978,854 $885,000 77 47 103% 10 Toronto C14 50 $56,971,020 $1,139,420 $1,005,000 120 120 99% 18 Toronto C15 46 $40,175,574 $873,382 $805,750 81 59 102% 13 Toronto East 523 $286,518,242 $547,836 $495,000 954 675 101% 14 Toronto E01 16 $12,068,999 $754,312 $605,750 44 36 102% 12 Toronto E02 32 $25,476,738 $796,148 $742,500 62 45 102% 11 Toronto E03 76 $45,395,560 $597,310 $547,500 155 107 103% 13 Toronto E04 66 $29,167,607 $441,933 $436,250 110 73 103% 10 Toronto E05 36 $22,688,200 $630,228 $628,200 76 47 104% 11 Toronto E06 31 $17,402,474 $561,370 $539,900 86 69 101% 15 Toronto E07 37 $21,805,576 $589,340 $550,000 84 50 103% 10 Toronto E08 48 $27,106,030 $564,709 $501,000 70 53 99% 16 Toronto E09 69 $29,739,858 $431,012 $429,000 102 69 100% 14 Toronto E10 67 $34,204,600 $510,516 $470,000 92 73 100% 19 Toronto E11 45 $21,462,600 $476,947 $482,000 73 53 100% 17 Page 3 July 2010 Market Watch, May 2012 8
- 9. Toronto Real Estate Board SEMI-DETACHED HOUSES, MAY 2012 Industrial Leasing SUMMARY OF EXISTING HOME TRANSACTIONS ALL TREB AREAS Sales1 Dollar Volume1 Average Price1 Median Price1 New Listings2 Active Listings3 Avg. SP/LP 4 Avg. DOM5 TREB Total 1,202 - $574,737,401 - $478,151 - $432,000 - 1,789 - 1,188 - 102% - 14 - Halton Region 66 $27,188,150 $411,942 $406,750 72 52 99% 16 Burlington 2 $800,000 $400,000 $400,000 5 8 99% 13 Halton Hills 8 $2,732,500 $341,563 $358,500 2 1 100% 17 Milton 40 $16,264,350 $406,609 $405,000 51 33 99% 13 Oakville 16 - $7,391,300 - $461,956 - $448,000 - 14 - 10 - 99% - 20 - Peel Region 419 $167,531,781 $399,837 $399,000 633 447 99% 14 Brampton 206 $76,016,726 $369,013 $365,000 331 259 99% 15 Caledon 15 $5,775,500 $385,033 $375,000 16 6 99% 10 Mississauga 198 - $85,739,555 - $433,028 - $437,250 - 286 - 182 - 100% - 14 - City of Toronto 490 $289,622,952 $591,067 $527,000 756 455 103% 12 ! TURN PAGE FOR CITY OF TORONTO TABLES OR CLICK HERE: - - - - - - - - York Region 145 $68,643,168 $473,401 $476,000 230 146 101% 15 Aurora 9 $3,715,477 $412,831 $411,000 12 4 102% 10 E. Gwillimbury - - - - 2 2 - - Georgina 2 $567,900 $283,950 $283,950 2 2 99% 33 King - - - - - - - - Markham 36 $18,437,365 $512,149 $501,894 56 35 102% 13 Newmarket 30 $11,268,100 $375,603 $381,250 36 20 100% 17 Richmond Hill 18 $9,759,799 $542,211 $551,500 34 23 103% 17 Vaughan 44 $22,353,200 $508,027 $499,900 75 50 100% 15 Whitchurch-Stouffville 6- $2,541,327 - $423,555 - $416,750 - 13 - 10 - 101% - 14 - Durham Region 66 $17,552,650 $265,949 $254,250 85 74 100% 14 Ajax 15 $4,931,200 $328,747 $332,000 18 13 101% 13 Brock - - - - - 1 - - Clarington 9 $1,939,900 $215,544 $221,000 4 4 98% 18 Oshawa 22 $4,368,150 $198,552 $199,000 43 40 99% 15 Pickering 14 $4,599,400 $328,529 $335,000 15 11 99% 9 Scugog 1 $250,000 $250,000 $250,000 - - 96% 13 Uxbridge - - - - 1 1 - - Whitby 5- $1,464,000 - $292,800 - $302,500 - 4- 4- 98% - 22 - Dufferin County 4 $1,117,500 $279,375 $255,000 5 5 99% 15 Orangeville 4 - $1,117,500 - $279,375 - $255,000 - 5 - 5 - 99% - 15 - Simcoe County 12 $3,081,200 $256,767 $261,450 8 9 98% 36 Adjala-Tosorontio - - - - - 1 - - Bradford West Gwillimbury 7 $2,096,700 $299,529 $284,000 5 4 99% 18 Essa 3 $512,000 $170,667 $147,000 - 1 98% 85 Innisfil - - - - - - - - New Tecumseth 2 $472,500 $236,250 $236,250 3 3 97% 23 Page 3 July 2010 Market Watch, May 2012 9
- 10. Toronto Real Estate Board SEMI-DETACHED HOUSES, MAY 2012 Industrial Leasing SUMMARY OF EXISTING HOME TRANSACTIONS CITY OF TORONTO MUNICIPAL BREAKDOWN Sales1 Dollar Volume1 Average Price1 Median Price1 New Listings2 Active Listings3 Avg. SP/LP 4 Avg. DOM5 TREB Total 1,202 $574,737,401 $478,151 $432,000 1,789 1,188 102% 14 City of Toronto Total 490 $289,622,952 $591,067 $527,000 756 455 103% 12 Toronto West 153 $77,146,660 $504,227 $445,000 223 160 103% 15 Toronto W01 17 $12,798,200 $752,835 $757,500 24 10 107% 9 Toronto W02 43 $25,982,381 $604,241 $615,000 44 21 106% 11 Toronto W03 24 $9,837,300 $409,888 $397,950 36 28 101% 18 Toronto W04 6 $2,411,000 $401,833 $420,000 12 11 96% 22 Toronto W05 47 $18,834,079 $400,725 $386,000 79 73 98% 19 Toronto W06 6 $3,052,000 $508,667 $497,500 16 10 101% 19 Toronto W07 - - - - - - - - Toronto W08 3 $1,461,000 $487,000 $491,000 3 1 108% 11 Toronto W09 4 $1,658,700 $414,675 $415,000 4 2 99% 11 Toronto W10 3 $1,112,000 $370,667 $372,000 5 4 99% 20 Toronto Central 134 $102,702,935 $766,440 $686,650 232 147 103% 11 Toronto C01 19 $12,989,500 $683,658 $686,500 34 20 106% 12 Toronto C02 28 $29,485,200 $1,053,043 $1,044,500 46 38 102% 8 Toronto C03 18 $9,887,000 $549,278 $470,500 17 9 103% 16 Toronto C04 4 $3,155,238 $788,810 $790,000 8 5 103% 8 Toronto C06 - - - - 1 1 - - Toronto C07 2 $1,104,900 $552,450 $552,450 6 10 99% 21 Toronto C08 9 $9,714,025 $1,079,336 $1,210,000 13 6 105% 15 Toronto C09 5 $6,942,000 $1,388,400 $1,125,000 9 6 98% 13 Toronto C10 15 $11,744,485 $782,966 $767,500 26 14 105% 8 Toronto C11 2 $1,540,500 $770,250 $770,250 7 3 107% 7 Toronto C12 - - - - 2 2 - - Toronto C13 11 $5,317,700 $483,427 $450,000 16 9 106% 10 Toronto C14 - - - - 1 1 - - Toronto C15 21 $10,822,387 $515,352 $525,000 46 23 102% 9 Toronto East 203 $109,773,357 $540,755 $512,000 301 148 104% 10 Toronto E01 67 $40,927,991 $610,866 $598,000 82 36 105% 11 Toronto E02 53 $32,168,552 $606,954 $551,000 80 30 104% 9 Toronto E03 30 $15,024,814 $500,827 $515,950 49 24 105% 8 Toronto E04 13 $5,363,500 $412,577 $393,000 23 12 101% 11 Toronto E05 9 $4,129,300 $458,811 $468,300 18 9 100% 15 Toronto E06 3 $1,107,000 $369,000 $388,000 5 3 101% 10 Toronto E07 8 $3,550,800 $443,850 $452,000 12 7 105% 10 Toronto E08 1 $345,000 $345,000 $345,000 2 2 96% 15 Toronto E09 3 $1,032,500 $344,167 $355,000 2 2 100% 10 Toronto E10 5 $2,115,400 $423,080 $422,000 11 7 99% 11 Toronto E11 11 $4,008,500 $364,409 $349,000 17 16 99% 12 Page 3 July 2010 Market Watch, May 2012 10
- 11. Toronto Real Estate Board CONDOMINIUM TOWNHOUSES, MAY 2012 Industrial Leasing SUMMARY OF EXISTING HOME TRANSACTIONS ALL TREB AREAS Sales1 Dollar Volume1 Average Price1 Median Price1 New Listings2 Active Listings3 Avg. SP/LP 4 Avg. DOM5 TREB Total 887 - $303,158,542 - $341,780 - $327,000 - 1,283 - 1,261 - 99% - 21 - Halton Region 45 $14,400,849 $320,019 $298,000 63 53 99% 18 Burlington 13 $3,498,800 $269,138 $269,000 16 16 98% 17 Halton Hills 7 $1,786,800 $255,257 $243,000 7 5 100% 19 Milton 5 $1,443,999 $288,800 $274,000 8 3 100% 14 Oakville 20 - $7,671,250 - $383,563 - $341,500 - 32 - 29 - 98% - 19 - Peel Region 341 $107,990,623 $316,688 $318,000 453 403 99% 20 Brampton 75 $19,467,487 $259,566 $242,000 100 97 98% 24 Caledon 1 $293,500 $293,500 $293,500 1 2 98% 13 Mississauga 265 - $88,229,636 - $332,942 - $337,000 - 352 - 304 - 99% - 19 - City of Toronto 309 $120,939,108 $391,389 $351,652 501 502 100% 19 ! TURN PAGE FOR CITY OF TORONTO TABLES OR CLICK HERE: - - - - - - - - York Region 97 $38,220,292 $394,024 $375,000 140 145 99% 24 Aurora 6 $3,316,000 $552,667 $517,500 8 14 99% 25 E. Gwillimbury - - - - - - - - Georgina - - - - 3 3 - - King - - - - - - - - Markham 47 $18,459,944 $392,765 $350,000 60 64 100% 24 Newmarket 14 $4,378,500 $312,750 $304,500 13 13 99% 23 Richmond Hill 19 $7,458,800 $392,568 $401,000 30 27 98% 21 Vaughan 10 $4,361,548 $436,155 $402,000 24 23 100% 25 Whitchurch-Stouffville 1- $245,500 - $245,500 - $245,500 - 2- 1- 100% - 14 - Durham Region 86 $19,673,880 $228,766 $223,000 119 150 99% 29 Ajax 18 $4,410,780 $245,043 $243,000 26 24 99% 32 Brock 2 $367,500 $183,750 $183,750 3 5 97% 34 Clarington 5 $1,414,000 $282,800 $222,000 3 12 98% 49 Oshawa 18 $2,913,300 $161,850 $157,250 33 54 98% 27 Pickering 23 $5,715,800 $248,513 $250,000 34 34 99% 27 Scugog - - - - - - - - Uxbridge 3 $937,100 $312,367 $287,100 6 5 100% 16 Whitby 17 - $3,915,400 - $230,318 - $227,000 - 14 - 16 - 98% - 25 - Dufferin County 5 $1,062,990 $212,598 $233,500 4 4 99% 51 Orangeville 5 - $1,062,990 - $212,598 - $233,500 - 4 - 4 - 99% - 51 - Simcoe County 4 $870,800 $217,700 $217,500 3 4 99% 28 Adjala-Tosorontio - - - - - - - - Bradford West Gwillimbury 2 $484,900 $242,450 $242,450 - - 100% 39 Essa - - - - - - - - Innisfil - - - - - - - - New Tecumseth 2 $385,900 $192,950 $192,950 3 4 97% 16 Page 3 July 2010 Market Watch, May 2012 11
- 12. Toronto Real Estate Board CONDOMINIUM TOWNHOUSES, MAY 2012 Industrial Leasing SUMMARY OF EXISTING HOME TRANSACTIONS CITY OF TORONTO MUNICIPAL BREAKDOWN Sales1 Dollar Volume1 Average Price1 Median Price1 New Listings2 Active Listings3 Avg. SP/LP 4 Avg. DOM5 TREB Total 887 $303,158,542 $341,780 $327,000 1,283 1,261 99% 21 City of Toronto Total 309 $120,939,108 $391,389 $351,652 501 502 100% 19 Toronto West 80 $27,901,290 $348,766 $340,500 126 148 99% 20 Toronto W01 17 $7,243,500 $426,088 $405,000 25 13 102% 8 Toronto W02 7 $2,766,200 $395,171 $410,000 7 5 101% 11 Toronto W03 3 $1,043,990 $347,997 $319,000 4 4 101% 37 Toronto W04 4 $1,141,500 $285,375 $284,250 11 15 99% 23 Toronto W05 20 $5,024,400 $251,220 $246,500 31 52 97% 22 Toronto W06 6 $2,622,400 $437,067 $425,750 10 10 102% 14 Toronto W07 1 $650,000 $650,000 $650,000 2 2 94% 6 Toronto W08 10 $4,506,500 $450,650 $403,450 12 14 97% 22 Toronto W09 2 $892,000 $446,000 $446,000 10 12 98% 37 Toronto W10 10 $2,010,800 $201,080 $223,000 14 21 97% 38 Toronto Central 118 $58,849,498 $498,725 $411,000 222 191 100% 18 Toronto C01 31 $14,739,398 $475,464 $413,000 57 46 99% 19 Toronto C02 5 $4,764,000 $952,800 $639,000 13 12 97% 26 Toronto C03 - - - - 2 3 - - Toronto C04 1 $1,060,000 $1,060,000 $1,060,000 2 2 96% 139 Toronto C06 - - - - 2 2 - - Toronto C07 13 $5,610,900 $431,608 $387,000 18 14 99% 18 Toronto C08 5 $1,999,000 $399,800 $363,000 12 18 98% 17 Toronto C09 - - - - 1 1 - - Toronto C10 5 $3,112,700 $622,540 $603,700 6 3 101% 11 Toronto C11 4 $1,476,900 $369,225 $420,500 3 2 100% 25 Toronto C12 6 $5,517,400 $919,567 $800,250 21 15 98% 13 Toronto C13 3 $1,002,100 $334,033 $322,000 4 4 103% 8 Toronto C14 15 $7,737,500 $515,833 $480,000 28 28 100% 11 Toronto C15 30 $11,829,600 $394,320 $384,400 53 41 101% 16 Toronto East 111 $34,188,320 $308,003 $315,000 153 163 100% 21 Toronto E01 2 $650,000 $325,000 $325,000 3 4 100% 9 Toronto E02 7 $3,404,152 $486,307 $465,000 7 9 100% 11 Toronto E03 - - - - 1 2 - - Toronto E04 15 $5,122,100 $341,473 $348,000 18 30 99% 29 Toronto E05 29 $9,450,768 $325,889 $333,800 37 25 101% 20 Toronto E06 1 $390,000 $390,000 $390,000 1 - 99% 11 Toronto E07 15 $5,106,200 $340,413 $330,000 20 12 104% 12 Toronto E08 9 $2,432,700 $270,300 $275,000 16 22 98% 23 Toronto E09 13 $2,717,300 $209,023 $220,900 13 14 98% 32 Toronto E10 8 $1,805,700 $225,713 $210,900 12 14 99% 19 Toronto E11 12 $3,109,400 $259,117 $248,450 25 31 98% 22 Page 3 July 2010 Market Watch, May 2012 12