TREB Market Watch Report November 2012
•
0 likes•288 views

Greater Toronto Area REALTORS® reported 5,793 sales in November 2012 – down by 16 per cent compared to November 2011. “Transactions have been down on a year-over-year basis since June, after being up substantially in the last half of 2011 and the first half of 2012. Some buyers pulled

Recommended
More Related Content
What's hot
What's hot (11)
Similar to TREB Market Watch Report November 2012
Similar to TREB Market Watch Report November 2012 (20)
Recently uploaded
Recently uploaded (9)
TREB Market Watch Report November 2012
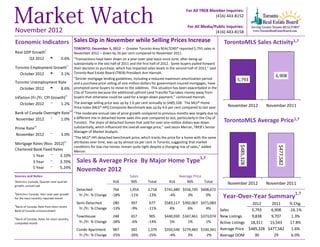
- 1. For All TREB Member Inquiries: (416) 443-8152 For All Media/Public Inquiries: November 2012 (416) 443-8158 Economic Indicators Sales Dip in November while Selling Prices Increase TorontoMLS Sales Activity1,7 TORONTO, December 5, 2012 – Greater Toronto Area REALTORS® reported 5,793 sales in Real GDP Growthi November 2012 – down by 16 per cent compared to November 2011. Q3 2012 t 0.6% “Transactions have been down on a year-over-year basis since June, after being up substantially in the last half of 2011 and the first half of 2012. Some buyers pulled forward Toronto Employment Growthi i their decision to purchase, which has impacted sales levels in the second half of 2012,” said October 2012 t 3.1% Toronto Real Estate Board (TREB) President Ann Hannah. 6,908 “Stricter mortgage lending guidelines, including a reduced maximum amortization period 5,793 Toronto Unemployment Rate and a purchase price ceiling of one-million dollars for government insured mortgages, have October 2012 t 8.6% prompted some buyers to move to the sidelines. This situation has been exacerbated in the City of Toronto because the additional upfront Land Transfer Tax takes money away from ii Inflation (Yr./Yr. CPI Growth) buyers that otherwise could be used for a larger down payment,” continued Hannah. October 2012 q 1.2% The average selling price was up by 1.6 per cent annually to $485,328. The MLS® Home November 2012 November 2011 Price Index (MLS® HPI) Composite Benchmark was up by 4.6 per cent compared to last year. iii Bank of Canada Overnight Rate “The moderate annual rate of price growth compared to previous months was largely due to November 2012 q 1.0% a different mix in detached home sales this year compared to last, particularly in the City of TorontoMLS Average Price1,7 Toronto. The share of detached homes that sold for over one-million dollars was down iv substantially, which influenced the overall average price,” said Jason Mercer, TREB’s Senior Prime Rate Manager of Market Analysis. November 2012 q 3.0% “The MLS® HPI detached benchmark price, which tracks the price for a home with the same Mortgage Rates (Nov. 2012) iv attributes over time, was up by almost six per cent in Toronto, suggesting that market $485,328 $477,582 conditions for low-rise homes remain quite tight despite a changing mix of sales,” added Chartered Bank Fixed Rates Mercer. 1 Year q 3.10% 1,7 3 Year q 3.70% Sales & Average Price By Major Home Type 5 Year q 5.24% November 2012 Sources and Notes: Sales Average Price i Statistics Canada, Quarter-over-quarter 416 905 Total 416 905 Total November 2012 November 2011 growth, annualized Detached 764 1,954 2,718 $741,480 $556,745 $608,672 ii Statistics Canada, Year-over-year growth 1,7 for the most recently reported month Yr./Yr. % Change -18% -11% -13% -4% 3% 0% Year-Over-Year Summary Semi-Detached 280 397 677 $583,117 $392,067 $471,083 2012 2011 % Chg. iii Bank of Canada, Rate from most recent Yr./Yr. % Change -13% -9% -11% 4% 6% 4% Sales 5,793 6,908 -16.1% Bank of Canada announcement iv Townhouse 248 657 905 $440,930 $347,461 $373,074 New Listings 9,838 9,707 1.3% Bank of Canada, Rates for most recently completed month Yr./Yr. % Change -28% -6% -14% 5% 1% 1% Active Listings 18,311 15,543 17.8% Condo Apartment 987 392 1,379 $350,540 $279,483 $330,341 Average Price $485,328 $477,582 1.6% Yr./Yr. % Change -25% -26% -25% -4% 3% -2% Average DOM 30 29 6.0%
- 2. Toronto Real Estate Board SALES BY PRICE RANGE AND HOUSE TYPE1,7 NOVEMBER 2012 Price Range Detached Semi-Detached Att/Row/Twnhouse Condo Townhouse Condo Apt Link Co-op Apt Det Condo Co-ownership Apt Total $0 to $99,999 2 0 1 3 17 0 2 0 0 25 $100,000 to $199,999 46 8 6 41 193 1 5 0 0 300 $200,000 to $299,999 220 60 79 144 483 16 1 2 3 1,008 $300,000 to $399,999 447 196 190 154 406 21 0 4 1 1,419 $400,000 to $499,999 547 207 116 39 146 29 1 0 1 1,086 $500,000 to $599,999 469 106 57 18 63 17 5 2 0 737 $600,000 to $699,999 305 44 23 12 30 3 0 0 0 417 $700,000 to $799,999 223 24 9 3 11 0 0 0 0 270 $800,000 to $899,999 135 12 3 1 6 0 0 0 0 157 $900,000 to $999,999 91 6 0 0 5 0 0 0 0 102 $1,000,000 to $1,249,999 95 5 2 1 9 0 0 0 0 112 $1,250,000 to $1,499,999 53 4 1 0 3 0 0 0 0 61 $1,500,000 to $1,749,999 29 1 1 1 3 0 0 0 0 35 $1,750,000 to $1,999,999 20 2 0 0 4 0 0 0 0 26 $2,000,000 + 36 2 0 0 0 0 0 0 0 38 Total Sales 2,718 677 488 417 1,379 87 14 8 5 5,793 Share of Total Sales 46.9% 11.7% 8.4% 7.2% 23.8% 1.5% 0.2% 0.1% 0.1% - Average Price $608,672 $471,083 $410,324 $329,482 $330,341 $416,813 $306,536 $372,063 $301,590 $485,328 SALES BY PRICE RANGE AND HOUSE TYPE1,7 YEAR-TO-DATE, 2012 Price Range Detached Semi-Detached Att/Row/Twnhouse Condo Townhouse Condo Apt Link Co-op Apt Det Condo Co-ownership Apt Total $0 to $99,999 39 3 8 24 209 0 9 0 8 300 $100,000 to $199,999 589 157 58 686 2,431 13 42 0 13 3,989 $200,000 to $299,999 2,942 631 1,078 2,143 6,226 336 24 21 41 13,442 $300,000 to $399,999 6,212 2,846 2,141 2,360 5,722 278 21 33 12 19,625 $400,000 to $499,999 7,715 3,036 1,787 741 2,305 364 11 9 7 15,975 $500,000 to $599,999 6,870 1,153 750 227 871 302 9 6 0 10,188 $600,000 to $699,999 4,889 531 354 131 420 70 1 4 0 6,400 $700,000 to $799,999 3,297 301 105 86 183 9 3 1 0 3,985 $800,000 to $899,999 2,145 164 75 31 114 0 0 1 0 2,530 $900,000 to $999,999 1,206 83 29 11 59 0 0 0 0 1,388 $1,000,000 to $1,249,999 1,523 73 30 16 110 2 2 1 0 1,757 $1,250,000 to $1,499,999 961 42 10 4 43 0 1 0 0 1,061 $1,500,000 to $1,749,999 507 23 10 3 33 0 0 1 0 577 $1,750,000 to $1,999,999 285 9 2 0 14 0 0 0 0 310 $2,000,000 + 637 8 2 1 25 0 0 0 0 673 Total Sales 39,817 9,060 6,439 6,464 18,765 1,374 123 77 81 82,200 Share of Total Sales 48.4% 11.0% 7.8% 7.9% 22.8% 1.7% 0.1% 0.1% 0.1% - Average Price $626,760 $460,486 $422,102 $329,261 $337,073 $413,846 $296,562 $405,373 $247,978 $498,243 Page 3 July 2010 Market Watch, November 2012 2
- 3. Toronto Real Estate Board ALL HOME TYPES, NOVEMBER 2012 SUMMARY OF EXISTING HOME TRANSACTIONS ALL TREB AREAS Number of Sales Dollar Volume1 Average Price1 Median Price1 New Listings2 SNLR (Trend) 8 Active Listings3 Mos. Inv. (Trend)9 Avg. SP/LP 4 Avg. DOM5 TREB Total 5,793 $2,811,505,718 $485,328 $410,000 9,838 54.4% 18,311 2.5 97% 30 Halton Region 399 $222,823,528 $558,455 $469,000 652 57.2% 1,253 2.5 97% 29 Burlington 73 $35,980,100 $492,878 $479,900 100 57.6% 217 2.7 98% 31 Halton Hills 67 $30,316,300 $452,482 $430,000 85 66.9% 175 2.3 98% 28 Milton 124 $57,571,110 $464,283 $413,000 188 56.5% 297 1.9 98% 25 Oakville 135 $98,956,018 $733,008 $555,000 279 54.4% 564 2.9 95% 31 Peel Region 1,147 $494,638,603 $431,246 $385,000 2,163 53.8% 3,821 2.3 97% 29 Brampton 483 $192,956,379 $399,496 $376,000 959 53.0% 1,574 2.2 97% 29 Caledon 51 $27,276,190 $534,827 $525,000 91 53.4% 286 3.8 97% 38 Mississauga 613 $274,406,034 $447,644 $387,000 1,113 54.5% 1,961 2.3 97% 28 City of Toronto 2,308 $1,195,235,446 $517,866 $425,000 4,056 51.4% 7,456 2.7 98% 29 ! TURN PAGE FOR CITY OF TORONTO TABLES OR CLICK HERE: York Region 1,002 $575,729,274 $574,580 $515,000 1,773 53.9% 3,579 2.4 97% 32 Aurora 51 $27,210,500 $533,539 $438,000 72 61.6% 173 2.1 97% 32 E. Gwillimbury 16 $7,069,250 $441,828 $398,125 38 57.0% 107 3.2 97% 38 Georgina 69 $21,129,015 $306,218 $295,000 62 64.0% 181 3.1 97% 47 King 11 $9,492,000 $862,909 $833,000 35 47.3% 157 5.9 93% 52 Markham 263 $149,984,522 $570,283 $530,000 448 53.2% 867 2.3 97% 31 Newmarket 100 $43,946,988 $439,470 $395,750 117 69.5% 188 1.4 97% 32 Richmond Hill 182 $121,905,809 $669,812 $572,000 371 49.5% 748 2.4 97% 30 Vaughan 271 $174,216,140 $642,864 $580,000 541 51.4% 959 2.5 97% 30 Whitchurch-Stouffville 39 $20,775,050 $532,694 $463,000 89 51.6% 199 3.3 97% 25 Durham Region 749 $256,273,573 $342,154 $312,000 966 64.7% 1,506 2.1 98% 29 Ajax 143 $53,218,268 $372,156 $350,000 167 66.8% 208 1.5 98% 25 Brock 25 $8,858,656 $354,346 $281,156 25 46.4% 110 7.5 96% 86 Clarington 126 $37,553,440 $298,043 $283,000 144 67.7% 215 2.1 98% 28 Oshawa 176 $46,507,817 $264,249 $239,250 238 66.3% 319 1.9 98% 27 Pickering 117 $48,358,465 $413,320 $375,000 139 62.6% 187 1.9 98% 25 Scugog 18 $6,469,900 $359,439 $291,000 35 52.2% 109 4.6 98% 42 Uxbridge 25 $12,763,000 $510,520 $463,000 32 55.7% 96 4.3 95% 57 Whitby 119 $42,544,027 $357,513 $342,500 186 66.4% 262 1.6 98% 25 Dufferin County 46 $15,822,400 $343,965 $316,500 42 74.1% 103 2.3 97% 44 Orangeville 46 $15,822,400 $343,965 $316,500 42 74.1% 103 2.3 97% 44 Simcoe County 142 $50,982,894 $359,034 $318,500 186 59.7% 593 3.7 97% 49 Adjala-Tosorontio 15 $7,865,500 $524,367 $428,000 16 51.2% 75 6.3 95% 59 Bradford West Gwillimbury 34 $13,435,200 $395,153 $384,000 61 62.7% 142 2.4 97% 36 Essa 17 $4,698,094 $276,358 $237,000 15 55.2% 66 4.8 98% 42 Innisfil 41 $13,901,400 $339,059 $285,000 46 56.3% 166 4.4 96% 58 New Tecumseth 35 $11,082,700 $316,649 $288,000 48 66.0% 144 3.1 98% 51 Page 3 July 2010 Market Watch, November 2012 3
- 4. Toronto Real Estate Board ALL HOME TYPES, NOVEMBER 2012 SUMMARY OF EXISTING HOME TRANSACTIONS CITY OF TORONTO MUNICIPAL BREAKDOWN 1 1 1 2 8 3 4 5 Number of Sales Dollar Volume Average Price Median Price New Listings SNLR (Trend) Active Listings Mos. Inv. (Trend)9 Avg. SP/LP Avg. DOM TREB Total 5,793 $2,811,505,718 $485,328 $410,000 9,838 54.4% 18,311 2.5 97% 30 City of Toronto Total 2,308 $1,195,235,446 $517,866 $425,000 4,056 51.4% 7,456 2.7 98% 29 Toronto West 647 $304,516,210 $470,659 $417,000 1,027 54.7% 1,841 2.6 98% 30 Toronto W01 51 $26,880,039 $527,060 $484,900 69 50.7% 109 2.6 100% 23 Toronto W02 83 $45,620,514 $549,645 $525,000 112 64.4% 120 1.4 100% 19 Toronto W03 45 $17,136,200 $380,804 $390,000 92 64.6% 127 1.8 97% 28 Toronto W04 67 $25,101,350 $374,647 $365,000 83 57.2% 173 2.7 97% 31 Toronto W05 83 $27,229,400 $328,065 $340,000 117 57.2% 223 2.9 97% 35 Toronto W06 82 $39,424,336 $480,785 $445,000 196 41.6% 423 3.9 98% 32 Toronto W07 23 $16,324,499 $709,761 $660,000 33 70.0% 36 1.3 100% 17 Toronto W08 112 $72,777,123 $649,796 $512,500 184 55.5% 349 2.6 97% 29 Toronto W09 36 $14,226,400 $395,178 $438,750 50 55.3% 99 2.9 97% 40 Toronto W10 65 $19,796,349 $304,559 $340,000 91 54.5% 182 2.8 96% 36 Toronto Central 1,003 $614,440,760 $612,603 $450,000 1,943 46.6% 3,955 3.1 97% 31 Toronto C01 264 $127,105,190 $481,459 $402,750 595 42.1% 1,214 3.7 98% 33 Toronto C02 46 $45,439,575 $987,817 $767,000 115 44.8% 260 3.8 97% 26 Toronto C03 34 $26,901,888 $791,232 $580,000 61 57.5% 104 2.2 97% 23 Toronto C04 60 $59,538,000 $992,300 $930,250 117 52.5% 231 2.4 97% 26 Toronto C06 30 $16,990,732 $566,358 $591,500 55 51.0% 86 2.8 98% 38 Toronto C07 86 $46,643,615 $542,368 $387,250 120 45.8% 308 3.0 97% 33 Toronto C08 114 $47,843,751 $419,682 $356,500 191 47.6% 374 2.9 98% 33 Toronto C09 25 $26,486,438 $1,059,458 $777,500 30 56.1% 67 2.6 96% 18 Toronto C10 56 $33,507,213 $598,343 $492,000 82 58.7% 111 1.8 99% 20 Toronto C11 46 $29,613,482 $643,771 $333,500 55 56.6% 103 2.3 97% 30 Toronto C12 18 $28,376,500 $1,576,472 $1,690,000 53 42.4% 151 4.5 94% 48 Toronto C13 57 $28,692,999 $503,386 $425,000 84 57.0% 145 2.1 99% 26 Toronto C14 89 $49,214,090 $552,967 $375,000 222 42.6% 469 3.2 96% 37 Toronto C15 78 $48,087,287 $616,504 $501,500 163 46.0% 332 3.0 96% 31 Toronto East 658 $276,278,476 $419,876 $416,950 1,086 57.5% 1,660 2.1 98% 27 Toronto E01 64 $34,792,400 $543,631 $540,000 105 60.6% 117 1.5 99% 19 Toronto E02 44 $25,140,650 $571,378 $532,500 84 60.7% 104 1.4 99% 13 Toronto E03 76 $41,220,317 $542,373 $533,500 130 58.9% 138 1.6 101% 17 Toronto E04 80 $28,719,569 $358,995 $384,000 138 57.4% 213 2.2 97% 30 Toronto E05 57 $21,076,768 $369,768 $340,000 100 60.0% 157 1.8 97% 37 Toronto E06 31 $16,342,150 $527,166 $465,000 42 54.1% 57 1.7 98% 20 Toronto E07 60 $22,560,800 $376,013 $410,000 106 54.3% 200 2.6 97% 33 Toronto E08 55 $21,158,721 $384,704 $400,000 67 55.9% 140 2.5 97% 28 Toronto E09 91 $30,005,301 $329,729 $335,000 146 55.4% 238 2.6 98% 32 Toronto E10 52 $20,588,250 $395,928 $426,250 78 59.1% 128 2.0 98% 26 Toronto E11 48 $14,673,550 $305,699 $312,500 90 56.1% 168 2.4 98% 35 Page 3 July 2010 Market Watch, November 2012 4
- 5. Toronto Real Estate Board ALL HOME TYPES, YEAR-TO-DATE 2012 SUMMARY OF EXISTING HOME TRANSACTIONS ALL TREB AREAS Number of Sales Dollar Volume1 Average Price1 Median Price1 New Listings2 Avg. SP/LP 4 Avg. DOM5 TREB Total 82,200 $40,955,568,255 $498,243 $420,000 154,691 99% 25 Halton Region 5,382 $3,031,000,069 $563,174 $470,000 9,585 98% 25 Burlington 805 $384,276,910 $477,363 $410,000 1,400 98% 28 Halton Hills 842 $388,510,526 $461,414 $429,250 1,285 98% 29 Milton 1,636 $756,477,629 $462,395 $427,700 2,953 99% 19 Oakville 2,099 $1,501,735,004 $715,453 $595,000 3,947 97% 28 Peel Region 17,808 $7,814,756,614 $438,834 $398,000 33,913 98% 23 Brampton 7,609 $3,076,849,497 $404,370 $384,000 14,675 98% 23 Caledon 769 $428,826,776 $557,642 $490,000 1,503 97% 33 Mississauga 9,430 $4,309,080,341 $456,954 $408,750 17,735 98% 23 City of Toronto 31,245 $16,881,064,691 $540,281 $427,000 62,439 100% 24 ! TURN PAGE FOR CITY OF TORONTO TABLES OR CLICK HERE: York Region 15,052 $8,925,857,677 $593,001 $535,000 28,650 98% 23 Aurora 845 $477,020,911 $564,522 $496,000 1,400 99% 21 E. Gwillimbury 298 $151,242,159 $507,524 $434,150 532 97% 32 Georgina 811 $256,239,178 $315,955 $295,000 1,280 98% 37 King 266 $226,574,579 $851,784 $722,750 577 95% 50 Markham 4,095 $2,482,375,579 $606,197 $551,500 7,917 99% 21 Newmarket 1,425 $638,865,647 $448,327 $425,000 2,088 99% 20 Richmond Hill 2,928 $1,946,618,804 $664,829 $597,000 6,095 99% 21 Vaughan 3,695 $2,332,703,454 $631,314 $575,000 7,386 98% 23 Whitchurch-Stouffville 689 $414,217,366 $601,186 $521,900 1,375 97% 30 Durham Region 10,158 $3,416,754,188 $336,361 $312,000 15,936 98% 27 Ajax 1,881 $693,792,036 $368,842 $352,000 2,855 99% 21 Brock 200 $55,670,596 $278,353 $236,000 437 96% 80 Clarington 1,643 $482,048,267 $293,395 $274,500 2,446 98% 29 Oshawa 2,459 $637,278,047 $259,161 $245,000 3,745 98% 26 Pickering 1,381 $549,881,090 $398,176 $370,000 2,256 98% 24 Scugog 296 $111,351,398 $376,187 $333,000 563 97% 45 Uxbridge 307 $146,621,511 $477,594 $439,000 565 97% 48 Whitby 1,991 $740,111,243 $371,728 $350,000 3,069 99% 21 Dufferin County 594 $203,647,865 $342,842 $319,500 825 98% 37 Orangeville 594 $203,647,865 $342,842 $319,500 825 98% 37 Simcoe County 1,961 $682,487,151 $348,030 $319,900 3,343 97% 46 Adjala-Tosorontio 140 $59,929,950 $428,071 $388,000 294 97% 72 Bradford West Gwillimbury 511 $210,657,924 $412,246 $389,000 834 98% 29 Essa 269 $79,662,750 $296,144 $260,000 481 98% 55 Innisfil 506 $162,004,279 $320,167 $299,250 920 97% 51 New Tecumseth 535 $170,232,248 $318,191 $292,000 814 97% 46 Page 3 July 2010 Market Watch, November 2012 5
- 6. Toronto Real Estate Board ALL HOME TYPES, YEAR-TO-DATE 2012 SUMMARY OF EXISTING HOME TRANSACTIONS CITY OF TORONTO MUNICIPAL BREAKDOWN 1 1 1 2 4 5 Number of Sales Dollar Volume Average Price Median Price New Listings Avg. SP/LP Avg. DOM TREB Total 82,200 $40,955,568,255 $498,243 $420,000 154,691 99% 25 City of Toronto Total 31,245 $16,881,064,691 $540,281 $427,000 62,439 100% 24 Toronto West 8,125 $3,849,420,988 $473,775 $415,000 15,273 100% 25 Toronto W01 566 $336,799,978 $595,053 $534,000 1,140 102% 20 Toronto W02 839 $505,369,472 $602,347 $562,000 1,334 103% 17 Toronto W03 685 $267,836,345 $391,002 $385,000 1,082 100% 22 Toronto W04 787 $295,092,129 $374,958 $367,000 1,406 98% 28 Toronto W05 1,024 $352,612,062 $344,348 $366,700 1,848 98% 31 Toronto W06 1,149 $522,181,368 $454,466 $424,400 2,809 99% 30 Toronto W07 305 $210,072,031 $688,761 $636,000 449 102% 17 Toronto W08 1,469 $906,737,565 $617,248 $515,000 2,767 99% 25 Toronto W09 466 $195,417,841 $419,352 $437,000 868 99% 28 Toronto W10 835 $257,302,197 $308,146 $340,000 1,570 98% 27 Toronto Central 14,016 $9,076,794,095 $647,602 $452,000 30,940 99% 25 Toronto C01 3,682 $1,676,612,168 $455,354 $392,500 9,021 99% 27 Toronto C02 693 $697,685,483 $1,006,761 $801,000 1,582 99% 26 Toronto C03 498 $478,774,240 $961,394 $640,000 890 99% 21 Toronto C04 920 $996,366,722 $1,083,007 $997,500 1,784 100% 20 Toronto C06 305 $185,684,303 $608,801 $620,000 612 100% 26 Toronto C07 1,082 $623,628,980 $576,367 $439,000 2,446 99% 24 Toronto C08 1,451 $635,078,051 $437,683 $385,000 3,135 99% 26 Toronto C09 281 $353,146,497 $1,256,749 $901,000 524 98% 23 Toronto C10 647 $427,692,050 $661,039 $559,000 1,144 101% 19 Toronto C11 423 $275,008,813 $650,139 $374,000 768 100% 24 Toronto C12 373 $660,122,164 $1,769,765 $1,507,000 902 97% 32 Toronto C13 766 $438,942,885 $573,032 $447,750 1,380 101% 22 Toronto C14 1,526 $893,721,642 $585,663 $425,000 3,731 99% 25 Toronto C15 1,369 $734,330,097 $536,399 $420,000 3,021 100% 26 Toronto East 9,104 $3,954,849,608 $434,408 $413,000 16,226 100% 21 Toronto E01 847 $487,658,522 $575,748 $550,501 1,420 103% 14 Toronto E02 721 $480,490,654 $666,423 $592,500 1,224 101% 13 Toronto E03 999 $533,216,504 $533,750 $515,000 1,741 102% 16 Toronto E04 1,071 $374,225,232 $349,417 $375,000 1,916 99% 24 Toronto E05 933 $378,218,875 $405,379 $359,900 1,614 100% 21 Toronto E06 366 $184,497,907 $504,093 $435,250 692 100% 17 Toronto E07 873 $322,177,646 $369,047 $340,000 1,666 100% 27 Toronto E08 601 $246,356,814 $409,912 $399,000 1,106 98% 26 Toronto E09 1,164 $376,691,062 $323,618 $318,500 2,129 99% 27 Toronto E10 640 $280,547,401 $438,355 $431,000 1,094 99% 22 Toronto E11 889 $290,768,991 $327,074 $318,000 1,624 99% 25 Page 3 July 2010 Market Watch, November 2012 6
- 7. Toronto Real Estate Board DETACHED HOUSES, NOVEMBER 2012 Industrial Leasing SUMMARY OF EXISTING HOME TRANSACTIONS ALL TREB AREAS Sales1 Dollar Volume1 Average Price1 Median Price1 New Listings2 Active Listings3 Avg. SP/LP 4 Avg. DOM5 TREB Total 2,718 - $1,654,370,799 - $608,672 - $519,000 - 4,724 - 9,067 - 97% - 31 - Halton Region 240 $161,122,010 $671,342 $547,500 418 906 96% 31 Burlington 45 $26,688,700 $593,082 $562,000 51 145 97% 37 Halton Hills 56 $26,704,800 $476,871 $462,500 72 153 98% 27 Milton 57 $33,261,200 $583,530 $497,000 112 207 97% 31 Oakville 82 - $74,467,310 - $908,138 - $703,125 - 183 - 401 - 94% - 32 - Peel Region 490 $280,367,278 $572,178 $520,000 1,041 1,983 97% 30 Brampton 253 $120,336,962 $475,640 $448,000 593 1,003 97% 29 Caledon 37 $21,891,290 $591,656 $583,500 77 264 97% 44 Mississauga 200 - $138,139,026 - $690,695 - $600,050 - 371 - 716 - 96% - 28 - City of Toronto 764 $566,490,616 $741,480 $580,500 1,291 2,053 97% 25 ! TURN PAGE FOR CITY OF TORONTO TABLES OR CLICK HERE: - - - - - - - - York Region 571 $397,133,675 $695,506 $635,000 1,070 2,315 96% 33 Aurora 24 $16,193,800 $674,742 $665,000 40 125 96% 38 E. Gwillimbury 14 $6,509,250 $464,946 $428,000 34 101 97% 39 Georgina 65 $20,226,015 $311,169 $307,000 55 175 97% 48 King 11 $9,492,000 $862,909 $833,000 34 140 93% 52 Markham 119 $88,410,884 $742,949 $683,000 221 434 96% 30 Newmarket 52 $27,642,788 $531,592 $491,750 83 142 97% 31 Richmond Hill 106 $90,655,538 $855,241 $784,000 226 465 96% 30 Vaughan 152 $121,654,850 $800,361 $688,450 306 561 97% 31 Whitchurch-Stouffville 28 - $16,348,550 - $583,877 - $507,500 - 71 - 172 - 97% - 28 - Durham Region 517 $196,328,620 $379,746 $355,388 721 1,204 97% 32 Ajax 97 $40,501,718 $417,543 $396,000 121 140 98% 26 Brock 25 $8,858,656 $354,346 $281,156 25 107 96% 86 Clarington 85 $28,274,290 $332,639 $312,000 103 181 97% 31 Oshawa 131 $38,073,427 $290,637 $269,900 182 245 98% 27 Pickering 69 $33,957,650 $492,140 $454,800 85 132 97% 30 Scugog 17 $6,209,900 $365,288 $315,000 34 106 98% 43 Uxbridge 20 $11,255,000 $562,750 $486,500 31 86 95% 59 Whitby 73 - $29,197,979 - $399,972 - $375,000 - 140 - 207 - 98% - 26 - Dufferin County 30 $11,685,400 $389,513 $330,000 29 76 97% 42 Orangeville 30 - $11,685,400 - $389,513 - $330,000 - 29 - 76 - 97% - 42 - Simcoe County 106 $41,243,200 $389,087 $351,750 154 530 96% 49 Adjala-Tosorontio 15 $7,865,500 $524,367 $428,000 16 74 95% 59 Bradford West Gwillimbury 23 $9,819,000 $426,913 $415,000 49 126 97% 35 Essa 8 $2,638,500 $329,813 $295,000 12 60 97% 37 Innisfil 37 $13,075,900 $353,403 $309,000 43 164 96% 61 New Tecumseth 23 $7,844,300 $341,057 $316,000 34 106 98% 40 Page 3 July 2010 Market Watch, November 2012 7
- 8. Toronto Real Estate Board DETACHED HOUSES, NOVEMBER 2012 Industrial Leasing SUMMARY OF EXISTING HOME TRANSACTIONS CITY OF TORONTO MUNICIPAL BREAKDOWN Sales1 Dollar Volume1 Average Price1 Median Price1 New Listings2 Active Listings3 Avg. SP/LP 4 Avg. DOM5 TREB Total 2,718 $1,654,370,799 $608,672 $519,000 4,724 9,067 97% 31 City of Toronto Total 764 $566,490,616 $741,480 $580,500 1,291 2,053 97% 25 Toronto West 252 $164,972,077 $654,651 $547,500 388 574 98% 26 Toronto W01 10 $7,608,000 $760,800 $751,000 8 16 98% 19 Toronto W02 28 $20,554,400 $734,086 $708,000 43 48 100% 20 Toronto W03 21 $8,394,500 $399,738 $393,000 45 61 97% 31 Toronto W04 33 $15,738,250 $476,917 $422,000 43 79 97% 26 Toronto W05 13 $6,803,500 $523,346 $451,000 26 39 97% 29 Toronto W06 36 $20,534,305 $570,397 $504,000 49 73 99% 24 Toronto W07 16 $12,383,000 $773,938 $736,250 27 31 100% 18 Toronto W08 50 $51,718,123 $1,034,362 $804,000 84 132 97% 30 Toronto W09 17 $9,397,000 $552,765 $530,000 27 40 98% 22 Toronto W10 28 $11,840,999 $422,893 $402,400 36 55 95% 27 Toronto Central 217 $249,247,171 $1,148,604 $965,000 404 817 97% 29 Toronto C01 5 $4,923,225 $984,645 $915,225 12 16 100% 22 Toronto C02 6 $8,573,800 $1,428,967 $970,000 15 30 94% 26 Toronto C03 20 $18,784,388 $939,219 $703,750 36 65 97% 23 Toronto C04 39 $48,570,000 $1,245,385 $1,085,000 87 158 97% 26 Toronto C06 15 $11,440,352 $762,690 $670,000 34 50 97% 32 Toronto C07 27 $24,003,737 $889,027 $792,800 33 107 96% 38 Toronto C08 - - - - 1 5 - - Toronto C09 7 $14,206,888 $2,029,555 $1,675,000 9 27 97% 14 Toronto C10 9 $10,511,500 $1,167,944 $1,035,000 10 16 99% 20 Toronto C11 16 $21,639,582 $1,352,474 $1,221,750 18 23 98% 23 Toronto C12 12 $23,893,000 $1,991,083 $2,065,000 34 105 94% 46 Toronto C13 17 $14,659,899 $862,347 $760,000 32 45 100% 16 Toronto C14 21 $24,001,000 $1,142,905 $900,000 48 100 95% 35 Toronto C15 23 $24,039,800 $1,045,209 $965,000 35 70 96% 33 Toronto East 295 $152,271,368 $516,174 $469,000 499 662 98% 23 Toronto E01 11 $7,081,800 $643,800 $645,000 20 23 101% 26 Toronto E02 18 $12,498,900 $694,383 $582,450 33 49 98% 14 Toronto E03 45 $26,848,017 $596,623 $580,000 90 90 101% 16 Toronto E04 37 $16,635,600 $449,611 $435,000 77 82 96% 21 Toronto E05 13 $7,460,700 $573,900 $560,000 27 40 97% 30 Toronto E06 26 $14,133,900 $543,612 $495,000 41 51 98% 19 Toronto E07 22 $11,555,800 $525,264 $488,250 29 59 98% 31 Toronto E08 32 $15,304,300 $478,259 $449,500 31 56 97% 31 Toronto E09 43 $18,550,101 $431,398 $427,000 59 75 98% 24 Toronto E10 34 $15,755,000 $463,382 $450,950 57 85 99% 22 Toronto E11 14 $6,447,250 $460,518 $482,500 35 52 98% 22 Page 3 July 2010 Market Watch, November 2012 8
- 9. Toronto Real Estate Board SEMI-DETACHED HOUSES, NOVEMBER 2012 Industrial Leasing SUMMARY OF EXISTING HOME TRANSACTIONS ALL TREB AREAS Sales1 Dollar Volume1 Average Price1 Median Price1 New Listings2 Active Listings3 Avg. SP/LP 4 Avg. DOM5 TREB Total 677 - $318,923,478 - $471,083 - $430,000 - 910 - 1,102 - 99% - 22 - Halton Region 34 $14,784,400 $434,835 $408,000 40 48 98% 24 Burlington 2 $703,500 $351,750 $351,750 6 5 98% 9 Halton Hills 2 $798,000 $399,000 $399,000 2 7 98% 31 Milton 20 $7,992,900 $399,645 $402,000 22 24 99% 20 Oakville 10 - $5,290,000 - $529,000 - $427,000 - 10 - 12 - 98% - 33 - Peel Region 198 $77,650,379 $392,174 $384,500 338 450 98% 23 Brampton 97 $34,608,951 $356,793 $353,000 171 248 98% 27 Caledon 8 $3,102,900 $387,863 $382,000 3 3 98% 21 Mississauga 93 - $39,938,528 - $429,447 - $428,900 - 164 - 199 - 98% - 20 - City of Toronto 280 $163,272,708 $583,117 $540,000 346 378 100% 20 ! TURN PAGE FOR CITY OF TORONTO TABLES OR CLICK HERE: - - - - - - - - York Region 101 $46,210,888 $457,534 $465,000 129 160 98% 25 Aurora 3 $1,099,500 $366,500 $361,500 4 5 100% 13 E. Gwillimbury - - - - 2 2 - - Georgina - - - - 2 1 - - King - - - - - 1 - - Markham 27 $13,133,538 $486,427 $476,000 27 32 98% 24 Newmarket 20 $6,994,600 $349,730 $371,250 18 18 97% 25 Richmond Hill 15 $7,043,350 $469,557 $465,000 12 18 97% 28 Vaughan 31 $15,934,400 $514,013 $506,000 52 67 98% 26 Whitchurch-Stouffville 5- $2,005,500 - $401,100 - $395,000 - 12 - 16 - 99% - 16 - Durham Region 48 $12,481,403 $260,029 $228,750 47 50 98% 19 Ajax 7 $2,416,000 $345,143 $355,000 8 9 97% 15 Brock - - - - - - - - Clarington 1 $135,000 $135,000 $135,000 1 3 100% 14 Oshawa 24 $4,974,190 $207,258 $208,020 25 26 98% 19 Pickering 11 $3,630,815 $330,074 $326,500 8 6 98% 22 Scugog 1 $260,000 $260,000 $260,000 - - 98% 11 Uxbridge - - - - 1 1 - - Whitby 4- $1,065,398 - $266,350 - $272,250 - 4- 5- 99% - 23 - Dufferin County 8 $2,026,000 $253,250 $247,500 4 5 98% 26 Orangeville 8 - $2,026,000 - $253,250 - $247,500 - 4 - 5 - 98% - 26 - Simcoe County 8 $2,497,700 $312,213 $300,900 6 11 97% 45 Adjala-Tosorontio - - - - - 1 - - Bradford West Gwillimbury 7 $2,274,700 $324,957 $303,800 4 3 97% 38 Essa - - - - - 1 - - Innisfil - - - - - - - - New Tecumseth 1 $223,000 $223,000 $223,000 2 6 97% 97 Page 3 July 2010 Market Watch, November 2012 9
- 10. Toronto Real Estate Board SEMI-DETACHED HOUSES, NOVEMBER 2012 Industrial Leasing SUMMARY OF EXISTING HOME TRANSACTIONS CITY OF TORONTO MUNICIPAL BREAKDOWN Sales1 Dollar Volume1 Average Price1 Median Price1 New Listings2 Active Listings3 Avg. SP/LP 4 Avg. DOM5 TREB Total 677 $318,923,478 $471,083 $430,000 910 1,102 99% 22 City of Toronto Total 280 $163,272,708 $583,117 $540,000 346 378 100% 20 Toronto West 95 $45,644,200 $480,465 $440,000 113 121 100% 19 Toronto W01 7 $5,233,600 $747,657 $765,100 10 6 106% 17 Toronto W02 24 $13,550,200 $564,592 $569,500 28 24 102% 13 Toronto W03 17 $7,050,700 $414,747 $410,000 26 30 98% 26 Toronto W04 9 $3,763,800 $418,200 $430,000 6 12 98% 23 Toronto W05 28 $11,812,000 $421,857 $399,000 25 29 98% 23 Toronto W06 3 $1,304,000 $434,667 $440,000 9 11 102% 7 Toronto W07 - - - - 1 1 - - Toronto W08 1 $510,000 $510,000 $510,000 - 1 104% 14 Toronto W09 3 $1,210,900 $403,633 $392,000 3 2 98% 24 Toronto W10 3 $1,209,000 $403,000 $340,000 5 5 98% 9 Toronto Central 90 $69,502,008 $772,245 $660,000 113 135 100% 20 Toronto C01 18 $14,374,508 $798,584 $730,000 26 31 102% 15 Toronto C02 16 $19,449,500 $1,215,594 $1,107,500 20 25 99% 17 Toronto C03 7 $3,764,000 $537,714 $495,000 7 10 99% 18 Toronto C04 8 $5,579,000 $697,375 $701,000 5 1 98% 20 Toronto C06 2 $933,000 $466,500 $466,500 1 1 99% 58 Toronto C07 2 $1,060,000 $530,000 $530,000 6 9 96% 28 Toronto C08 5 $4,009,200 $801,840 $805,000 11 11 97% 30 Toronto C09 1 $820,000 $820,000 $820,000 - 1 99% 11 Toronto C10 9 $6,858,300 $762,033 $700,000 9 6 103% 15 Toronto C11 3 $2,116,000 $705,333 $660,000 1 1 96% 23 Toronto C12 1 $579,000 $579,000 $579,000 - - 102% 18 Toronto C13 4 $1,952,000 $488,000 $468,000 8 9 102% 23 Toronto C14 2 $1,281,000 $640,500 $640,500 2 - 100% 14 Toronto C15 12 $6,726,500 $560,542 $562,750 17 30 98% 24 Toronto East 95 $48,126,500 $506,595 $512,500 120 122 99% 20 Toronto E01 29 $16,583,400 $571,841 $570,000 39 33 100% 19 Toronto E02 15 $8,279,400 $551,960 $548,000 21 20 99% 13 Toronto E03 22 $12,166,000 $553,000 $544,000 22 15 101% 17 Toronto E04 7 $2,671,000 $381,571 $365,000 6 8 98% 32 Toronto E05 4 $1,935,000 $483,750 $480,000 8 11 98% 18 Toronto E06 2 $938,000 $469,000 $469,000 - 4 100% 12 Toronto E07 5 $2,104,000 $420,800 $413,000 7 9 99% 17 Toronto E08 - - - - - - - - Toronto E09 2 $602,300 $301,150 $301,150 3 2 100% 12 Toronto E10 4 $1,310,900 $327,725 $304,950 4 7 97% 36 Toronto E11 5 $1,536,500 $307,300 $300,000 10 13 95% 39 Page 3 July 2010 Market Watch, November 2012 10
- 11. Toronto Real Estate Board CONDOMINIUM TOWNHOUSES, NOVEMBER 2012 Industrial Leasing SUMMARY OF EXISTING HOME TRANSACTIONS ALL TREB AREAS Sales1 Dollar Volume1 Average Price1 Median Price1 New Listings2 Active Listings3 Avg. SP/LP 4 Avg. DOM5 TREB Total 417 - $137,394,173 - $329,482 - $314,500 - 629 - 1,007 - 98% - 29 - Halton Region 17 $5,276,508 $310,383 $313,000 37 57 98% 21 Burlington 6 $1,915,000 $319,167 $296,500 8 16 98% 20 Halton Hills 2 $528,500 $264,250 $264,250 4 5 97% 39 Milton - - - - 4 7 - - Oakville 9- $2,833,008 - $314,779 - $316,000 - 21 - 29 - 98% - 18 - Peel Region 167 $51,925,030 $310,928 $310,000 212 316 98% 29 Brampton 38 $9,609,890 $252,892 $239,000 50 77 97% 34 Caledon - - - - 1 3 - - Mississauga 129 - $42,315,140 - $328,024 - $336,000 - 161 - 236 - 98% - 28 - City of Toronto 153 $57,111,985 $373,281 $340,000 241 421 97% 31 ! TURN PAGE FOR CITY OF TORONTO TABLES OR CLICK HERE: - - - - - - - - York Region 32 $12,440,500 $388,766 $368,750 82 131 98% 25 Aurora 5 $2,302,500 $460,500 $389,000 6 14 97% 21 E. Gwillimbury - - - - - - - - Georgina - - - - - - - - King - - - - - - - - Markham 13 $5,070,000 $390,000 $372,500 35 59 97% 30 Newmarket 4 $1,120,500 $280,125 $277,500 5 6 99% 18 Richmond Hill 4 $1,482,500 $370,625 $352,500 20 32 100% 26 Vaughan 6 $2,465,000 $410,833 $417,500 16 19 97% 21 Whitchurch-Stouffville - - - - - - - - - - 1- - - - - Durham Region 42 $9,404,250 $223,911 $219,450 51 74 98% 27 Ajax 7 $1,718,650 $245,521 $243,000 11 15 99% 25 Brock - - - - - 3 - - Clarington 4 $1,138,000 $284,500 $196,000 3 4 98% 22 Oshawa 14 $2,164,200 $154,586 $165,500 17 22 98% 38 Pickering 13 $3,550,400 $273,108 $265,000 14 19 98% 17 Scugog - - - - - - - - Uxbridge 2 $433,000 $216,500 $216,500 - 3 97% 46 Whitby 2- $400,000 - $200,000 - $200,000 - 6- 8- 99% - 15 - Dufferin County 2 $365,000 $182,500 $182,500 4 7 97% 21 Orangeville 2 - $365,000 - $182,500 - $182,500 - 4 - 7 - 97% - 21 - Simcoe County 4 $870,900 $217,725 $224,450 2 1 97% 79 Adjala-Tosorontio - - - - - - - - Bradford West Gwillimbury 1 $254,000 $254,000 $254,000 1 - 100% 10 Essa - - - - - - - - Innisfil - - - - - - - - New Tecumseth 3 $616,900 $205,633 $220,000 1 1 96% 102 Page 3 July 2010 Market Watch, November 2012 11
- 12. Toronto Real Estate Board CONDOMINIUM TOWNHOUSES, NOVEMBER 2012 Industrial Leasing SUMMARY OF EXISTING HOME TRANSACTIONS CITY OF TORONTO MUNICIPAL BREAKDOWN Sales1 Dollar Volume1 Average Price1 Median Price1 New Listings2 Active Listings3 Avg. SP/LP 4 Avg. DOM5 TREB Total 417 $137,394,173 $329,482 $314,500 629 1,007 98% 29 City of Toronto Total 153 $57,111,985 $373,281 $340,000 241 421 97% 31 Toronto West 42 $13,904,350 $331,056 $279,950 64 118 98% 32 Toronto W01 6 $2,512,000 $418,667 $416,500 9 8 98% 14 Toronto W02 2 $753,500 $376,750 $376,750 12 11 99% 13 Toronto W03 1 $255,000 $255,000 $255,000 7 8 95% 23 Toronto W04 5 $1,297,400 $259,480 $257,500 7 15 98% 40 Toronto W05 14 $3,986,700 $284,764 $271,000 14 36 97% 43 Toronto W06 3 $1,438,450 $479,483 $445,000 1 10 99% 22 Toronto W07 - - - - - - - - Toronto W08 5 $2,494,800 $498,960 $595,000 7 13 98% 34 Toronto W09 1 $340,000 $340,000 $340,000 2 3 97% 15 Toronto W10 5 $826,500 $165,300 $194,000 5 14 96% 30 Toronto Central 60 $27,829,589 $463,826 $433,500 90 157 97% 30 Toronto C01 20 $8,994,400 $449,720 $449,000 25 34 99% 27 Toronto C02 2 $1,588,000 $794,000 $794,000 4 9 94% 39 Toronto C03 2 $2,026,500 $1,013,250 $1,013,250 2 7 93% 41 Toronto C04 - - - - 1 2 - - Toronto C06 - - - - - 2 - - Toronto C07 7 $2,592,990 $370,427 $372,500 6 14 98% 33 Toronto C08 1 $688,000 $688,000 $688,000 10 13 98% 22 Toronto C09 1 $1,200,000 $1,200,000 $1,200,000 1 2 93% 17 Toronto C10 3 $1,635,000 $545,000 $450,000 3 7 97% 27 Toronto C11 4 $573,500 $143,375 $136,750 2 5 94% 49 Toronto C12 2 $1,131,500 $565,750 $565,750 4 8 98% 30 Toronto C13 4 $1,945,000 $486,250 $484,000 3 6 98% 20 Toronto C14 3 $1,322,800 $440,933 $321,800 7 18 97% 20 Toronto C15 11 $4,131,899 $375,627 $373,999 22 30 99% 31 Toronto East 51 $15,378,046 $301,530 $298,000 87 146 97% 32 Toronto E01 2 $830,800 $415,400 $415,400 7 11 100% 51 Toronto E02 3 $1,351,500 $450,500 $446,500 4 4 98% 5 Toronto E03 - - - - - 1 - - Toronto E04 6 $1,891,000 $315,167 $309,000 10 23 98% 38 Toronto E05 12 $3,690,000 $307,500 $315,100 17 23 96% 39 Toronto E06 - - - - - - - - Toronto E07 5 $1,703,000 $340,600 $323,000 5 9 98% 32 Toronto E08 7 $2,092,096 $298,871 $284,000 6 14 96% 29 Toronto E09 4 $803,000 $200,750 $164,000 16 22 95% 19 Toronto E10 6 $1,420,850 $236,808 $233,000 7 11 97% 24 Toronto E11 6 $1,595,800 $265,967 $245,950 15 28 99% 39 Page 3 July 2010 Market Watch, November 2012 12