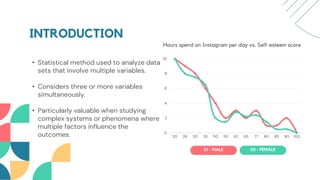
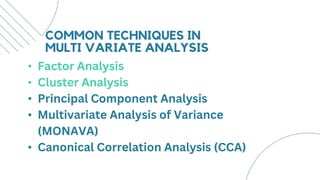
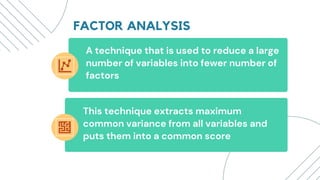
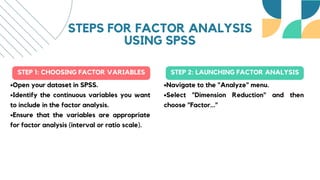
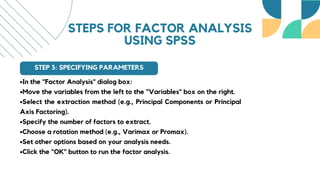
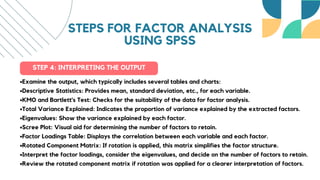
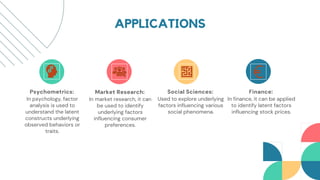
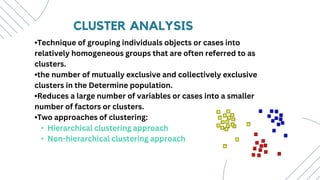
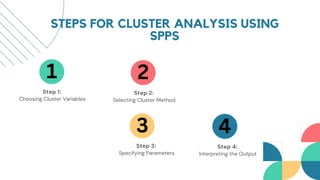
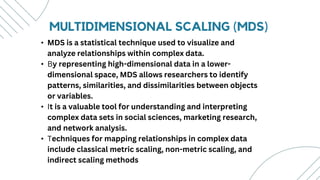
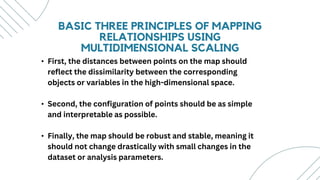
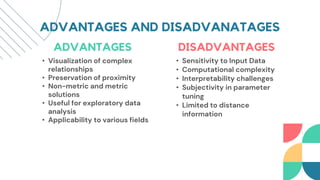
MULTIVARIATE
ANALYSIS
PRESENTED BY
Nitin Maharjan
Shrawak Maharjan
Sujan Bhandari
Palistha Maharjan
INTRODUCTION
• Statistical method used to analyze data
sets that involve multiple variables.
• Considers three or more variables
simultaneously.
• Particularly valuable when studying
complex systems or phenomena where
multiple factors influence the
outcomes.
Hours spend on Instagram per day vs. Self-esteem score
01 - MALE 02 - FEMALE
01 - POWERFUL FRAMEWORK
02 - COMPREHENSIVE APPROACH
03 - POWERFUL TOOL
It provides a powerful framework for
researchers and analysts to gain a deeper
understanding of complex relationships within
data sets
It offers a comprehensive approach to
understanding complex relationships within
datasets with multiple variables
It offers a powerful tool for researchers and
analysts seeking to uncover nuanced insights
from complex datasets
USAGE OF MULTIVARIATE ANALYSIS
COMMON TECHNIQUES IN
MULTI VARIATE ANALYSIS
• Factor Analysis
• Cluster Analysis
• Principal Component Analysis
• Multivariate Analysis of Variance
(MONAVA)
• Canonical Correlation Analysis (CCA)
WHAT IS FACTOR ANALYSIS?
Consider you have 50
students, and we need to
put them in 6 rooms.
We need to see which
students have the same
habits so they can stay in
the same room
Now consider variables are your
rooms and items to measure
these variables are students
Factor analysis helps us
in identifying these
things
A technique that is used to reduce a large
number of variables into fewer number of
factors
This technique extracts maximum
common variance from all variables and
puts them into a common score
FACTOR ANALYSIS
SPSS
(Statistical Package for the Social Sciences)
is a powerful software program widely used for statistical
analysis in various fields, including social sciences, business,
and health research. It provides a user-friendly interface,
making it accessible to researchers, analysts, and students.
SPSS
SPSS
STEPS FOR FACTOR ANALYSIS
USING SPSS
STEP 1: CHOOSING FACTOR VARIABLES STEP 2: LAUNCHING FACTOR ANALYSIS
•Open your dataset in SPSS.
•Identify the continuous variables you want
to include in the factor analysis.
•Ensure that the variables are appropriate
for factor analysis (interval or ratio scale).
•Navigate to the "Analyze" menu.
•Select "Dimension Reduction" and then
choose "Factor..."
STEPS FOR FACTOR ANALYSIS
USING SPSS
STEP 3: SPECIFYING PARAMETERS
•In the "Factor Analysis" dialog box:
•Move the variables from the left to the "Variables" box on the right.
•Select the extraction method (e.g., Principal Components or Principal
Axis Factoring).
•Specify the number of factors to extract.
•Choose a rotation method (e.g., Varimax or Promax).
•Set other options based on your analysis needs.
•Click the "OK" button to run the factor analysis.
STEPS FOR FACTOR ANALYSIS
USING SPSS
STEP 4: INTERPRETING THE OUTPUT
•Examine the output, which typically includes several tables and charts:
•Descriptive Statistics: Provides mean, standard deviation, etc., for each variable.
•KMO and Bartlett's Test: Checks for the suitability of the data for factor analysis.
•Total Variance Explained: Indicates the proportion of variance explained by the extracted factors.
•Eigenvalues: Show the variance explained by each factor.
•Scree Plot: Visual aid for determining the number of factors to retain.
•Factor Loadings Table: Displays the correlation between each variable and each factor.
•Rotated Component Matrix: If rotation is applied, this matrix simplifies the factor structure.
•Interpret the factor loadings, consider the eigenvalues, and decide on the number of factors to retain.
•Review the rotated component matrix if rotation was applied for a clearer interpretation of factors.
APPLICATIONS
Psychometrics: Market Research: Social Sciences: Finance:
In psychology, factor
analysis is used to
understand the latent
constructs underlying
observed behaviors or
traits.
In market research, it can
be used to identify
underlying factors
influencing consumer
preferences.
Used to explore underlying
factors influencing various
social phenomena.
In finance, it can be applied
to identify latent factors
influencing stock prices.
•Technique of grouping individuals objects or cases into
relatively homogeneous groups that are often referred to as
clusters.
•the number of mutually exclusive and collectively exclusive
clusters in the Determine population.
•Reduces a large number of variables or cases into a smaller
number of factors or clusters.
•Two approaches of clustering:
• Hierarchical clustering approach
• Non-hierarchical clustering approach
CLUSTER ANALYSIS
STEPS FOR CLUSTER ANALYSIS USING
SPPS
Step 1: Step 2:
Step 3: Step 4:
Choosing Cluster Variables Selecting Cluster Method
Specifying Parameters Interpreting the Output
1 2
3 4
• MDS is a statistical technique used to visualize and
analyze relationships within complex data.
• By representing high-dimensional data in a lower-
dimensional space, MDS allows researchers to identify
patterns, similarities, and dissimilarities between objects
or variables.
• It is a valuable tool for understanding and interpreting
complex data sets in social sciences, marketing research,
and network analysis.
• Techniques for mapping relationships in complex data
include classical metric scaling, non-metric scaling, and
indirect scaling methods
MULTIDIMENSIONAL SCALING (MDS)
• First, the distances between points on the map should
reflect the dissimilarity between the corresponding
objects or variables in the high-dimensional space.
• Second, the configuration of points should be as simple
and interpretable as possible.
• Finally, the map should be robust and stable, meaning it
should not change drastically with small changes in the
dataset or analysis parameters.
BASIC THREE PRINCIPLES OF MAPPING
RELATIONSHIPS USING
MULTIDIMENSIONAL SCALING
ADVANTAGES AND DISADVANATAGES
ADVANTAGES
• Visualization of complex
relationships
• Preservation of proximity
• Non-metric and metric
solutions
• Useful for exploratory data
analysis
• Applicability to various fields
DISADVANTAGES
• Sensitivity to Input Data
• Computational complexity
• Interpretability challenges
• Subjectivity in parameter
tuning
• Limited to distance
information
THANK YOU
Any Questions ?

Multivariate analysis variable presentation

  • 1.
    MULTIVARIATE ANALYSIS PRESENTED BY Nitin Maharjan ShrawakMaharjan Sujan Bhandari Palistha Maharjan
  • 2.
    INTRODUCTION • Statistical methodused to analyze data sets that involve multiple variables. • Considers three or more variables simultaneously. • Particularly valuable when studying complex systems or phenomena where multiple factors influence the outcomes. Hours spend on Instagram per day vs. Self-esteem score 01 - MALE 02 - FEMALE
  • 3.
    01 - POWERFULFRAMEWORK 02 - COMPREHENSIVE APPROACH 03 - POWERFUL TOOL It provides a powerful framework for researchers and analysts to gain a deeper understanding of complex relationships within data sets It offers a comprehensive approach to understanding complex relationships within datasets with multiple variables It offers a powerful tool for researchers and analysts seeking to uncover nuanced insights from complex datasets USAGE OF MULTIVARIATE ANALYSIS
  • 4.
    COMMON TECHNIQUES IN MULTIVARIATE ANALYSIS • Factor Analysis • Cluster Analysis • Principal Component Analysis • Multivariate Analysis of Variance (MONAVA) • Canonical Correlation Analysis (CCA)
  • 5.
    WHAT IS FACTORANALYSIS? Consider you have 50 students, and we need to put them in 6 rooms. We need to see which students have the same habits so they can stay in the same room Now consider variables are your rooms and items to measure these variables are students Factor analysis helps us in identifying these things
  • 6.
    A technique thatis used to reduce a large number of variables into fewer number of factors This technique extracts maximum common variance from all variables and puts them into a common score FACTOR ANALYSIS
  • 7.
    SPSS (Statistical Package forthe Social Sciences) is a powerful software program widely used for statistical analysis in various fields, including social sciences, business, and health research. It provides a user-friendly interface, making it accessible to researchers, analysts, and students. SPSS
  • 8.
  • 9.
    STEPS FOR FACTORANALYSIS USING SPSS STEP 1: CHOOSING FACTOR VARIABLES STEP 2: LAUNCHING FACTOR ANALYSIS •Open your dataset in SPSS. •Identify the continuous variables you want to include in the factor analysis. •Ensure that the variables are appropriate for factor analysis (interval or ratio scale). •Navigate to the "Analyze" menu. •Select "Dimension Reduction" and then choose "Factor..."
  • 10.
    STEPS FOR FACTORANALYSIS USING SPSS STEP 3: SPECIFYING PARAMETERS •In the "Factor Analysis" dialog box: •Move the variables from the left to the "Variables" box on the right. •Select the extraction method (e.g., Principal Components or Principal Axis Factoring). •Specify the number of factors to extract. •Choose a rotation method (e.g., Varimax or Promax). •Set other options based on your analysis needs. •Click the "OK" button to run the factor analysis.
  • 11.
    STEPS FOR FACTORANALYSIS USING SPSS STEP 4: INTERPRETING THE OUTPUT •Examine the output, which typically includes several tables and charts: •Descriptive Statistics: Provides mean, standard deviation, etc., for each variable. •KMO and Bartlett's Test: Checks for the suitability of the data for factor analysis. •Total Variance Explained: Indicates the proportion of variance explained by the extracted factors. •Eigenvalues: Show the variance explained by each factor. •Scree Plot: Visual aid for determining the number of factors to retain. •Factor Loadings Table: Displays the correlation between each variable and each factor. •Rotated Component Matrix: If rotation is applied, this matrix simplifies the factor structure. •Interpret the factor loadings, consider the eigenvalues, and decide on the number of factors to retain. •Review the rotated component matrix if rotation was applied for a clearer interpretation of factors.
  • 12.
    APPLICATIONS Psychometrics: Market Research:Social Sciences: Finance: In psychology, factor analysis is used to understand the latent constructs underlying observed behaviors or traits. In market research, it can be used to identify underlying factors influencing consumer preferences. Used to explore underlying factors influencing various social phenomena. In finance, it can be applied to identify latent factors influencing stock prices.
  • 13.
    •Technique of groupingindividuals objects or cases into relatively homogeneous groups that are often referred to as clusters. •the number of mutually exclusive and collectively exclusive clusters in the Determine population. •Reduces a large number of variables or cases into a smaller number of factors or clusters. •Two approaches of clustering: • Hierarchical clustering approach • Non-hierarchical clustering approach CLUSTER ANALYSIS
  • 14.
    STEPS FOR CLUSTERANALYSIS USING SPPS Step 1: Step 2: Step 3: Step 4: Choosing Cluster Variables Selecting Cluster Method Specifying Parameters Interpreting the Output 1 2 3 4
  • 15.
    • MDS isa statistical technique used to visualize and analyze relationships within complex data. • By representing high-dimensional data in a lower- dimensional space, MDS allows researchers to identify patterns, similarities, and dissimilarities between objects or variables. • It is a valuable tool for understanding and interpreting complex data sets in social sciences, marketing research, and network analysis. • Techniques for mapping relationships in complex data include classical metric scaling, non-metric scaling, and indirect scaling methods MULTIDIMENSIONAL SCALING (MDS)
  • 16.
    • First, thedistances between points on the map should reflect the dissimilarity between the corresponding objects or variables in the high-dimensional space. • Second, the configuration of points should be as simple and interpretable as possible. • Finally, the map should be robust and stable, meaning it should not change drastically with small changes in the dataset or analysis parameters. BASIC THREE PRINCIPLES OF MAPPING RELATIONSHIPS USING MULTIDIMENSIONAL SCALING
  • 17.
    ADVANTAGES AND DISADVANATAGES ADVANTAGES •Visualization of complex relationships • Preservation of proximity • Non-metric and metric solutions • Useful for exploratory data analysis • Applicability to various fields DISADVANTAGES • Sensitivity to Input Data • Computational complexity • Interpretability challenges • Subjectivity in parameter tuning • Limited to distance information
  • 18.