Multivariate analysis
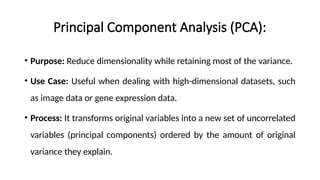
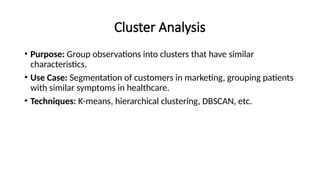
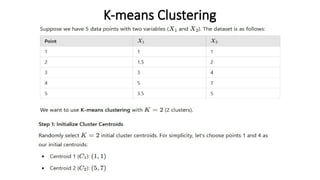
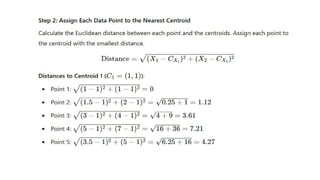
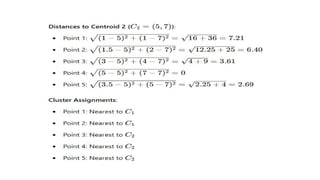
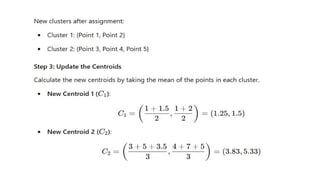
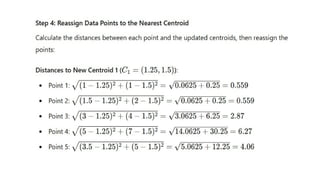
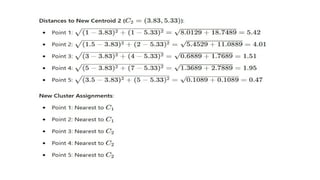
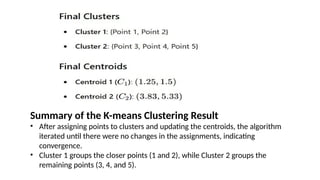
• Multivariate analysis is a statistical technique used to understand
relationships between multiple variables simultaneously. It is
commonly applied in data analytics to extract insights, identify
patterns, and make informed decisions based on complex data. Here’s
an overview of multivariate analysis methods, their applications, and
how they can be used in data analytics:
Principal Component Analysis (PCA):
• Purpose: Reduce dimensionality while retaining most of the variance.
• Use Case: Useful when dealing with high-dimensional datasets, such
as image data or gene expression data.
• Process: It transforms original variables into a new set of uncorrelated
variables (principal components) ordered by the amount of original
variance they explain.
Suppose we have a dataset with 5 observations (samples) and 2
variables (X1​and X2​
). The dataset is as follows:
Summary of the PCA Result
• The first principal component (PC1text{PC}_1PC1​
) explains most of the variance (1.98
out of a total variance of 2).
• The original 2-dimensional data is reduced to 1 dimension along PC1text{PC}_1PC1​
.
• This process helps to simplify the data while retaining the relationships between the
variables.
Cluster Analysis
• Purpose: Group observations into clusters that have similar
characteristics.
• Use Case: Segmentation of customers in marketing, grouping patients
with similar symptoms in healthcare.
• Techniques: K-means, hierarchical clustering, DBSCAN, etc.
K-means Clustering
Summary of the K-means Clustering Result
• After assigning points to clusters and updating the centroids, the algorithm
iterated until there were no changes in the assignments, indicating
convergence.
• Cluster 1 groups the closer points (1 and 2), while Cluster 2 groups the
remaining points (3, 4, and 5).
Multivariate analysis.pptx27288sjhshshshshjsjs

Multivariate analysis.pptx27288sjhshshshshjsjs

  • 1.
  • 2.
    • Multivariate analysisis a statistical technique used to understand relationships between multiple variables simultaneously. It is commonly applied in data analytics to extract insights, identify patterns, and make informed decisions based on complex data. Here’s an overview of multivariate analysis methods, their applications, and how they can be used in data analytics:
  • 3.
    Principal Component Analysis(PCA): • Purpose: Reduce dimensionality while retaining most of the variance. • Use Case: Useful when dealing with high-dimensional datasets, such as image data or gene expression data. • Process: It transforms original variables into a new set of uncorrelated variables (principal components) ordered by the amount of original variance they explain.
  • 4.
    Suppose we havea dataset with 5 observations (samples) and 2 variables (X1​and X2​ ). The dataset is as follows:
  • 9.
    Summary of thePCA Result • The first principal component (PC1text{PC}_1PC1​ ) explains most of the variance (1.98 out of a total variance of 2). • The original 2-dimensional data is reduced to 1 dimension along PC1text{PC}_1PC1​ . • This process helps to simplify the data while retaining the relationships between the variables.
  • 10.
    Cluster Analysis • Purpose:Group observations into clusters that have similar characteristics. • Use Case: Segmentation of customers in marketing, grouping patients with similar symptoms in healthcare. • Techniques: K-means, hierarchical clustering, DBSCAN, etc.
  • 11.
  • 17.
    Summary of theK-means Clustering Result • After assigning points to clusters and updating the centroids, the algorithm iterated until there were no changes in the assignments, indicating convergence. • Cluster 1 groups the closer points (1 and 2), while Cluster 2 groups the remaining points (3, 4, and 5).