Download as PDF, PPTX


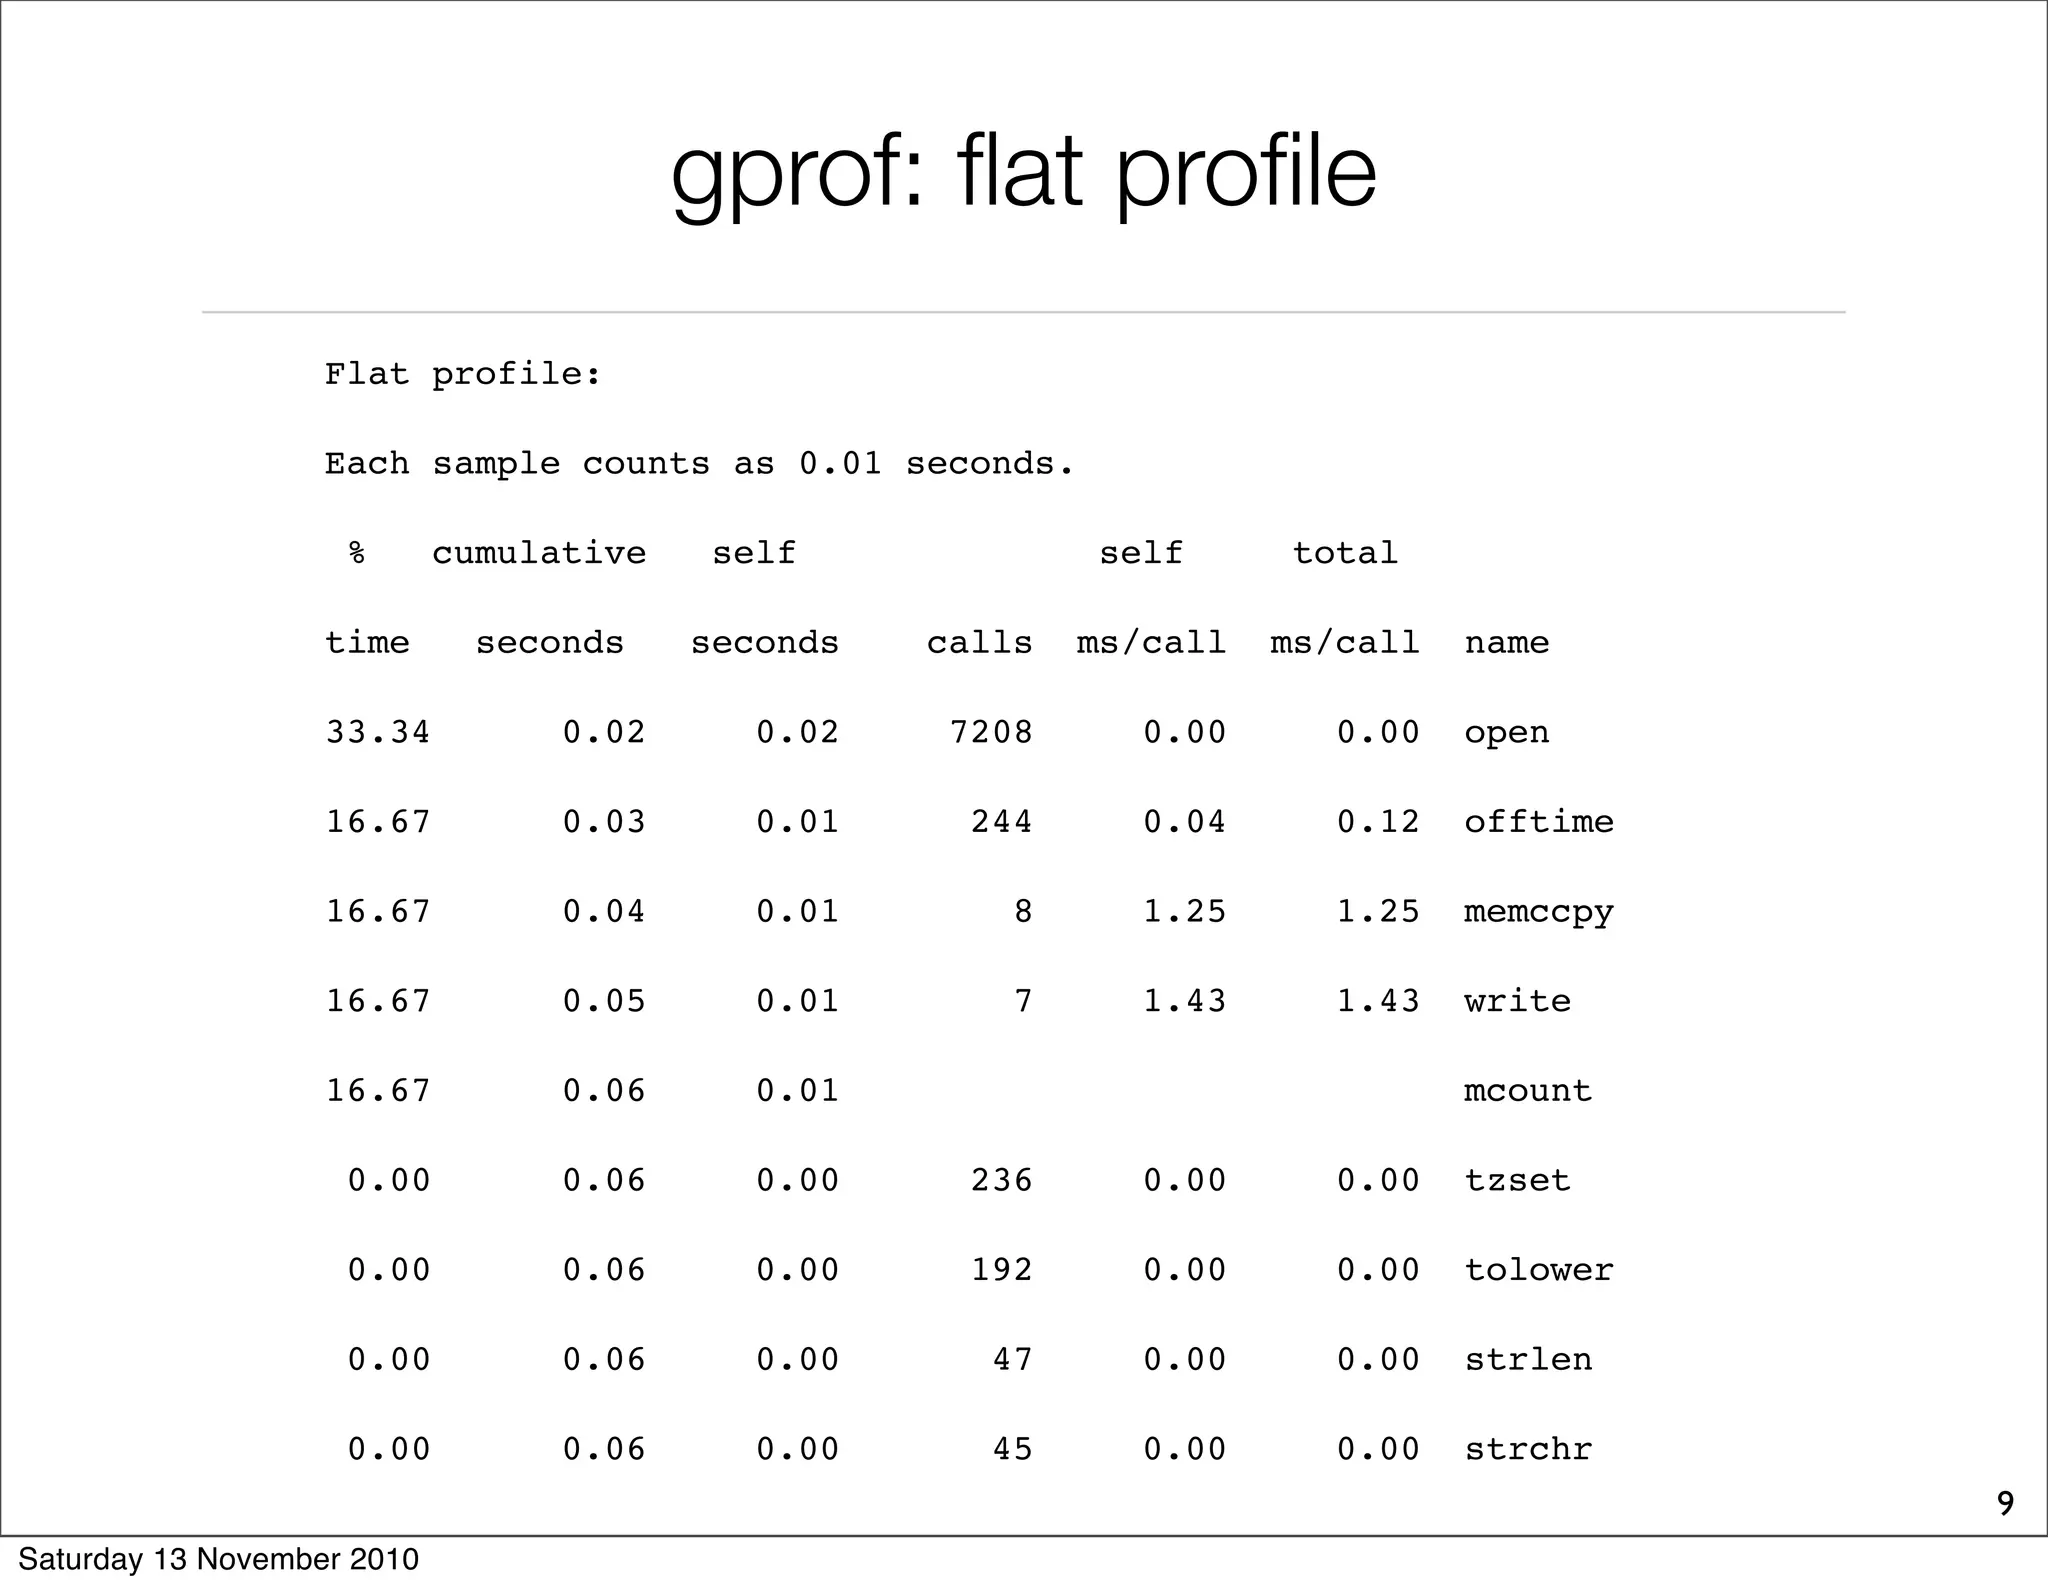
![gprof: call graph (~1984)
index % time self children called name
<spontaneous>
[1] 100.0 0.00 0.05 start [1]
0.00 0.05 1/1 main [2]
0.00 0.00 1/2 on_exit [28]
0.00 0.00 1/1 exit [59]
-----------------------------------------------
0.00 0.05 1/1 start [1]
[2] 100.0 0.00 0.05 1 main [2]
0.00 0.05 1/1 report [3]
-----------------------------------------------
0.00 0.05 1/1 main [2]
[3] 100.0 0.00 0.05 1 report [3]
0.00 0.03 8/8 timelocal [6]
0.00 0.01 1/1 print [9]
0.00 0.01 9/9 fgets [12]
0.00 0.00 12/34 strncmp <cycle 1> [40]
0.00 0.00 8/8 lookup [20]
0.00 0.00 1/1 fopen [21]
0.00 0.00 8/8 chewtime [24]
0.00 0.00 8/16 skipspace [44]
-----------------------------------------------
[4] 59.8 0.01 0.02 8+472 <cycle 2 as a whole>! [4]
0.01 0.02 244+260 offtime <cycle 2> [7]
0.00 0.00 236+1 tzset <cycle 2> [26]
-----------------------------------------------
10
Saturday 13 November 2010](https://image.slidesharecdn.com/2010-profilingobjects-101113133636-phpapp02/75/Multi-dimensional-profiling-10-2048.jpg)
![Polymetric view can map up to 5
dimensions
width property
height
property
color
property
X property
Y
property
18
[Lanza 2003]
Saturday 13 November 2010](https://image.slidesharecdn.com/2010-profilingobjects-101113133636-phpapp02/75/Multi-dimensional-profiling-18-2048.jpg)
![19
KaiProfiler
viewProfiling: [
| view |
! view := MOViewRenderer new.
! view
nodes: (1 to: 100)
forEach: [:each |
view nodes: (1 to: 100)].
! view root applyLayout
! ]
Saturday 13 November 2010](https://image.slidesharecdn.com/2010-profilingobjects-101113133636-phpapp02/75/Multi-dimensional-profiling-19-2048.jpg)
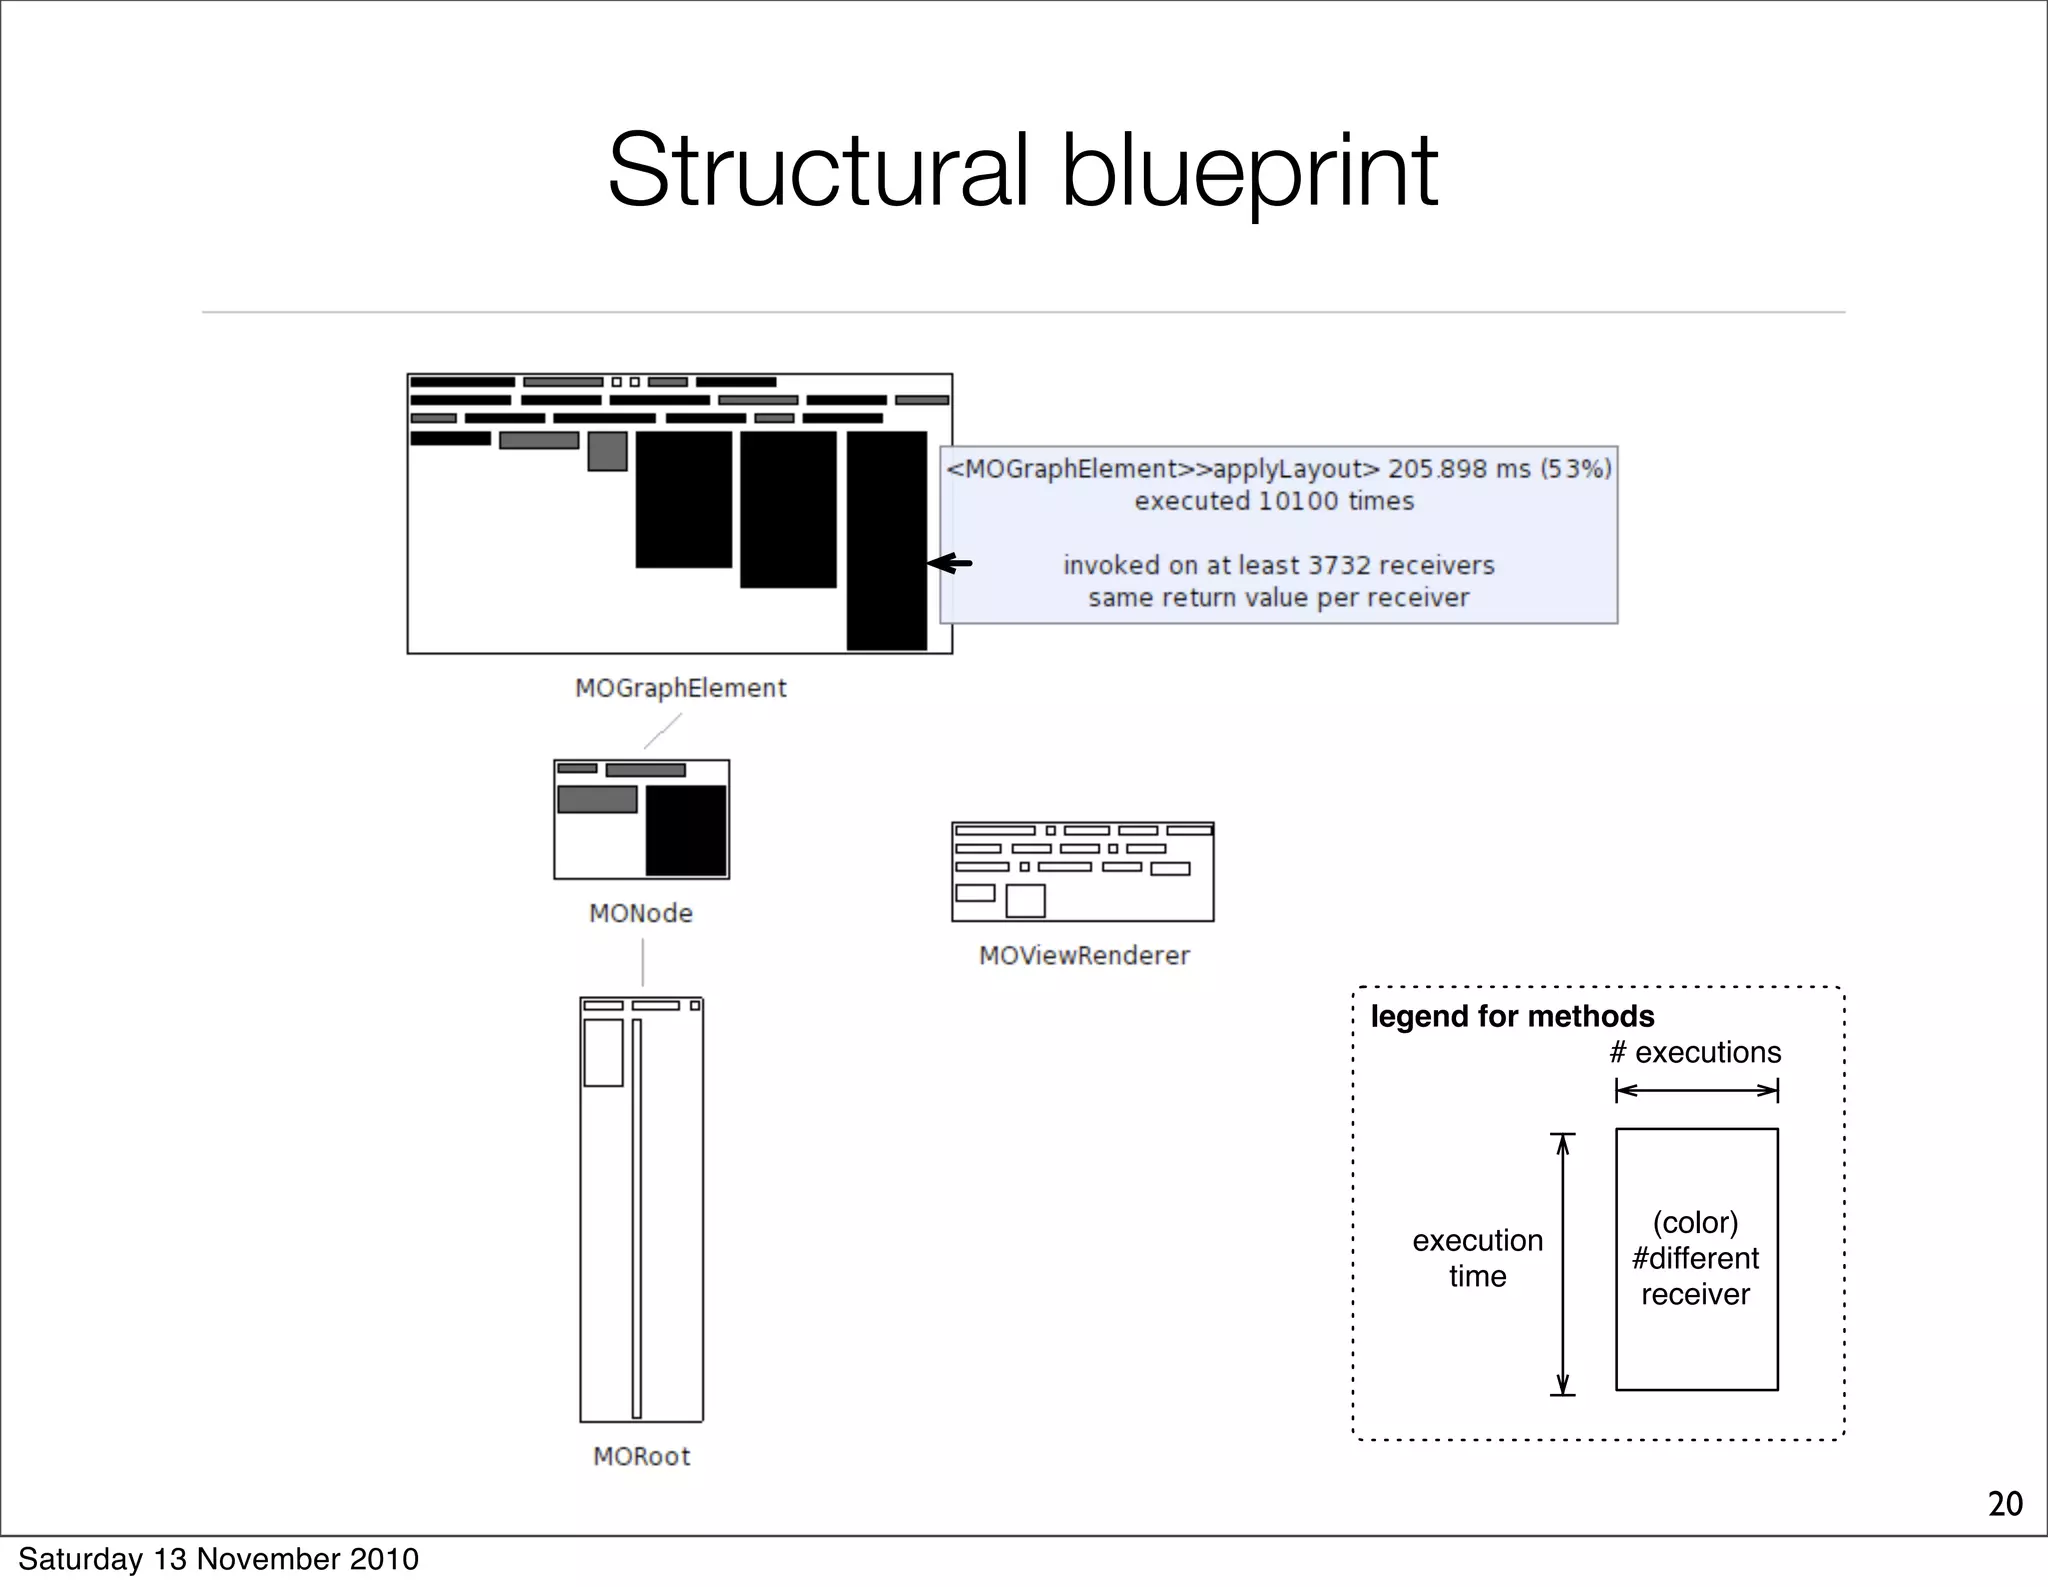
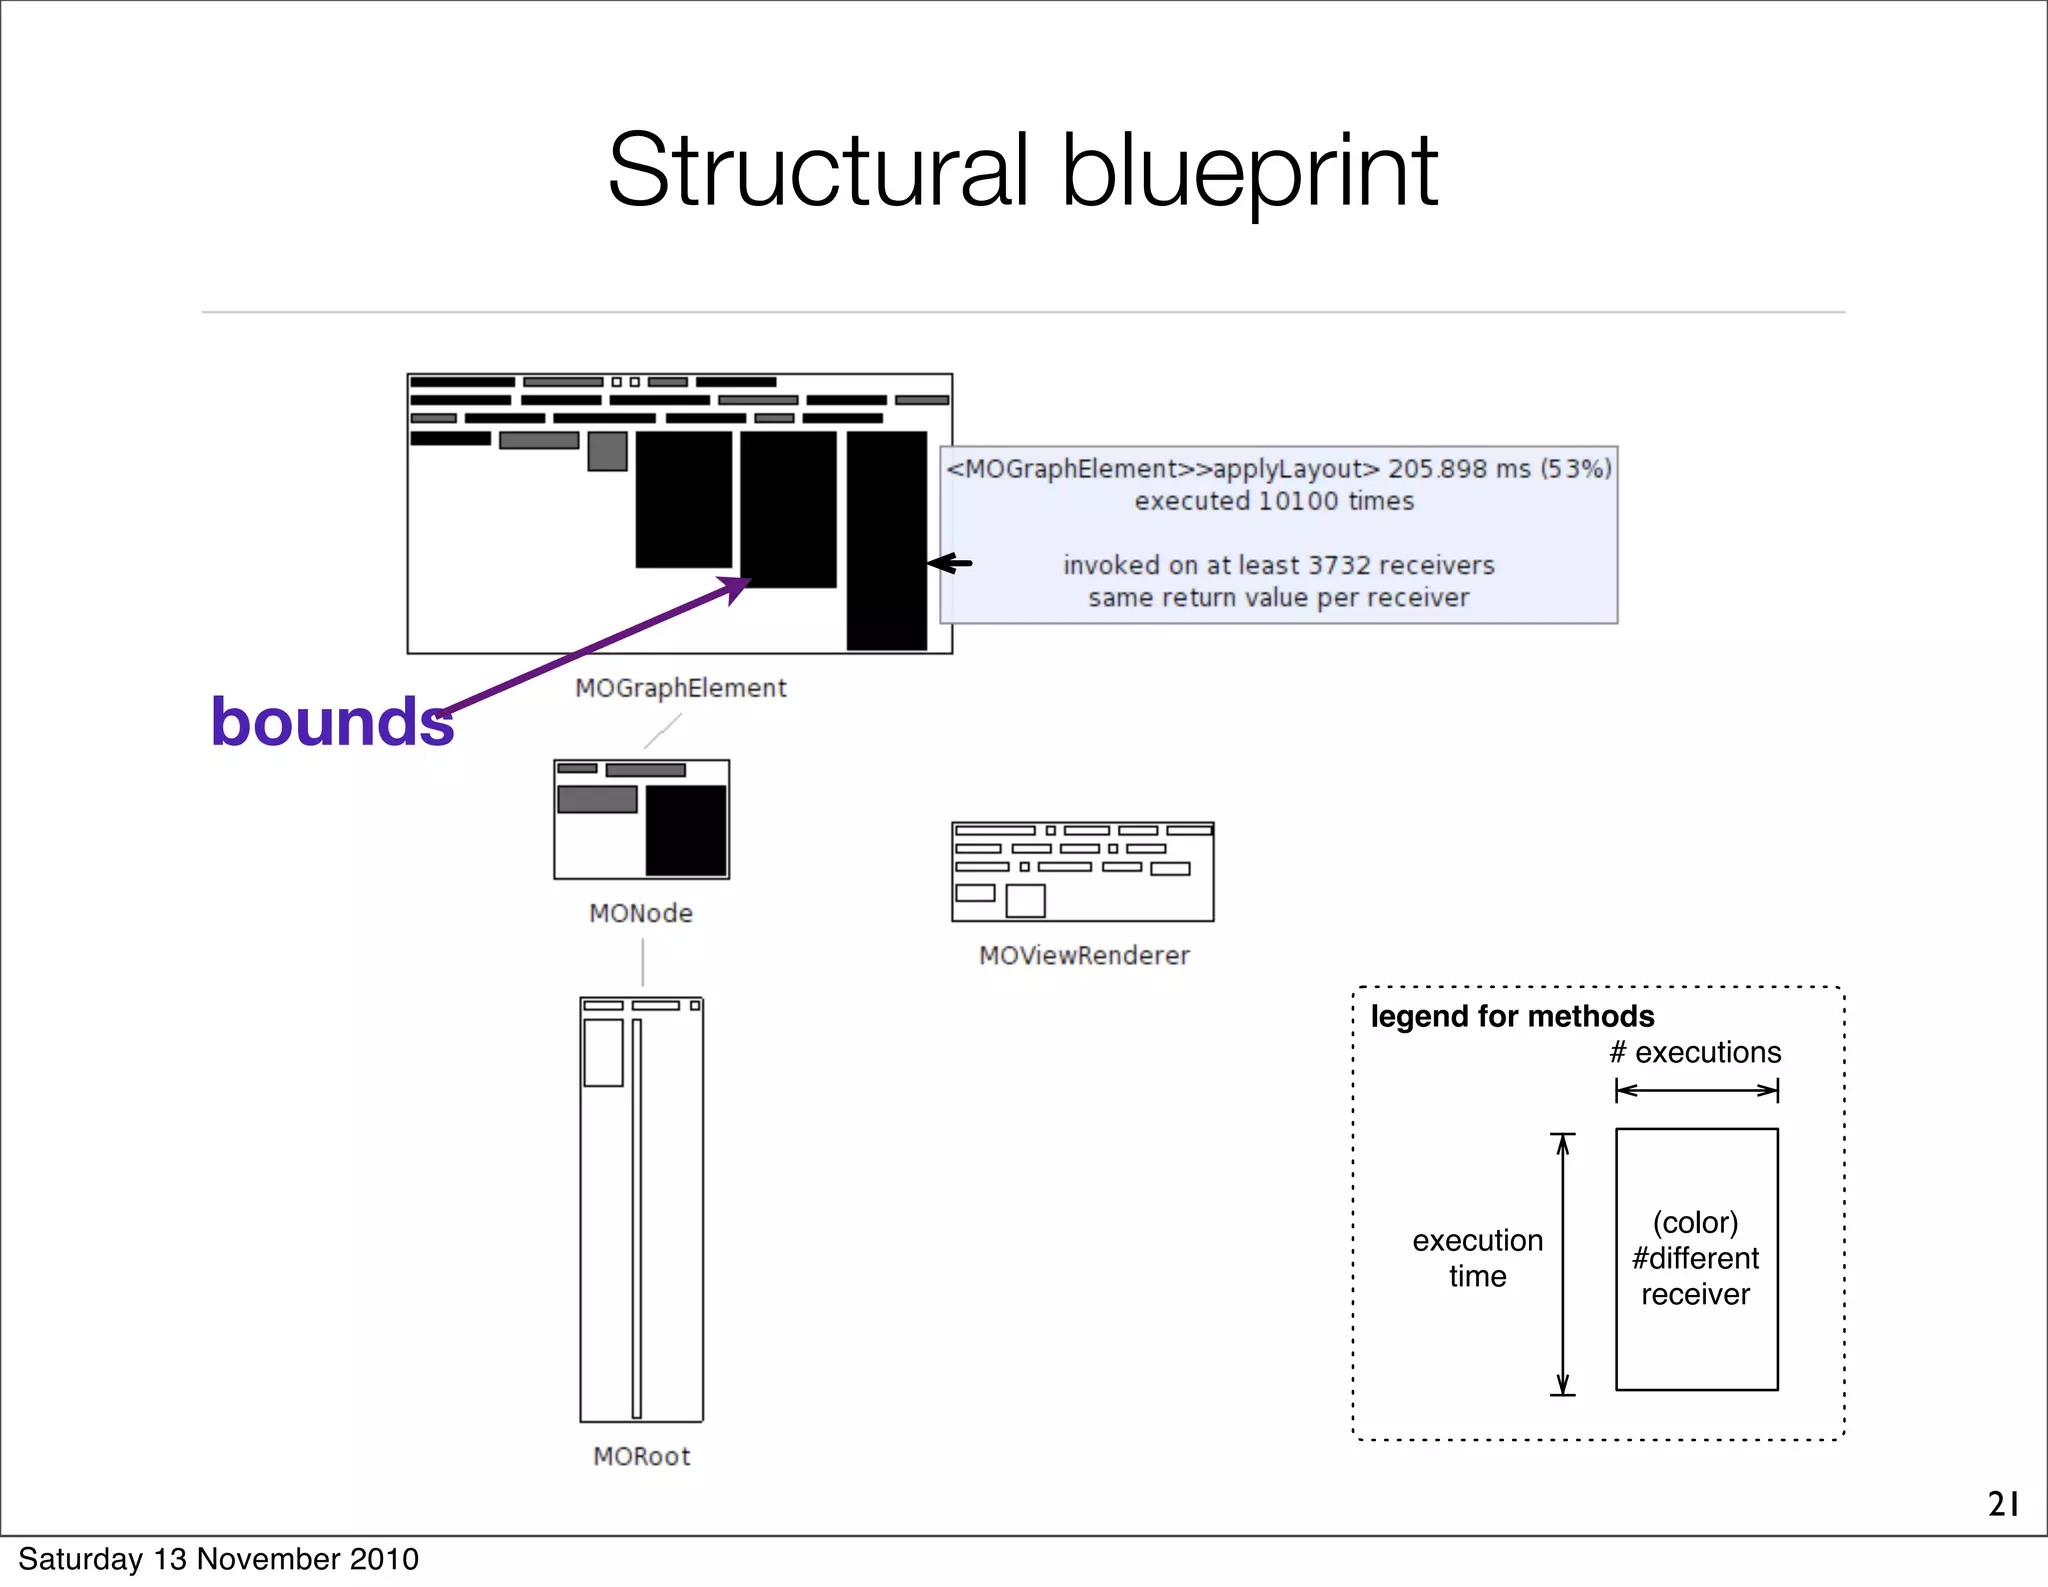
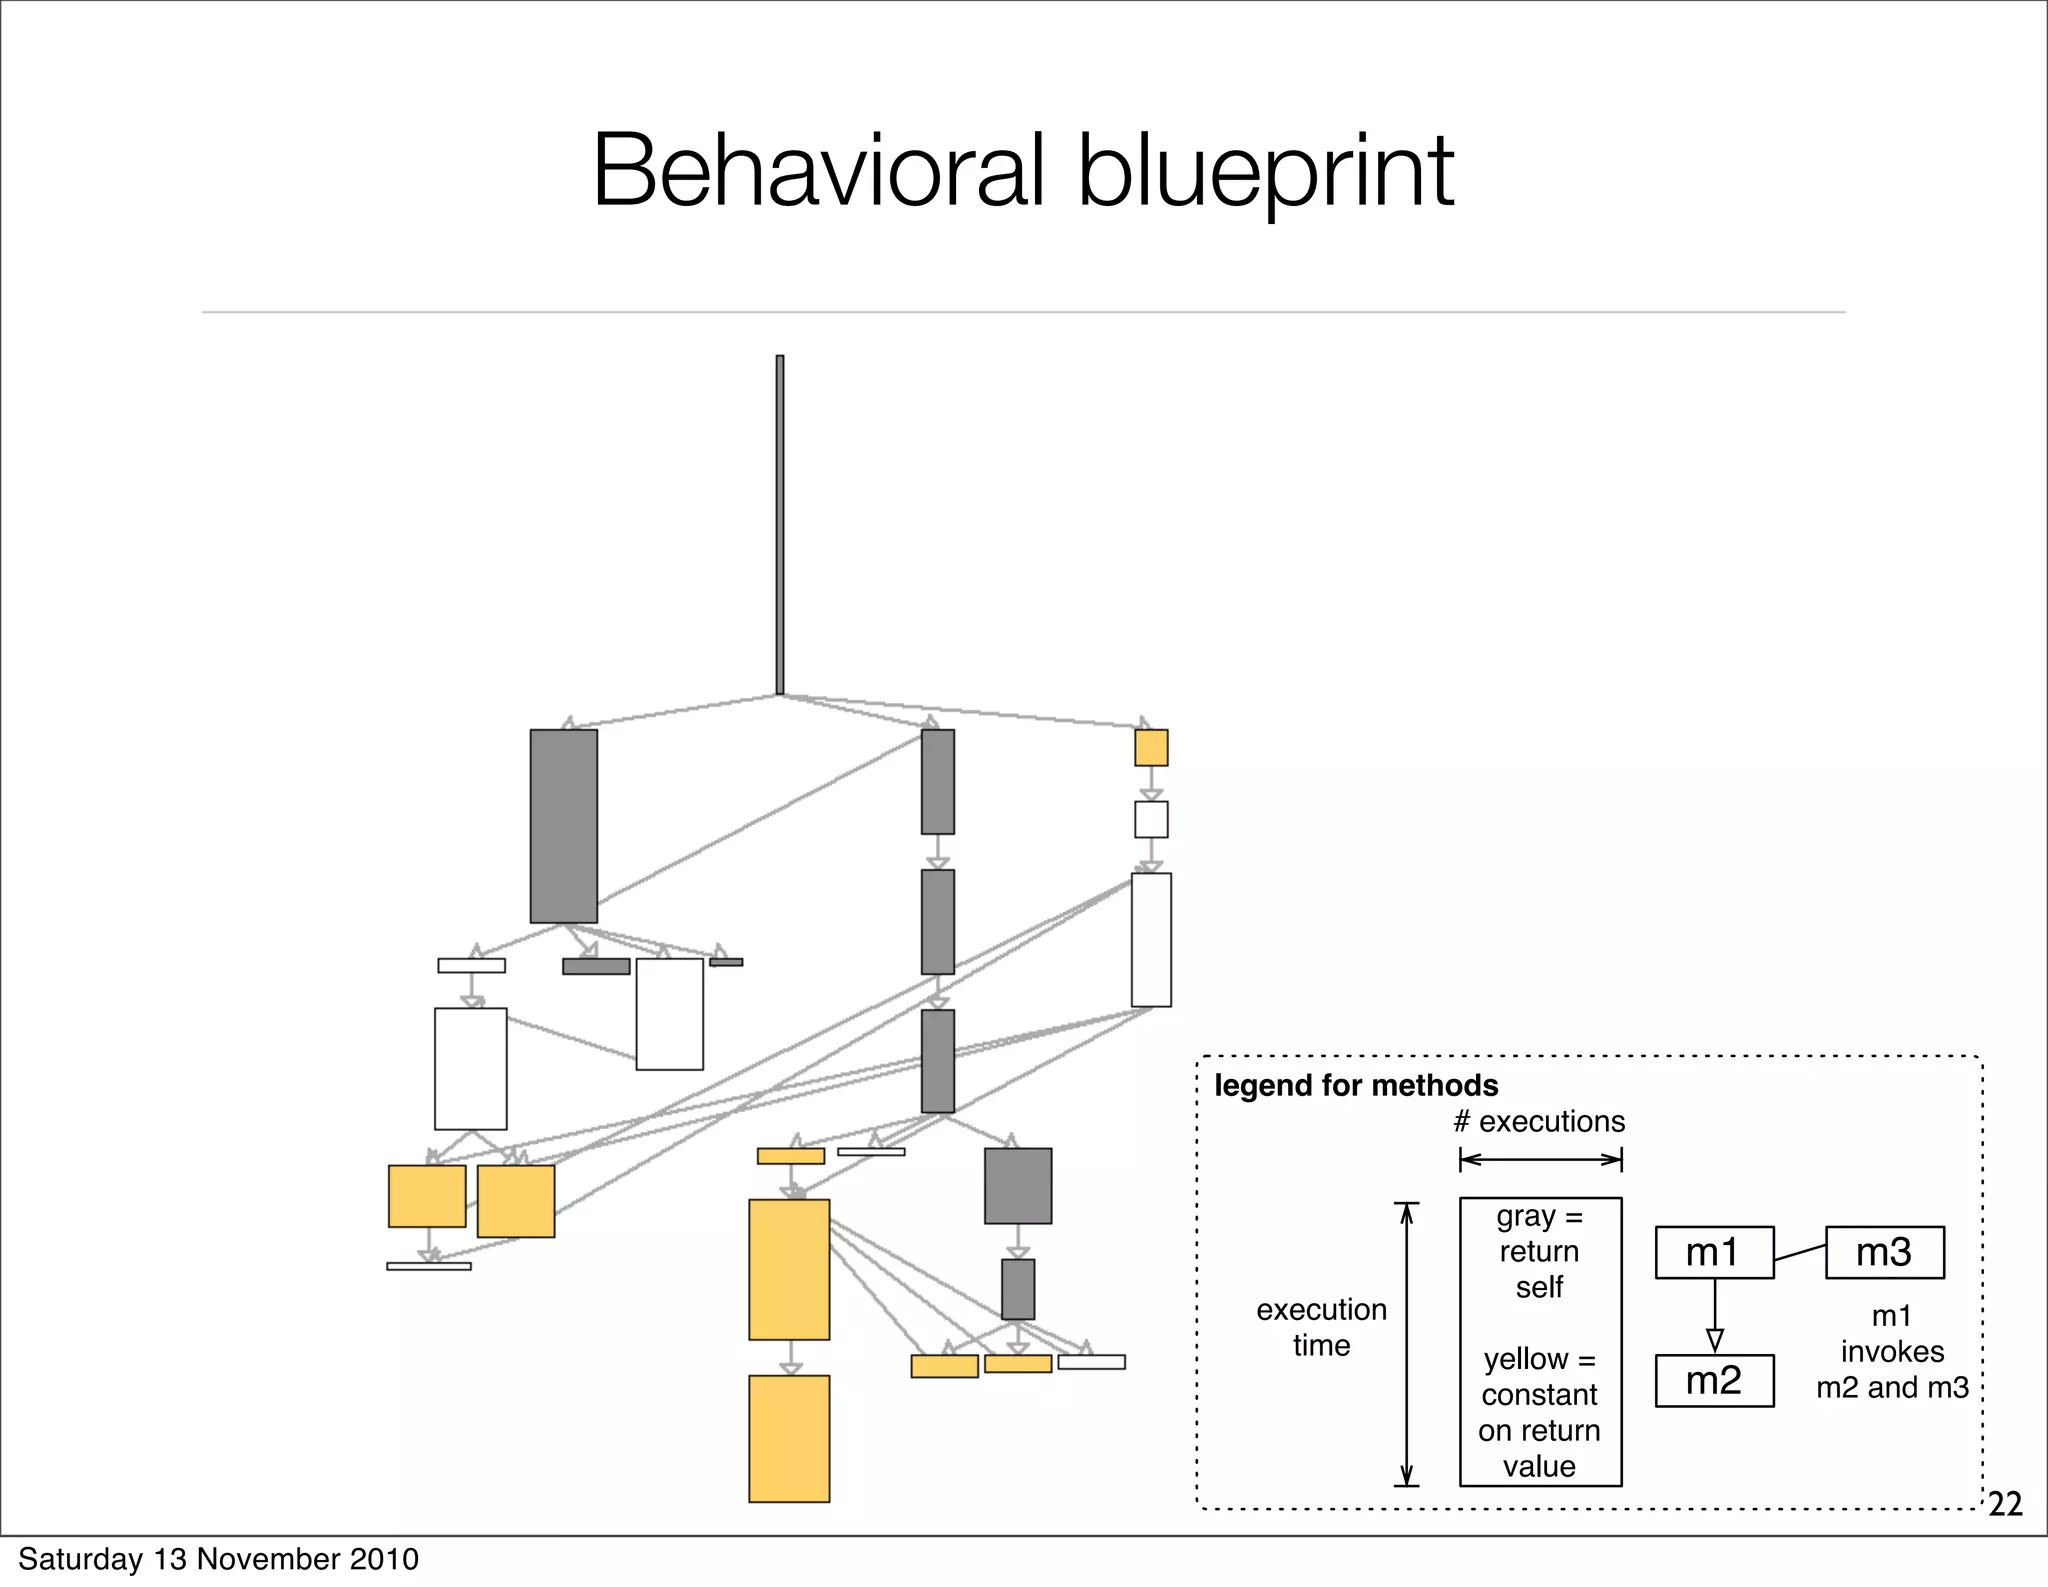
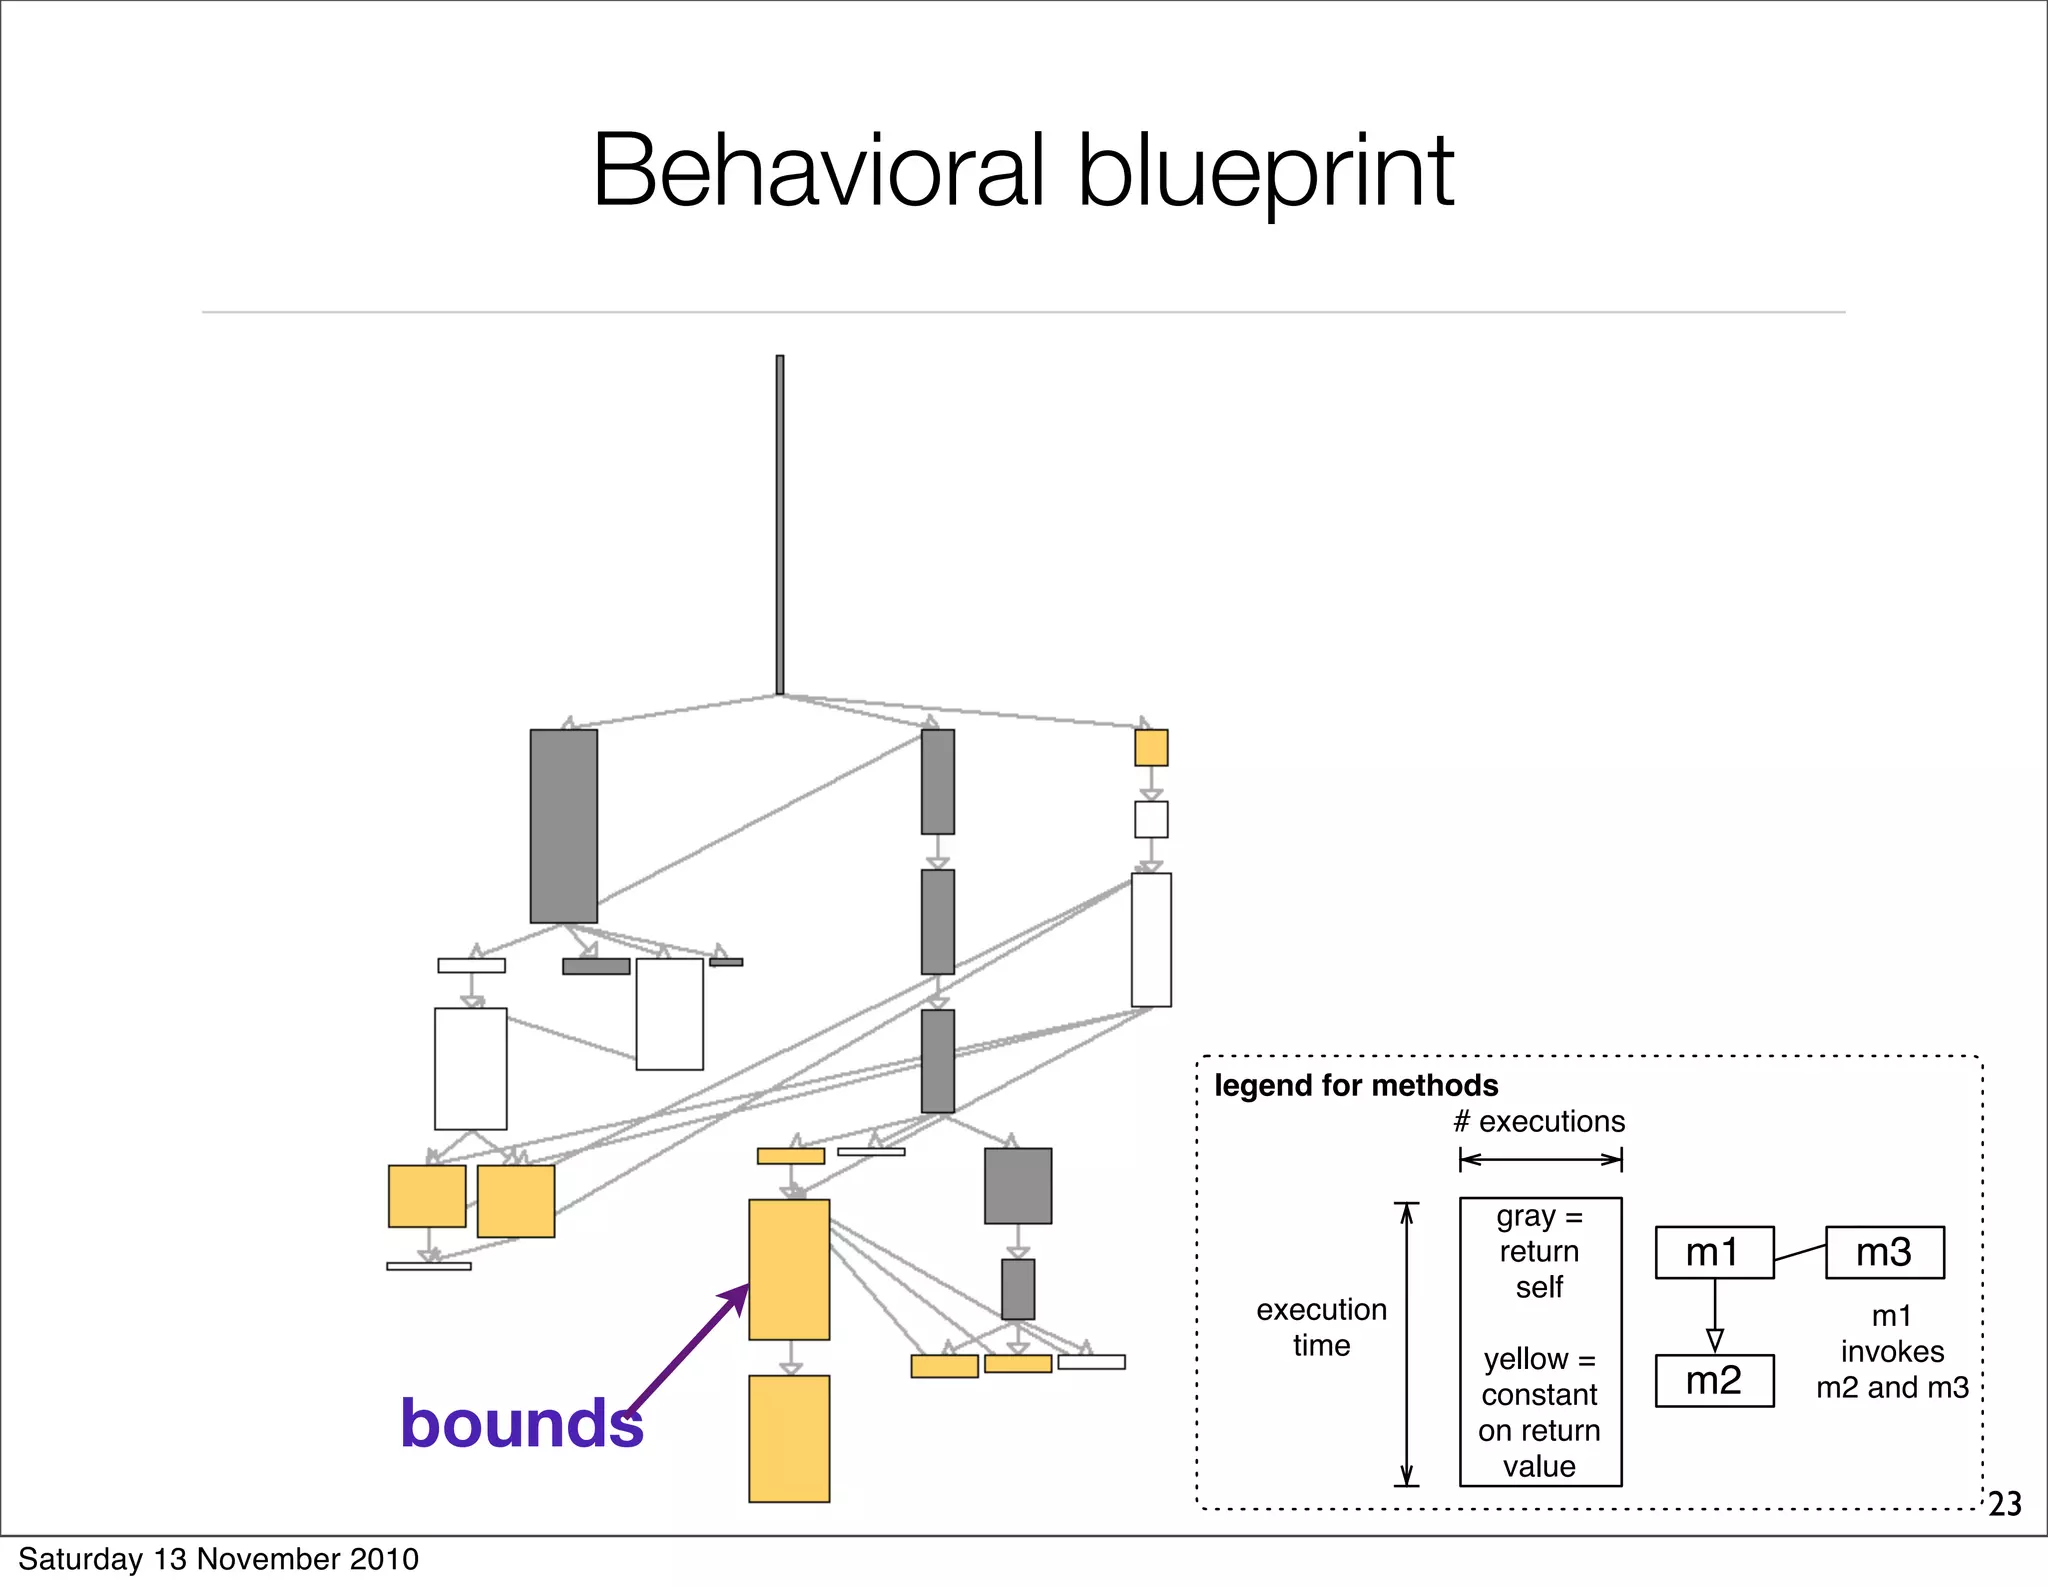
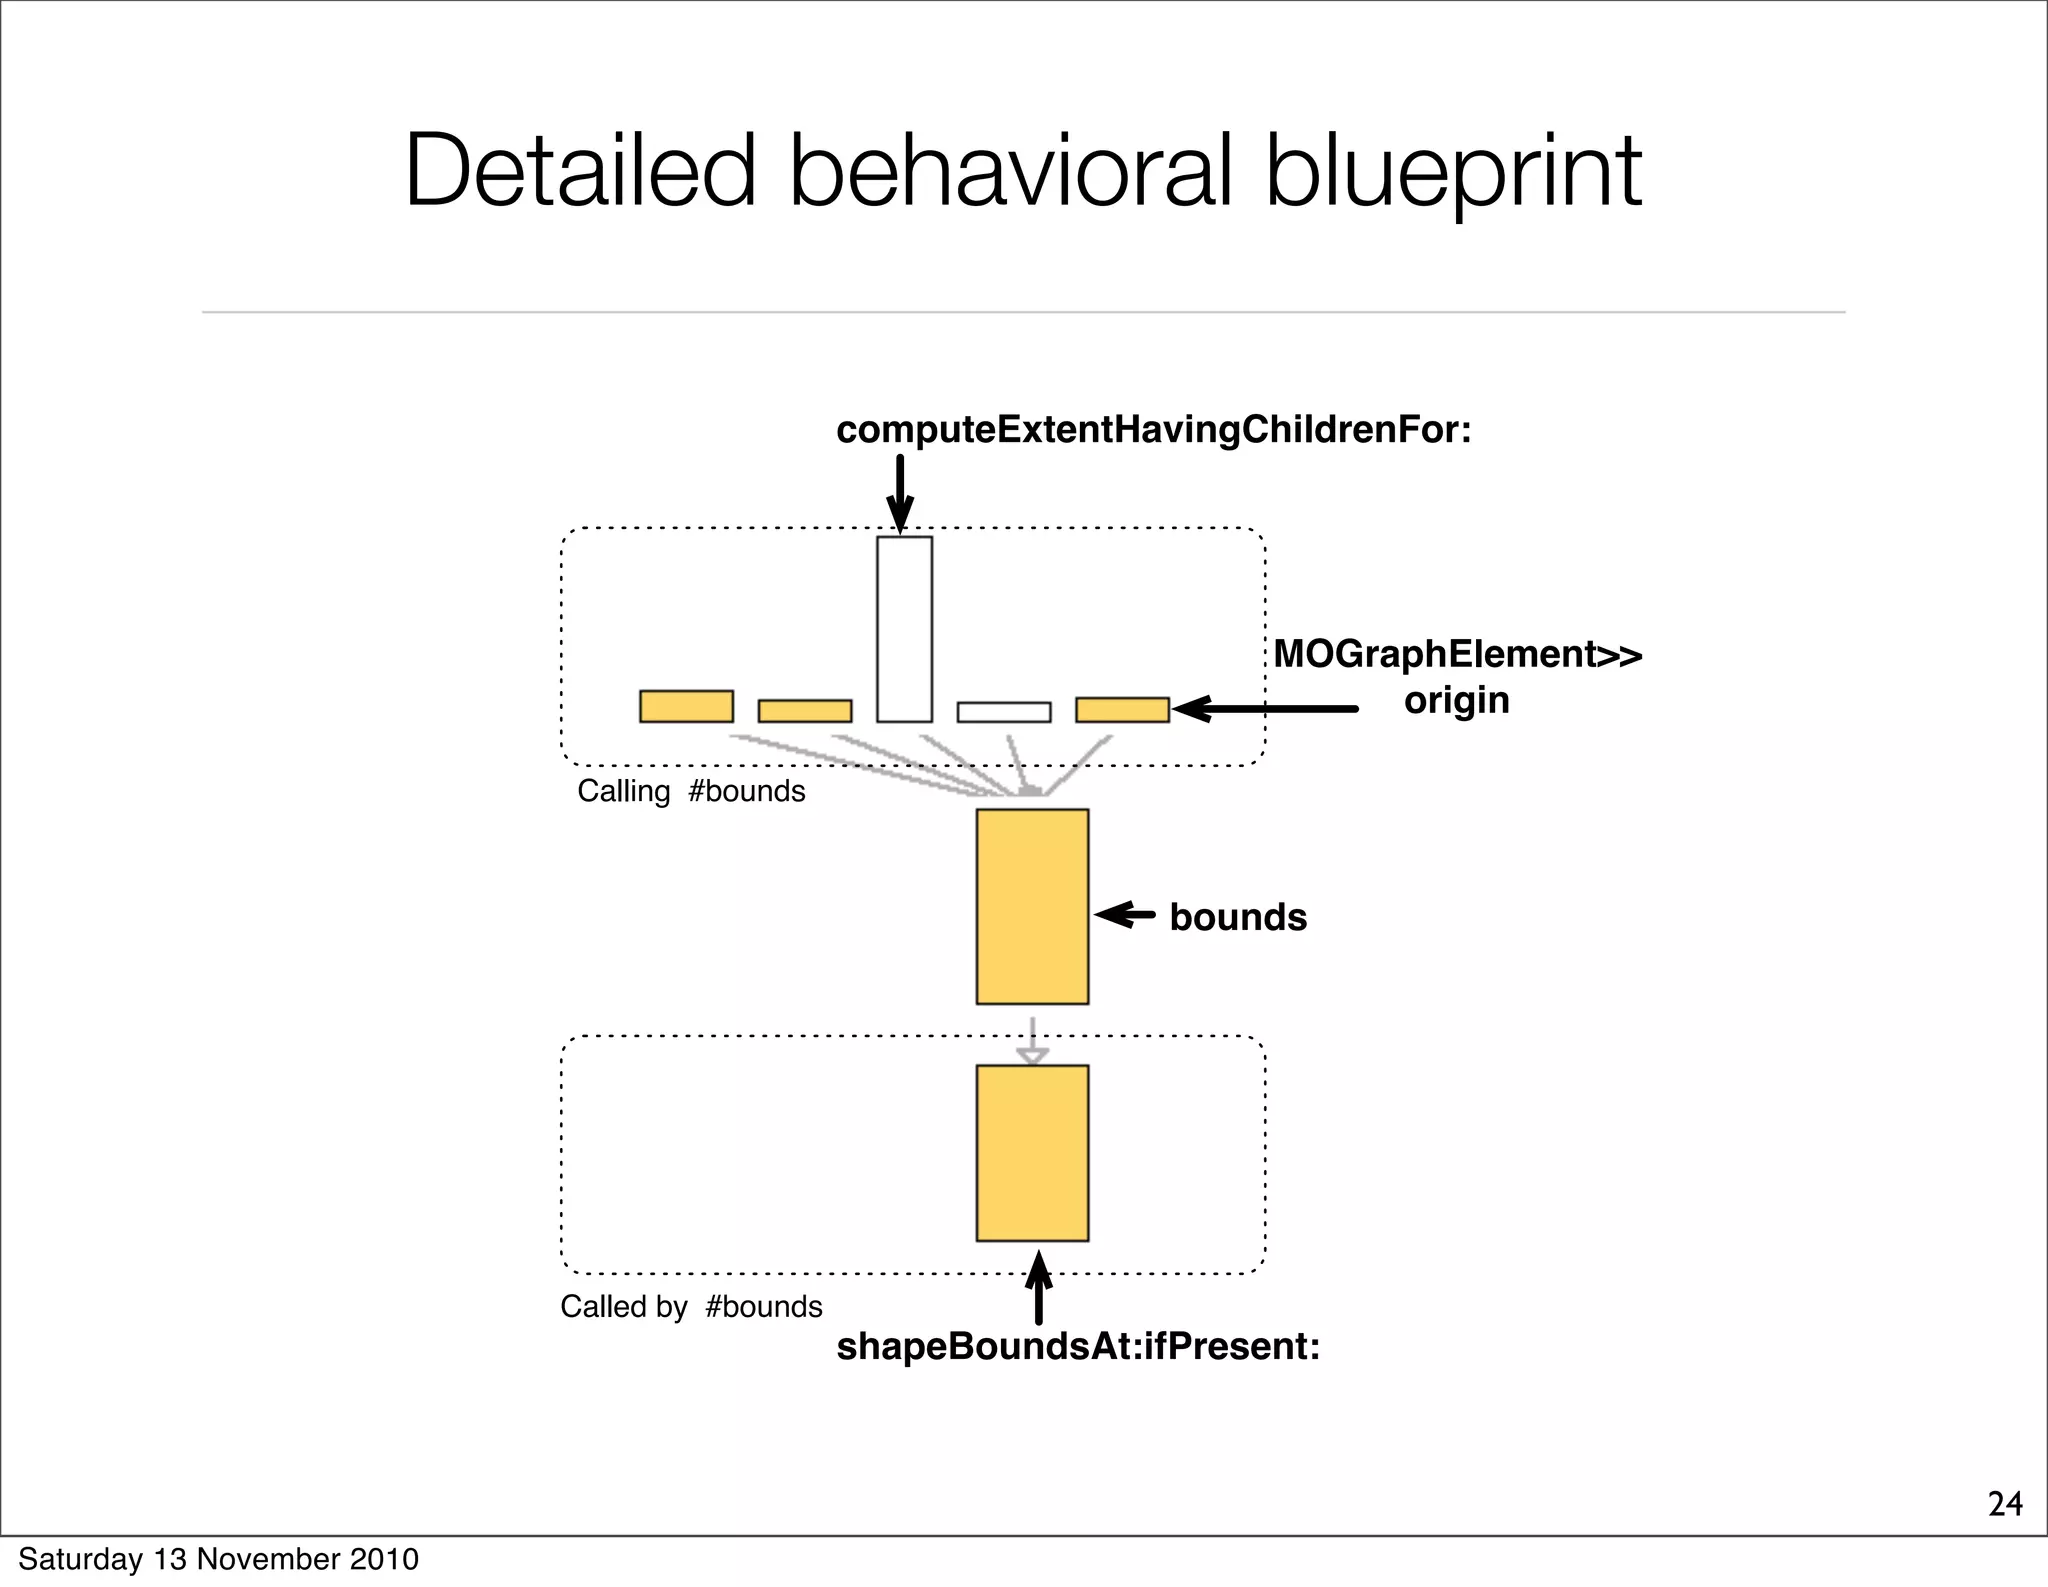
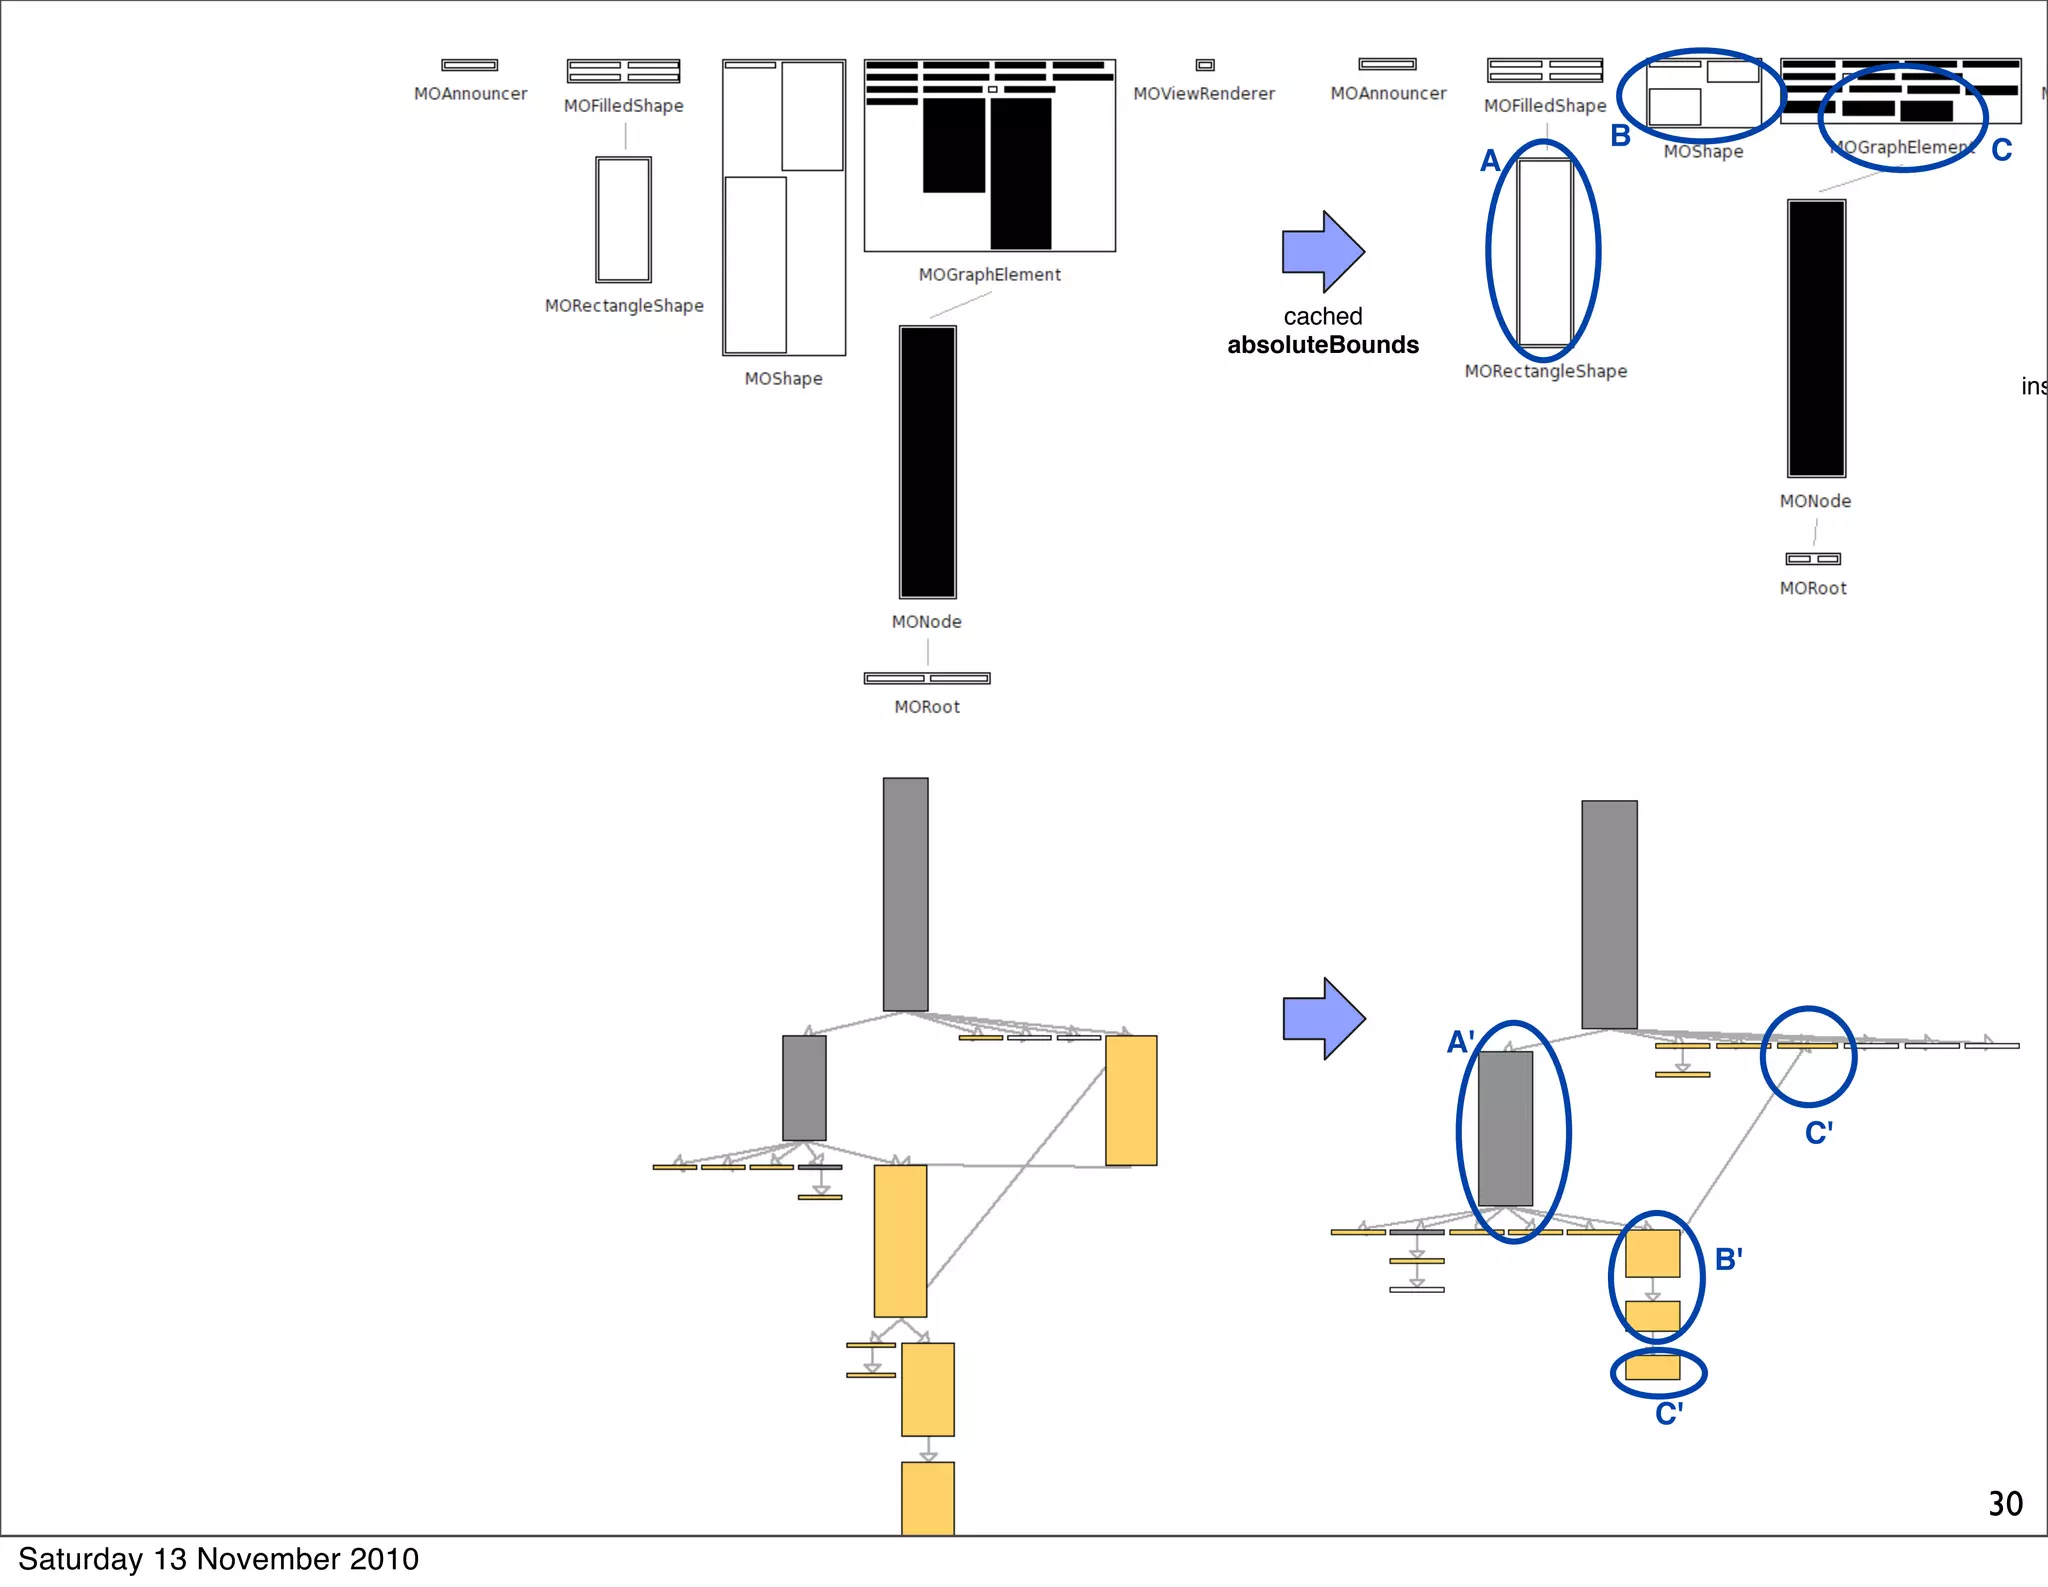
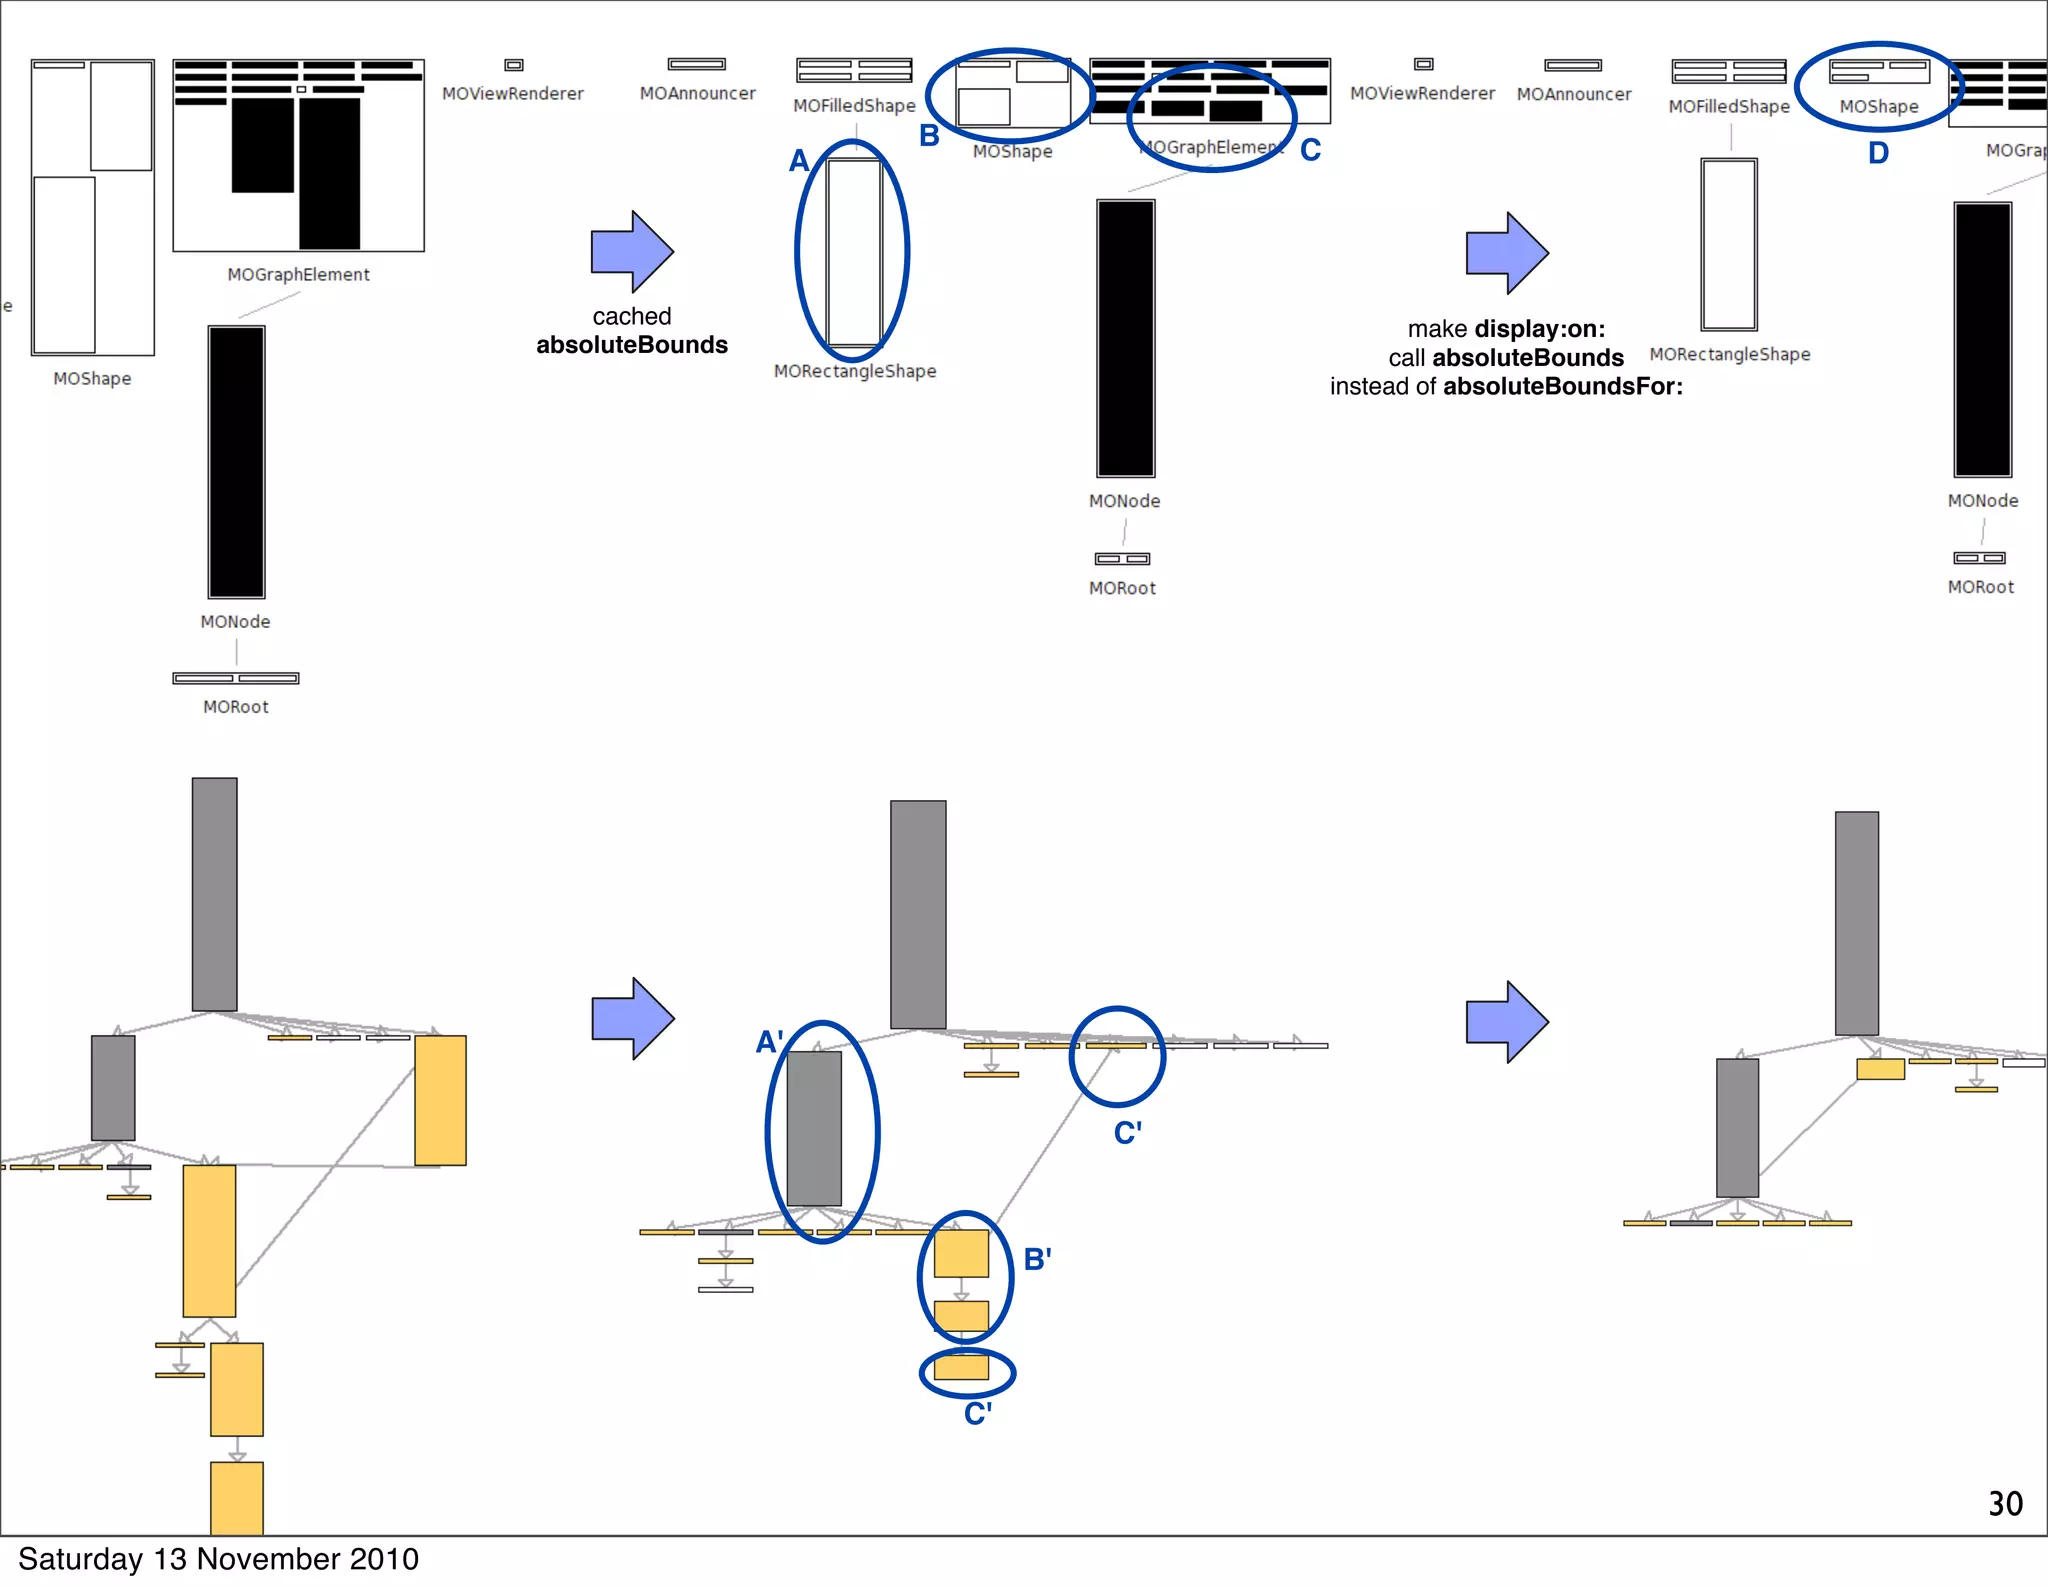
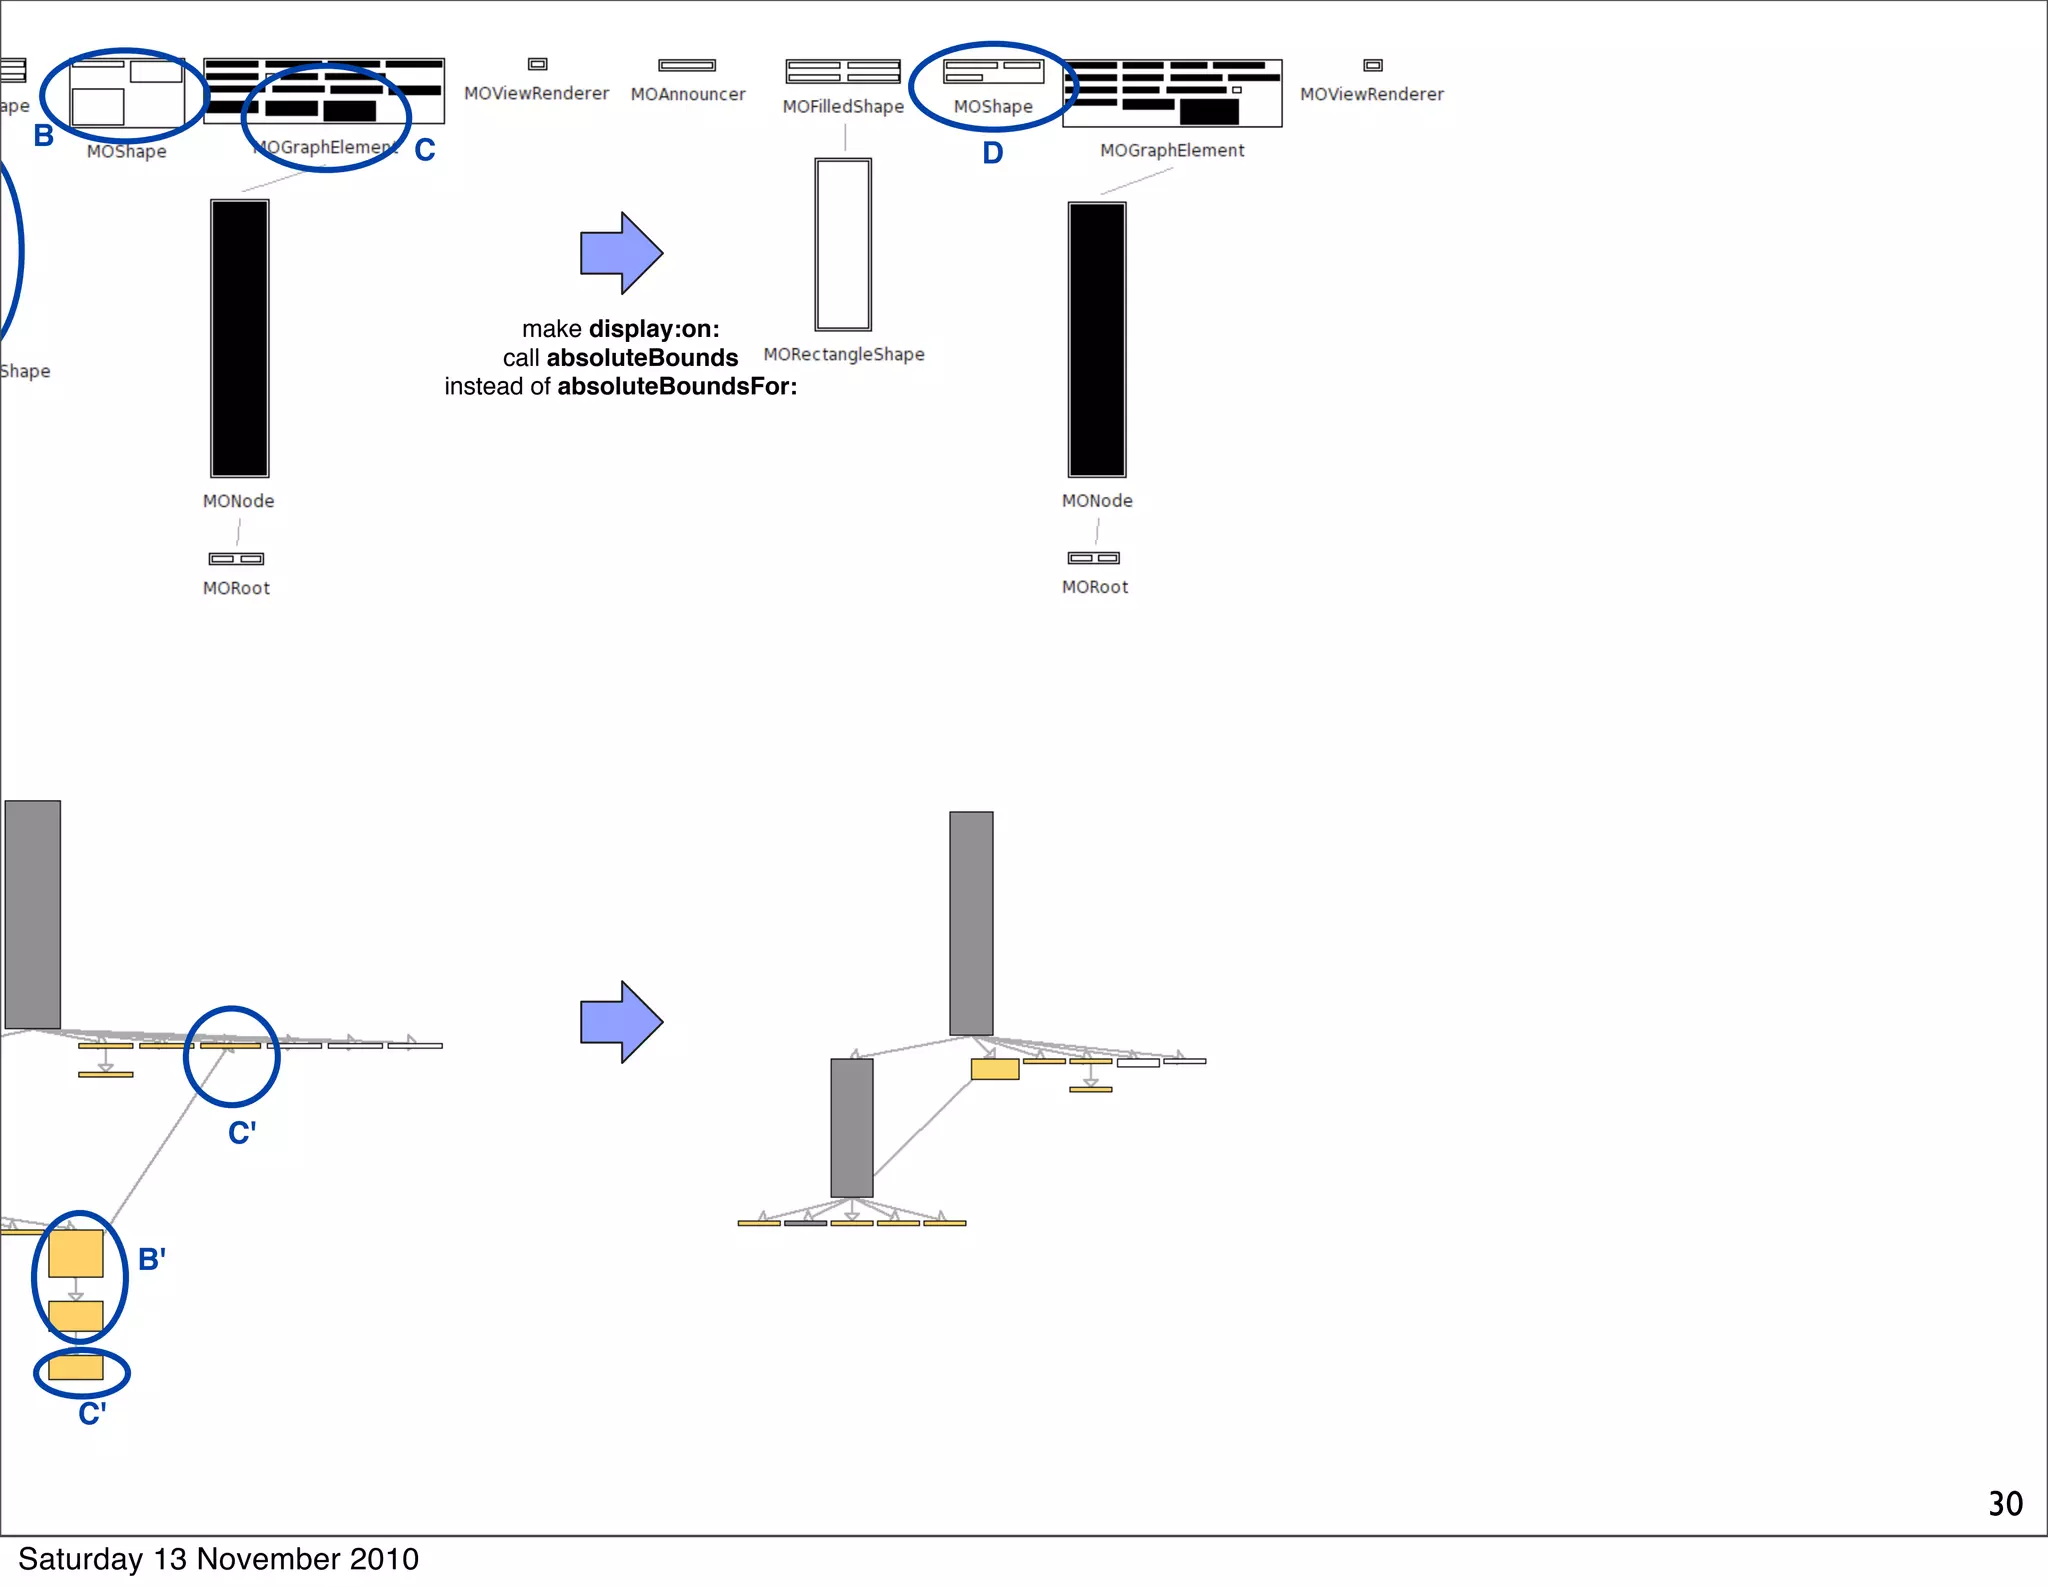
![Code of the bounds method
MOGraphElement>>bounds
"Answer the bounds of the receiver."
| basicBounds |
self shapeBoundsAt: self shape ifPresent: [ :b | ^ b ].
basicBounds := shape computeBoundsFor: self.
self shapeBoundsAt: self shape put: basicBounds.
^ basicBounds
25
Saturday 13 November 2010](https://image.slidesharecdn.com/2010-profilingobjects-101113133636-phpapp02/75/Multi-dimensional-profiling-25-2048.jpg)
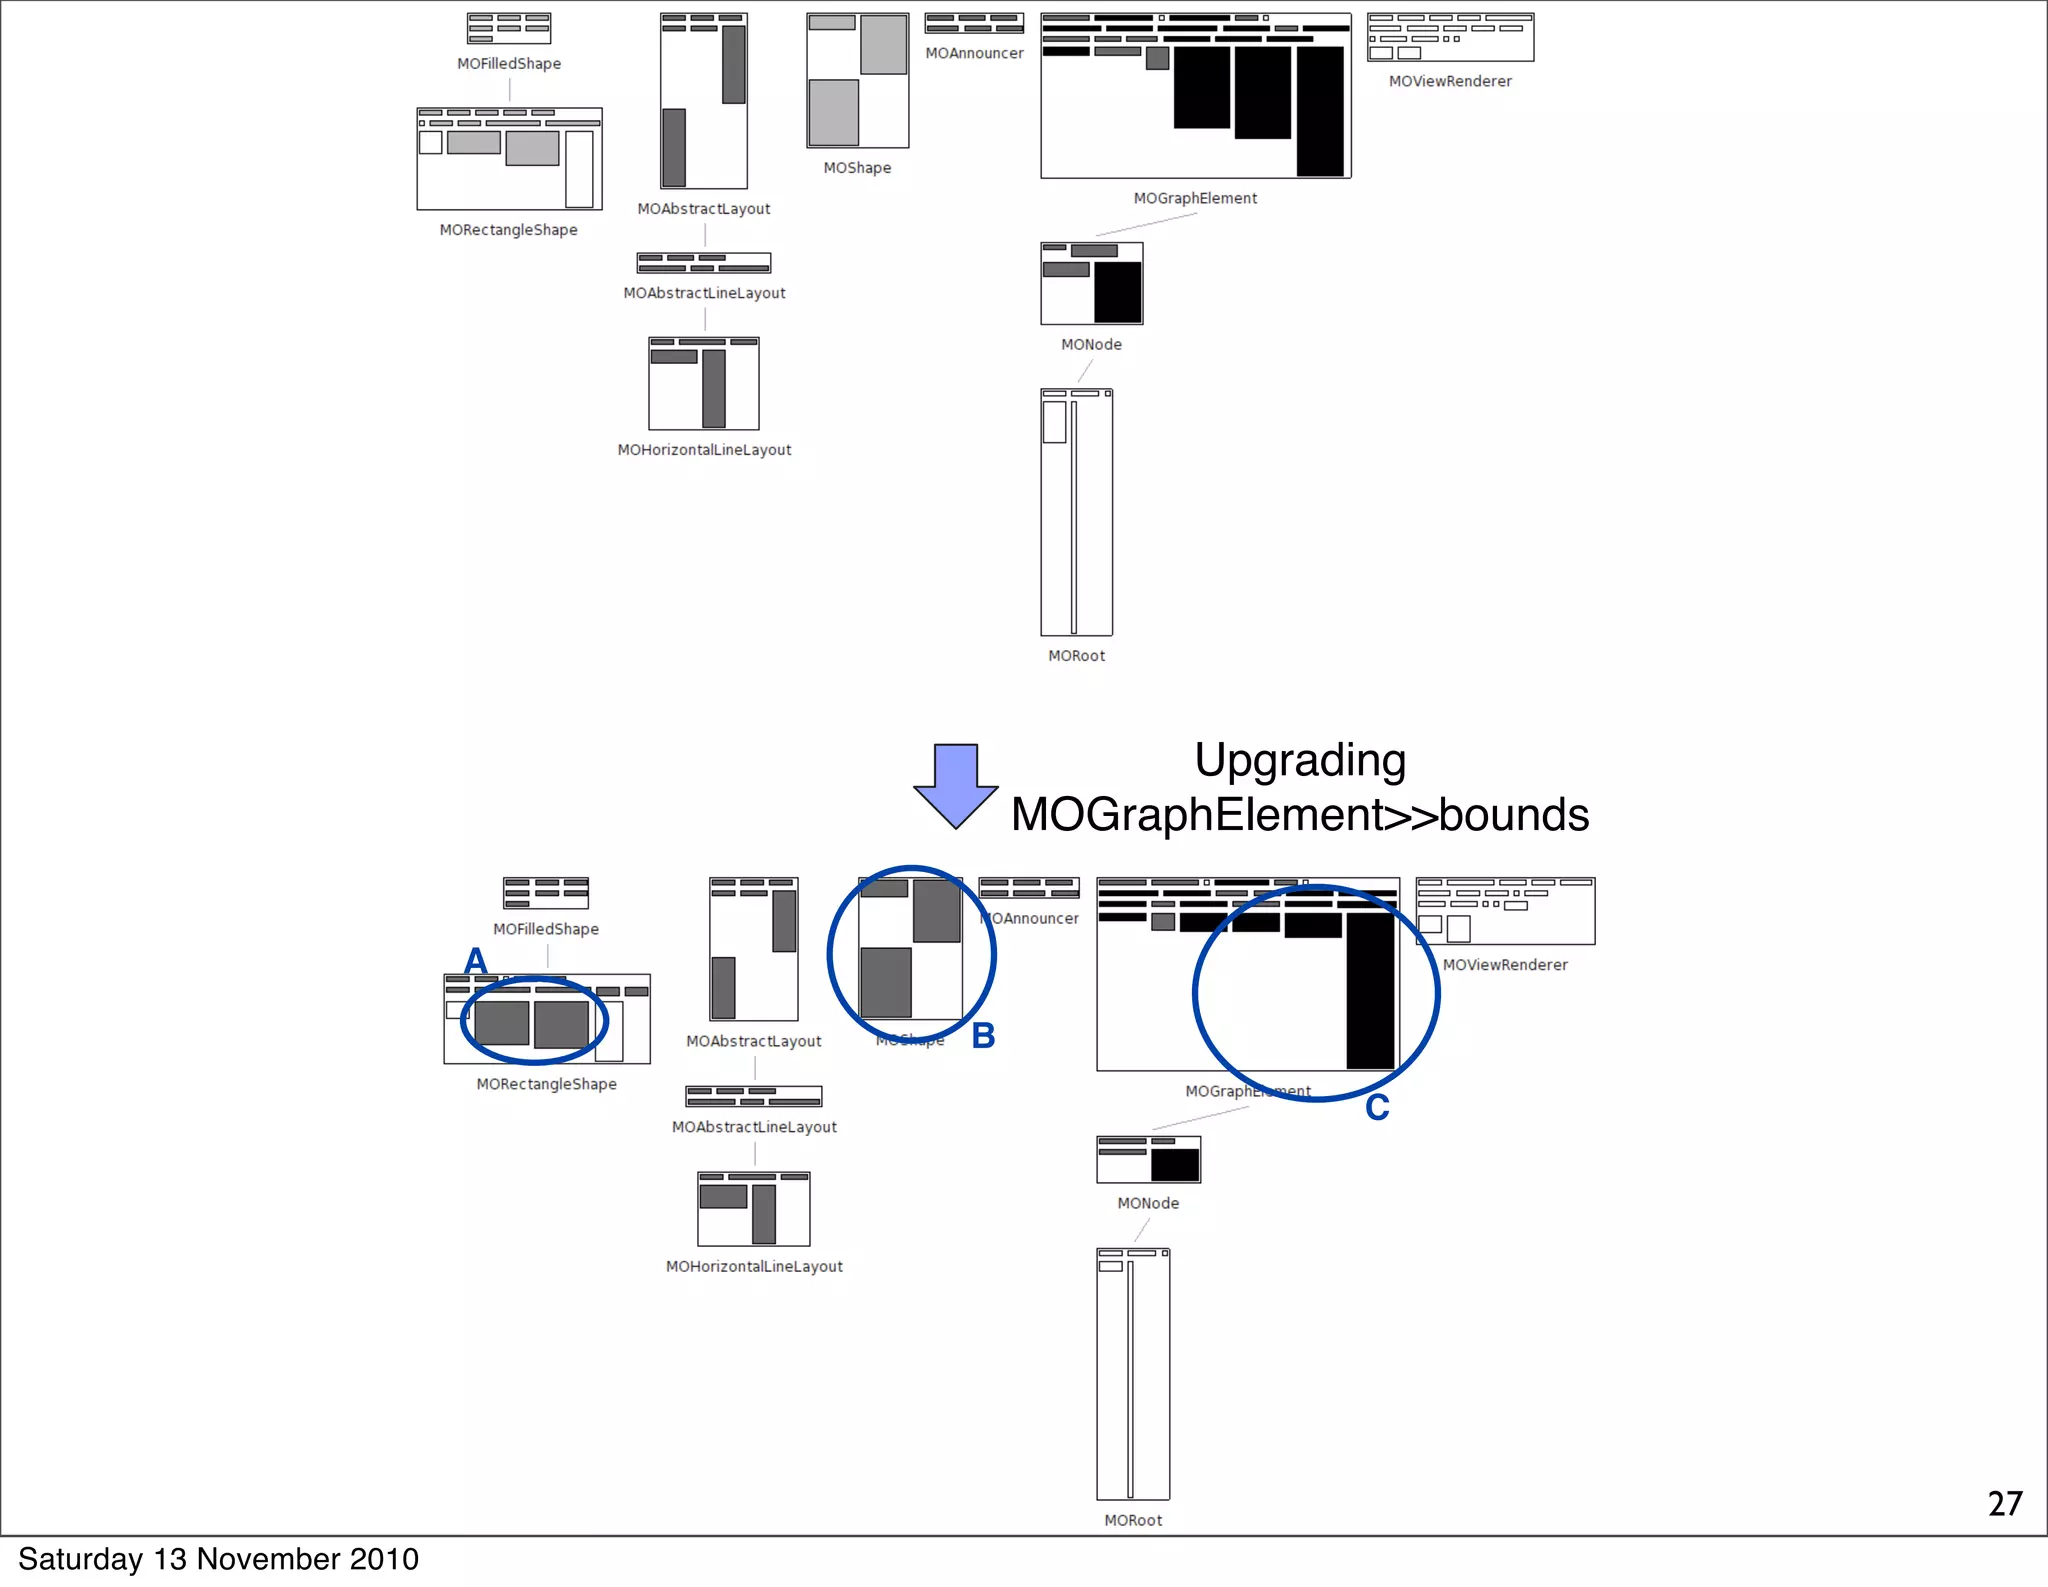
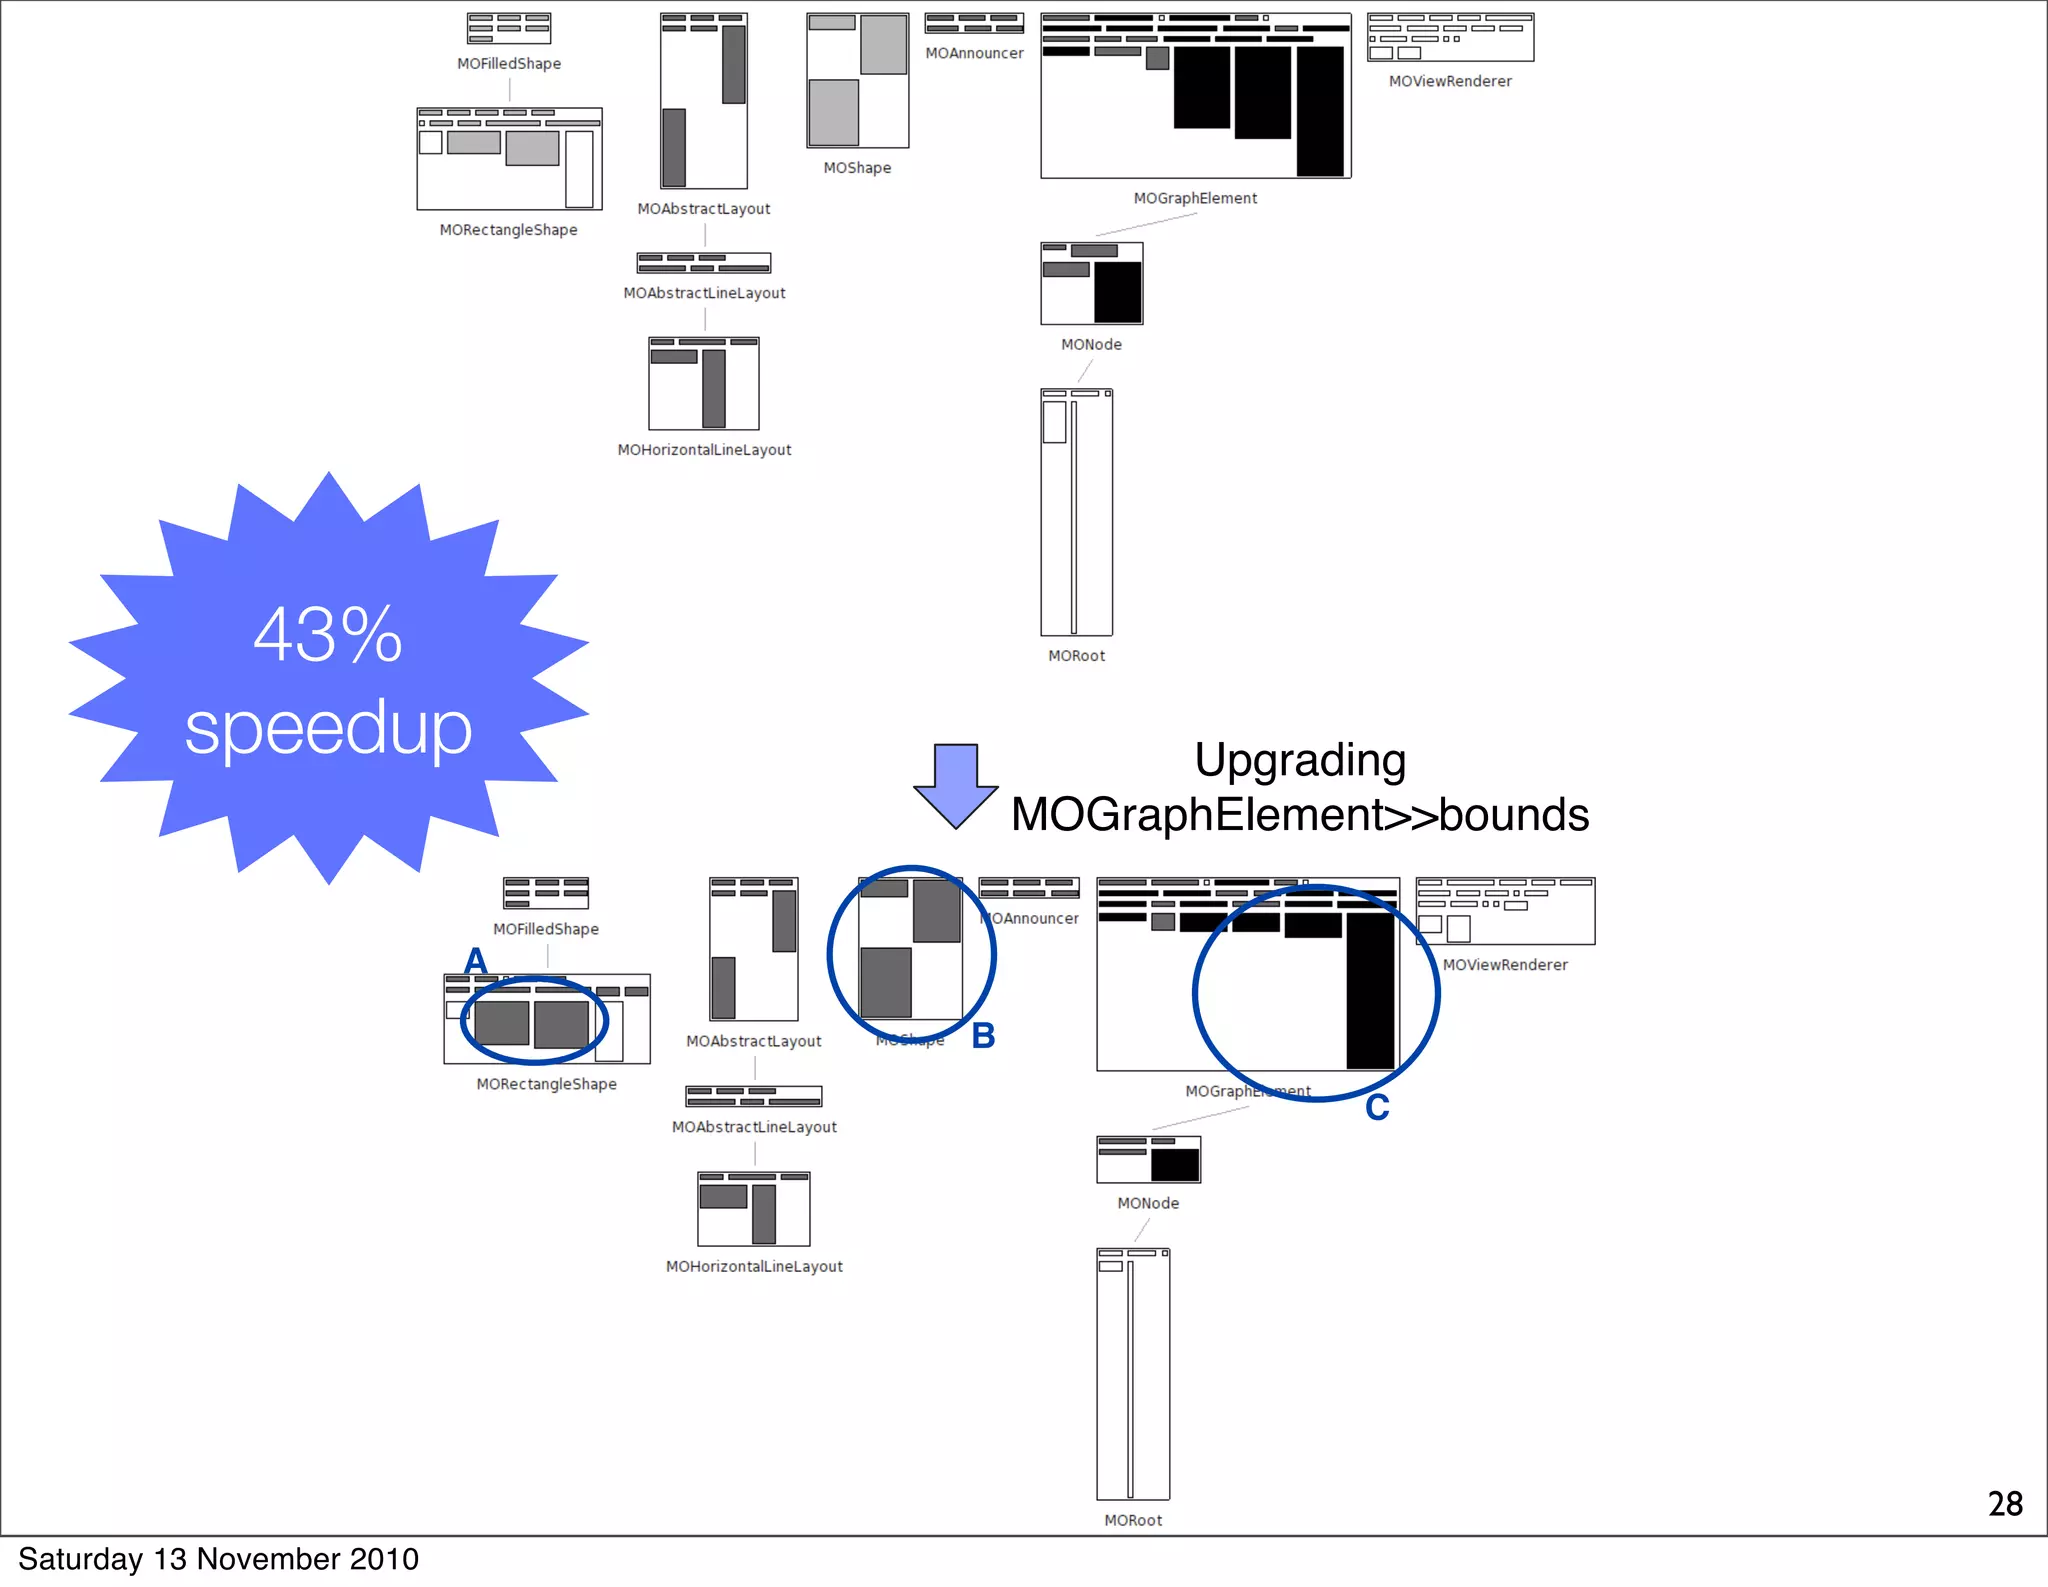
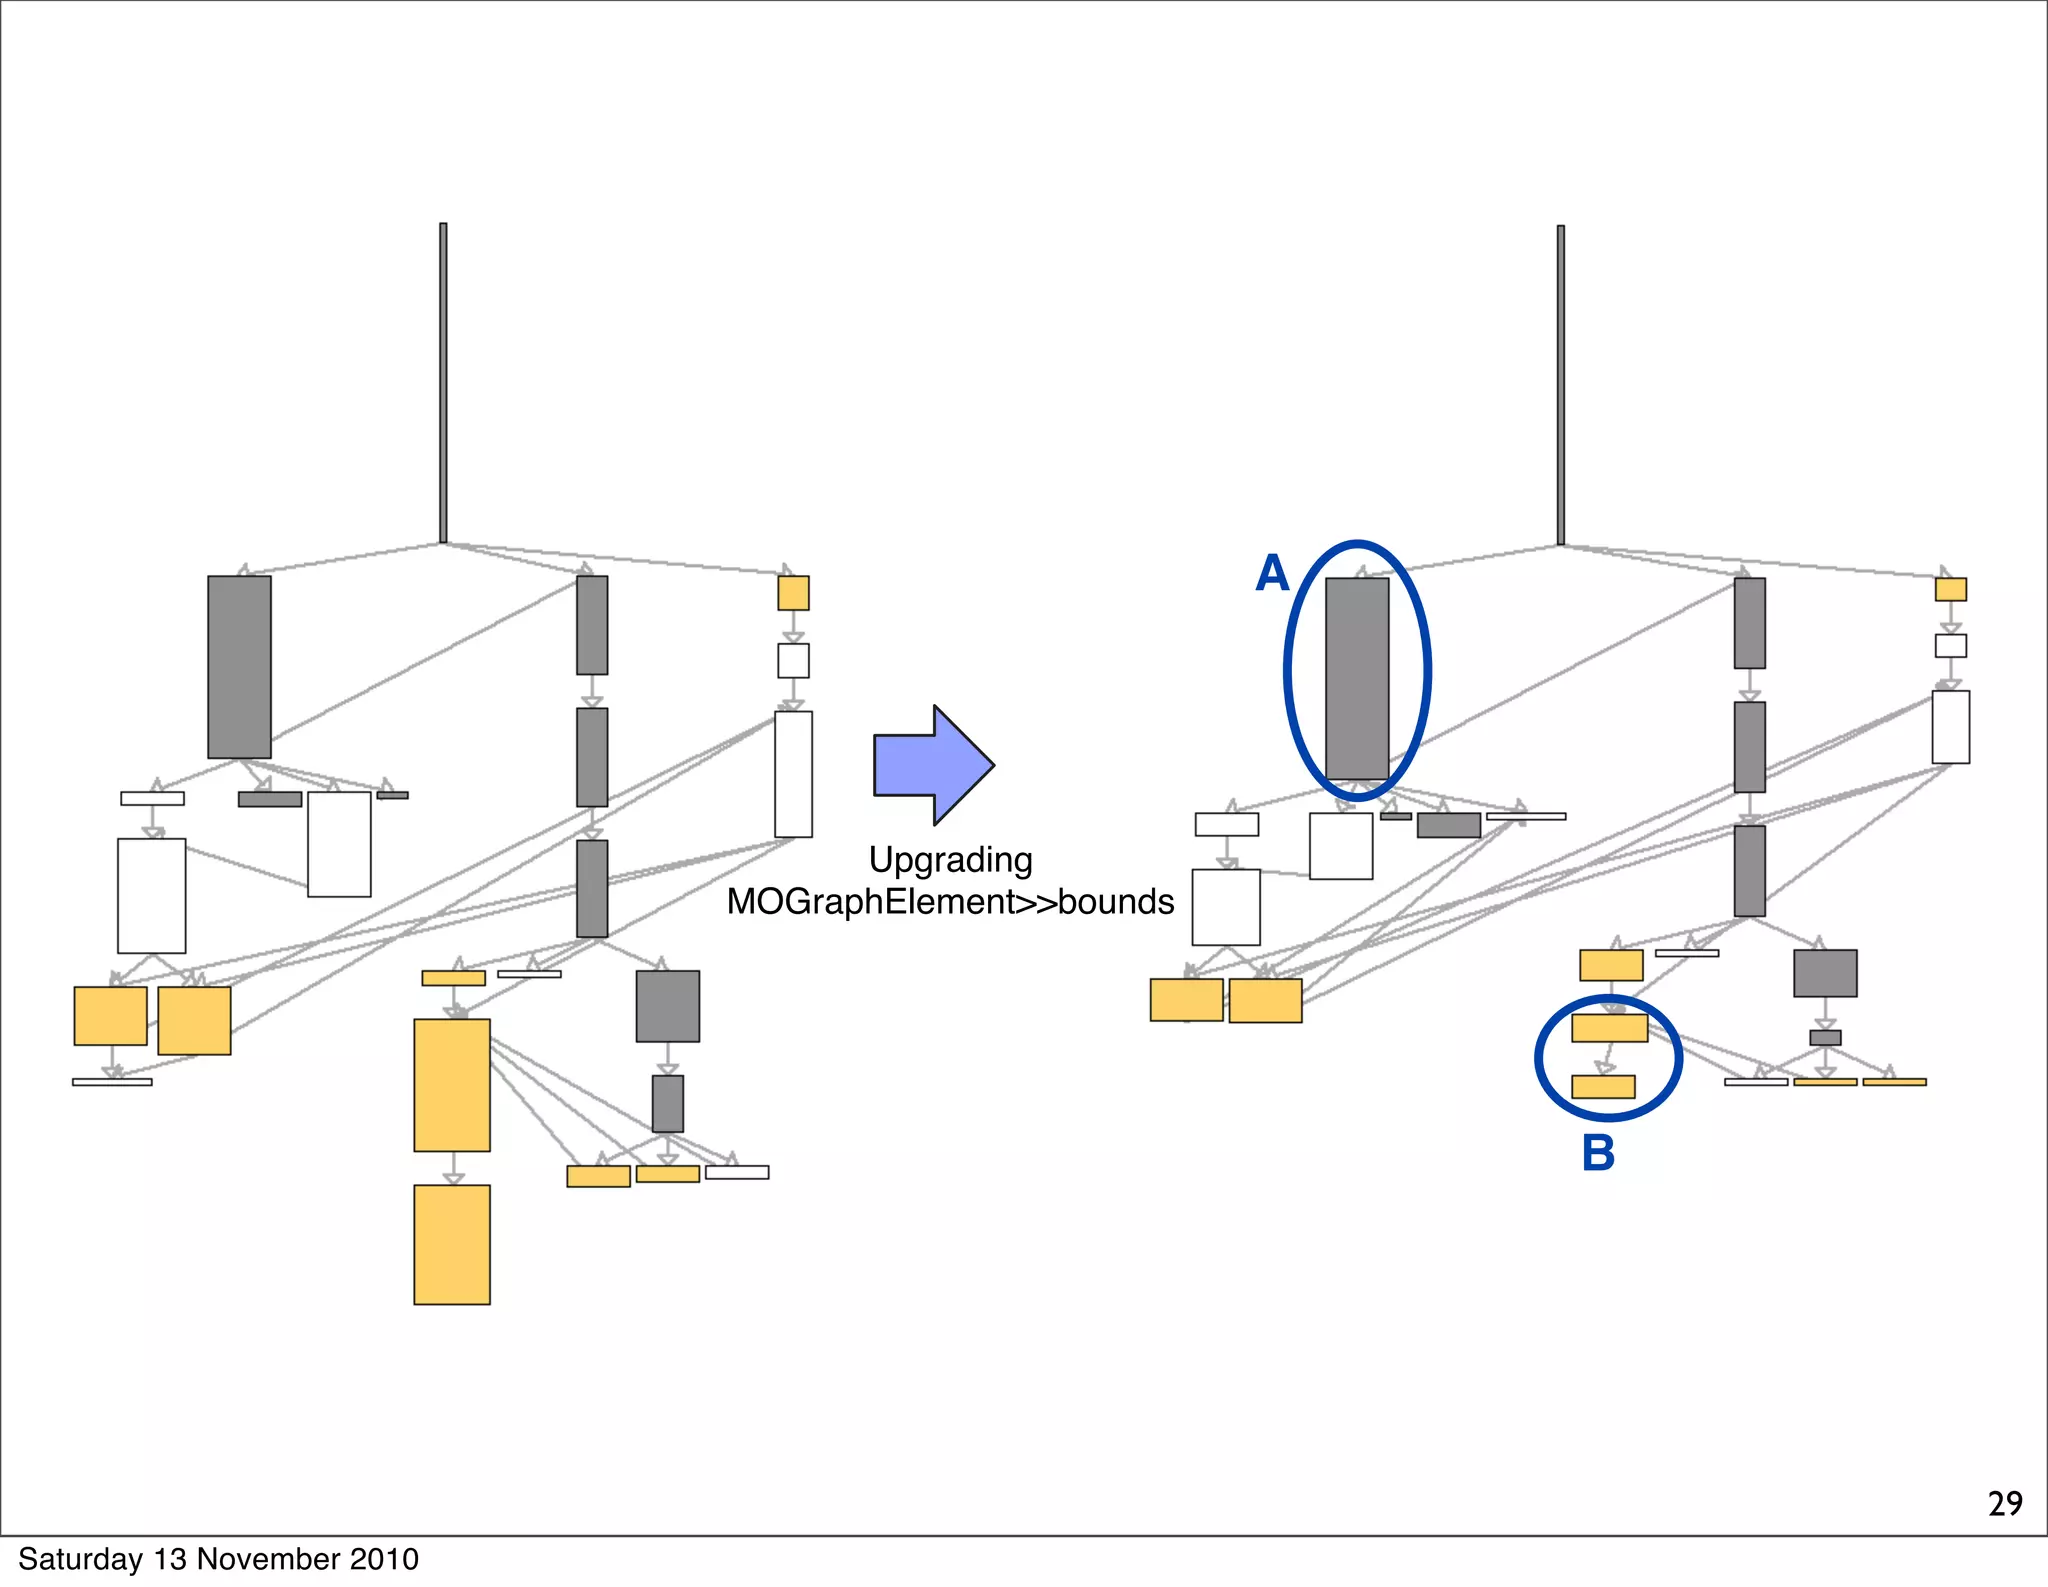
![Memoizing
MOGraphElement>>bounds
"Answer the bounds of the receiver."
| basicBounds |
boundsCache ifNotNil: [ ^ boundsCache ].
self shapeBoundsAt: self shape ifPresent: [ :b | ^ b ].
basicBounds := shape computeBoundsFor: self.
self shapeBoundsAt: self shape put: basicBounds.
^ boundsCache := basicBounds
26
Saturday 13 November 2010](https://image.slidesharecdn.com/2010-profilingobjects-101113133636-phpapp02/75/Multi-dimensional-profiling-26-2048.jpg)
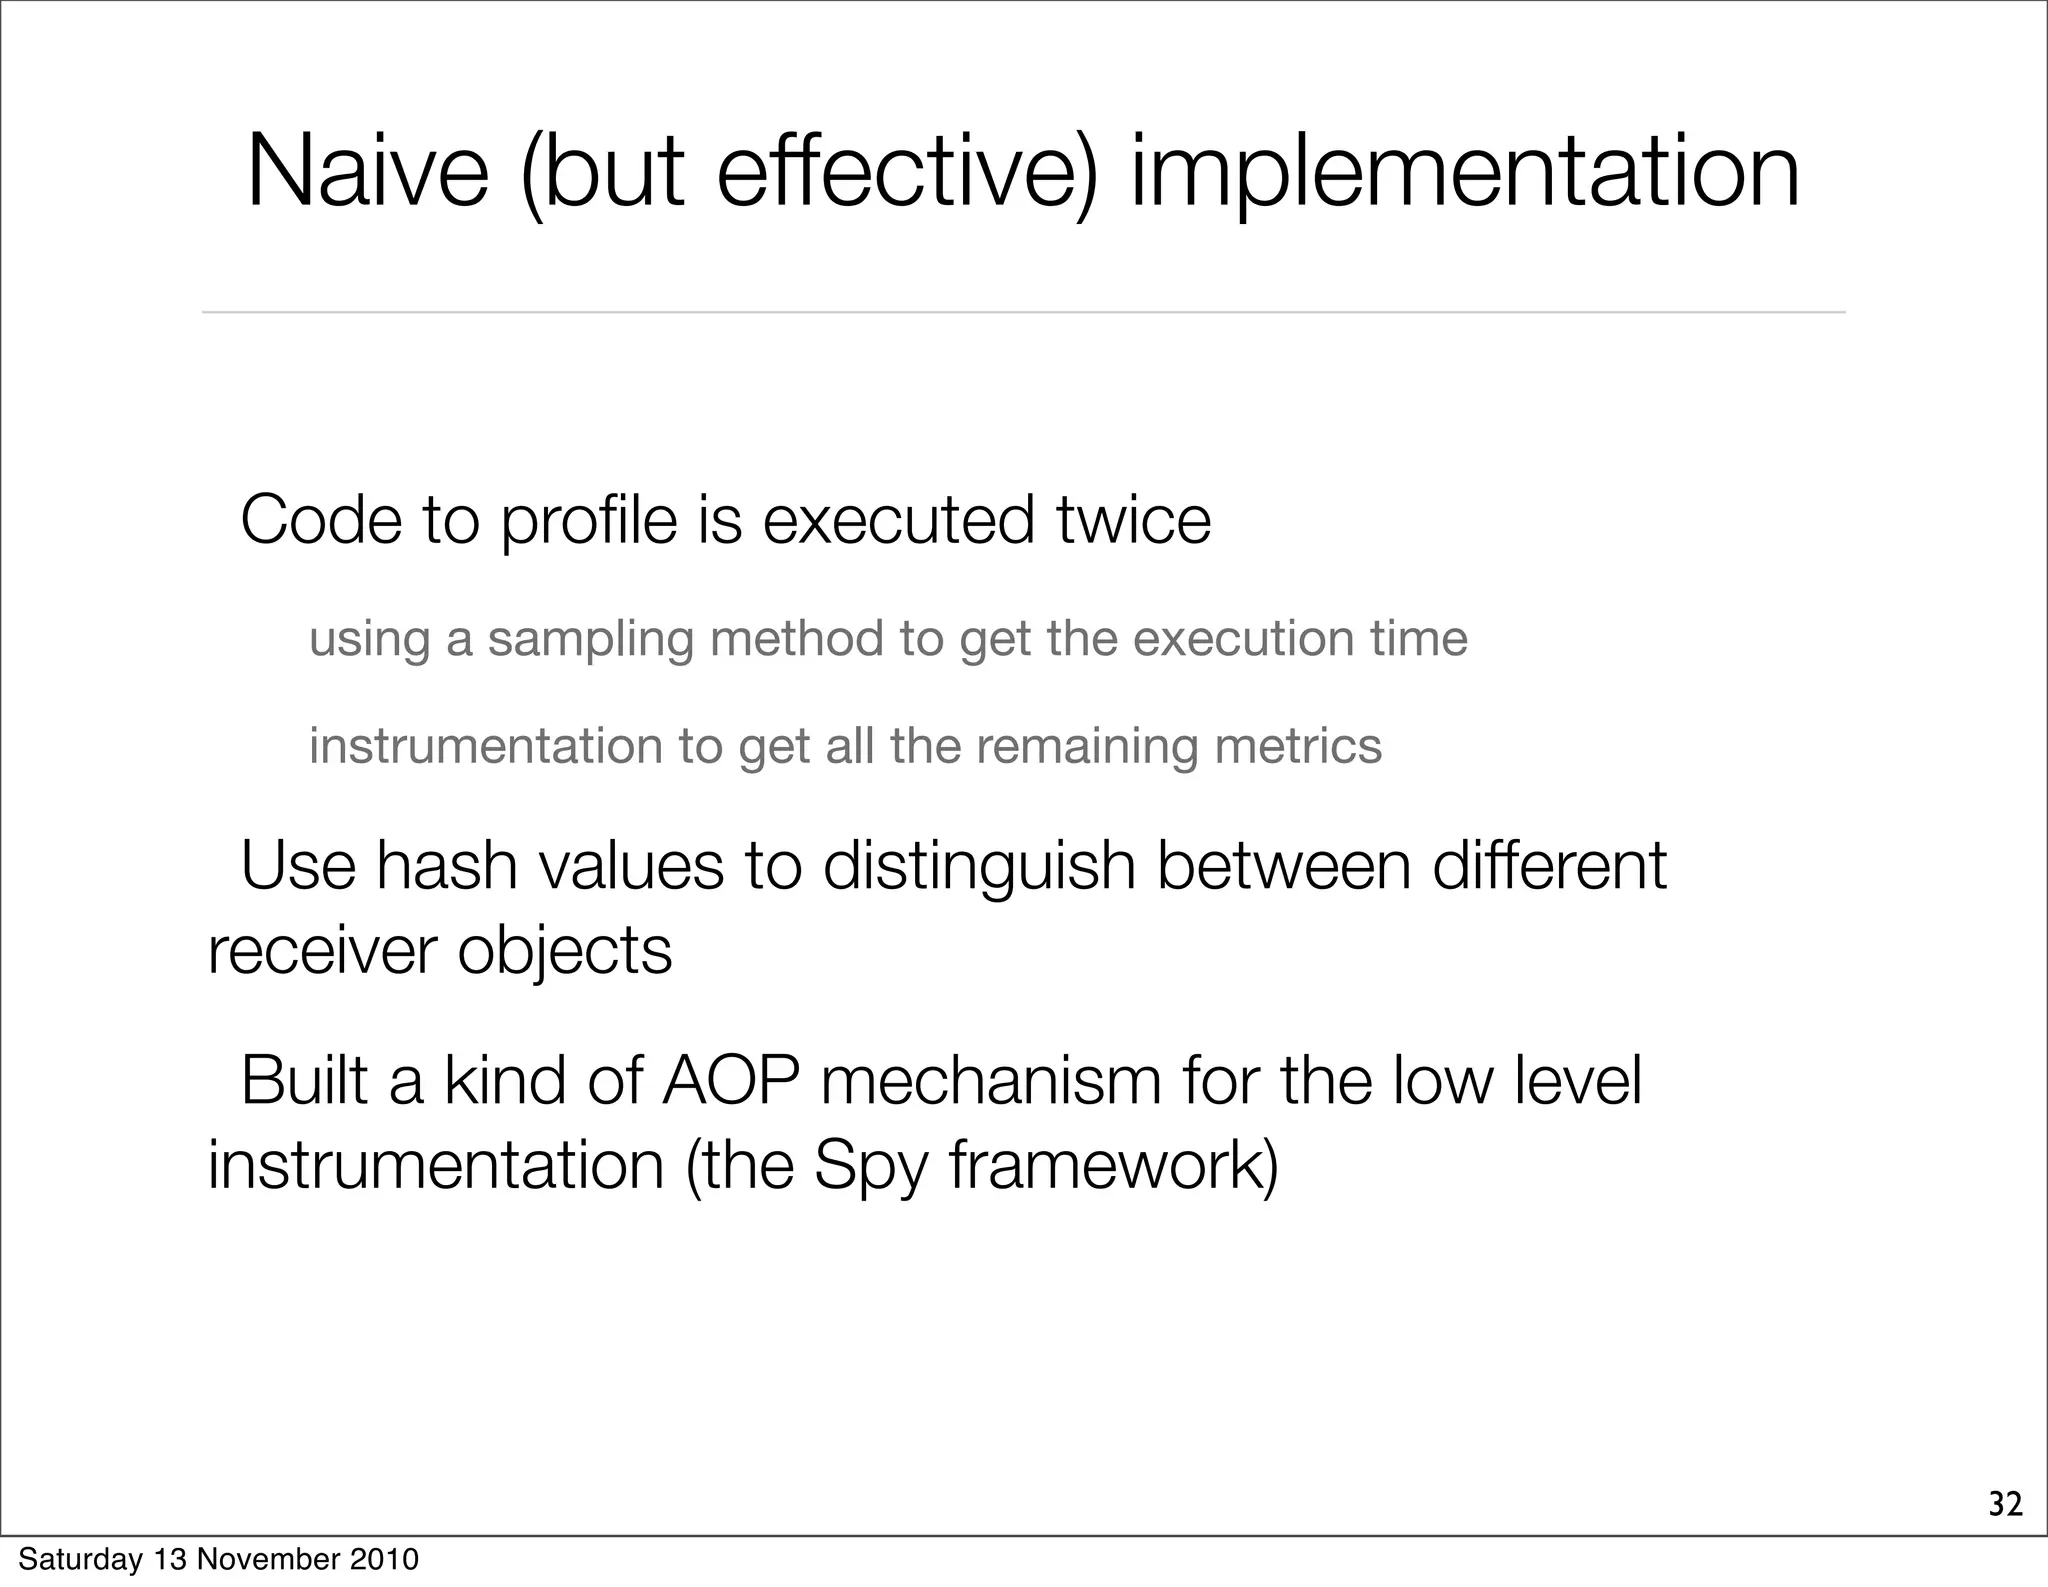


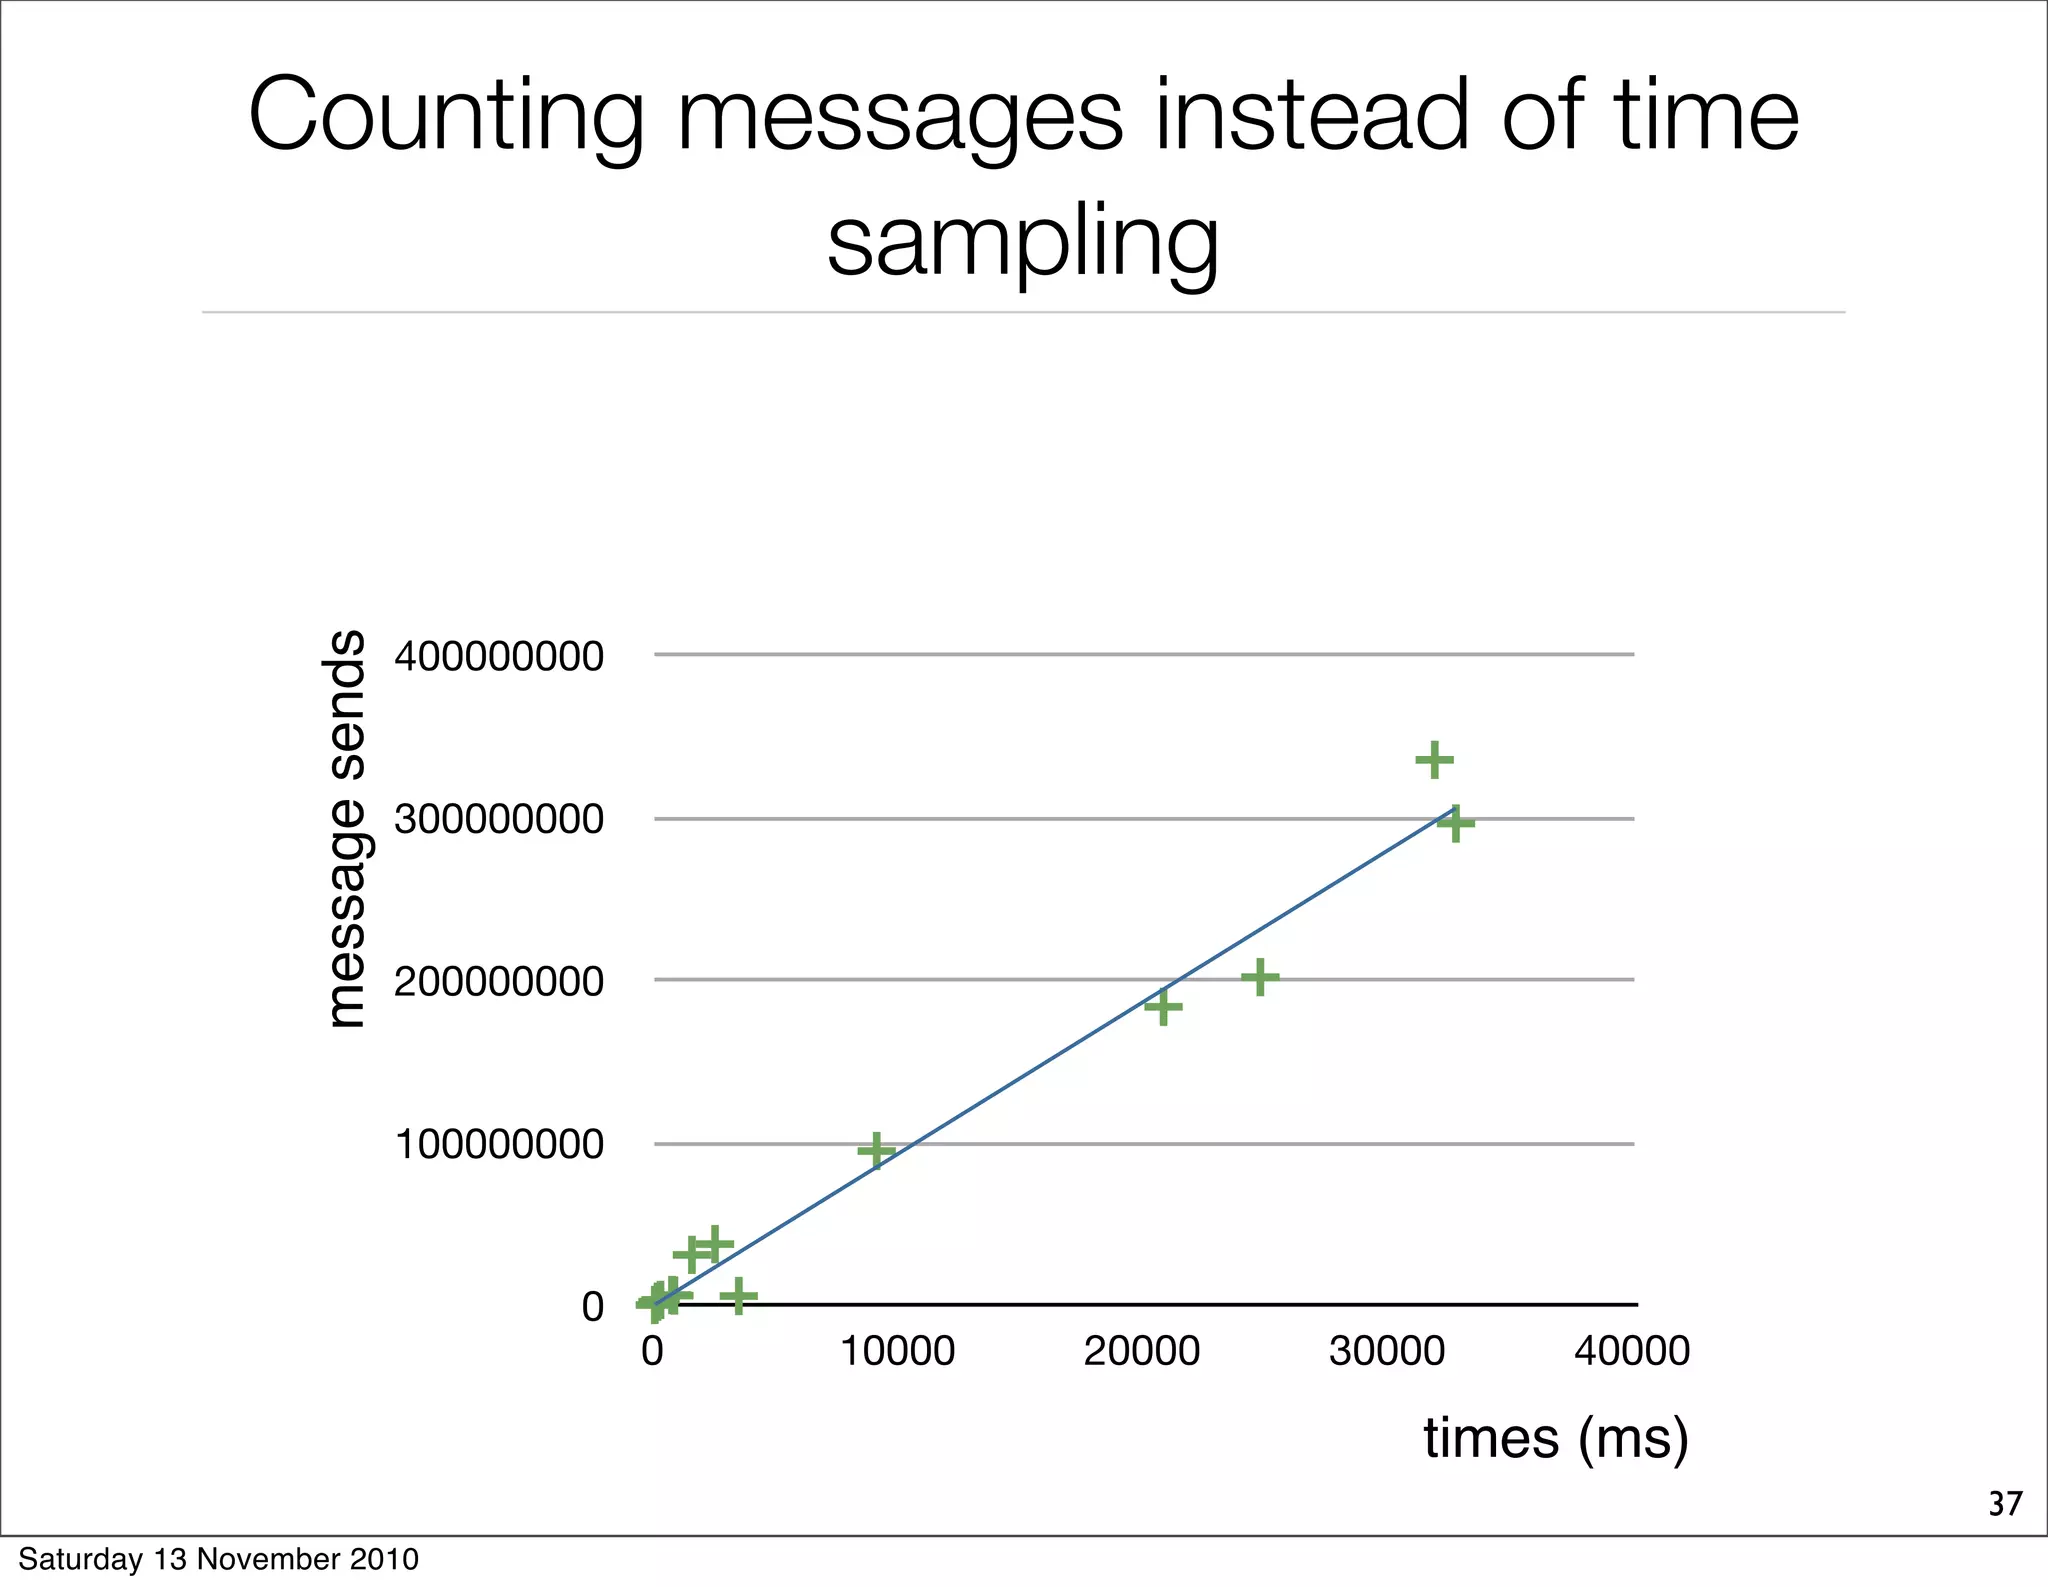
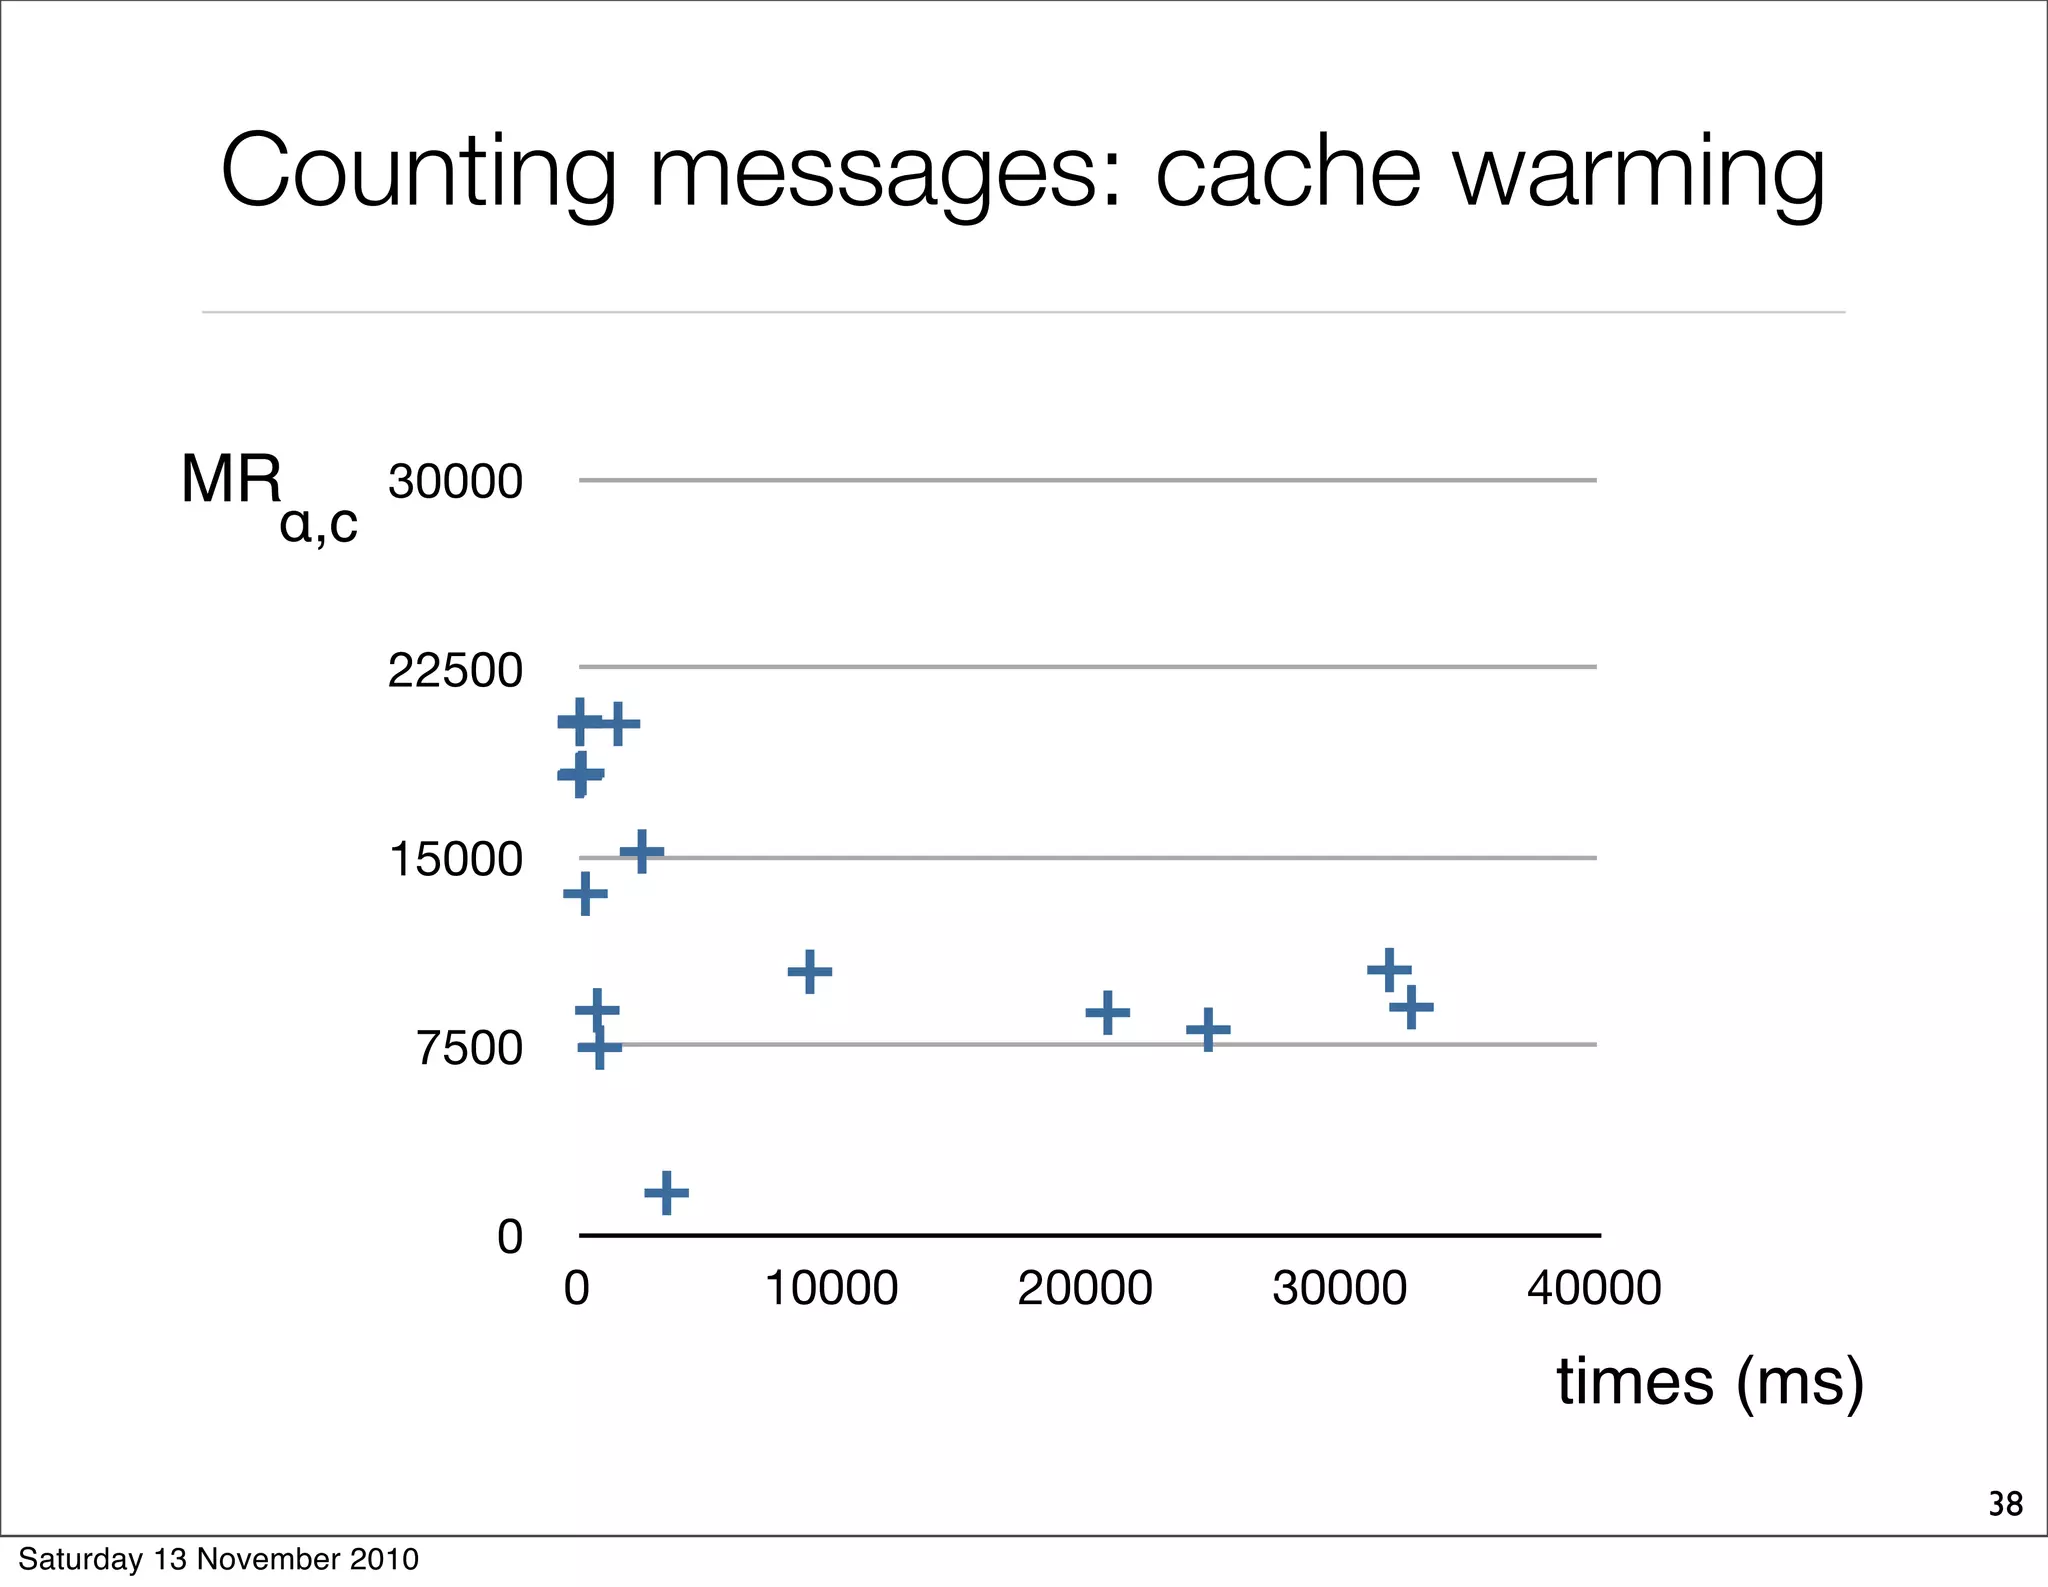
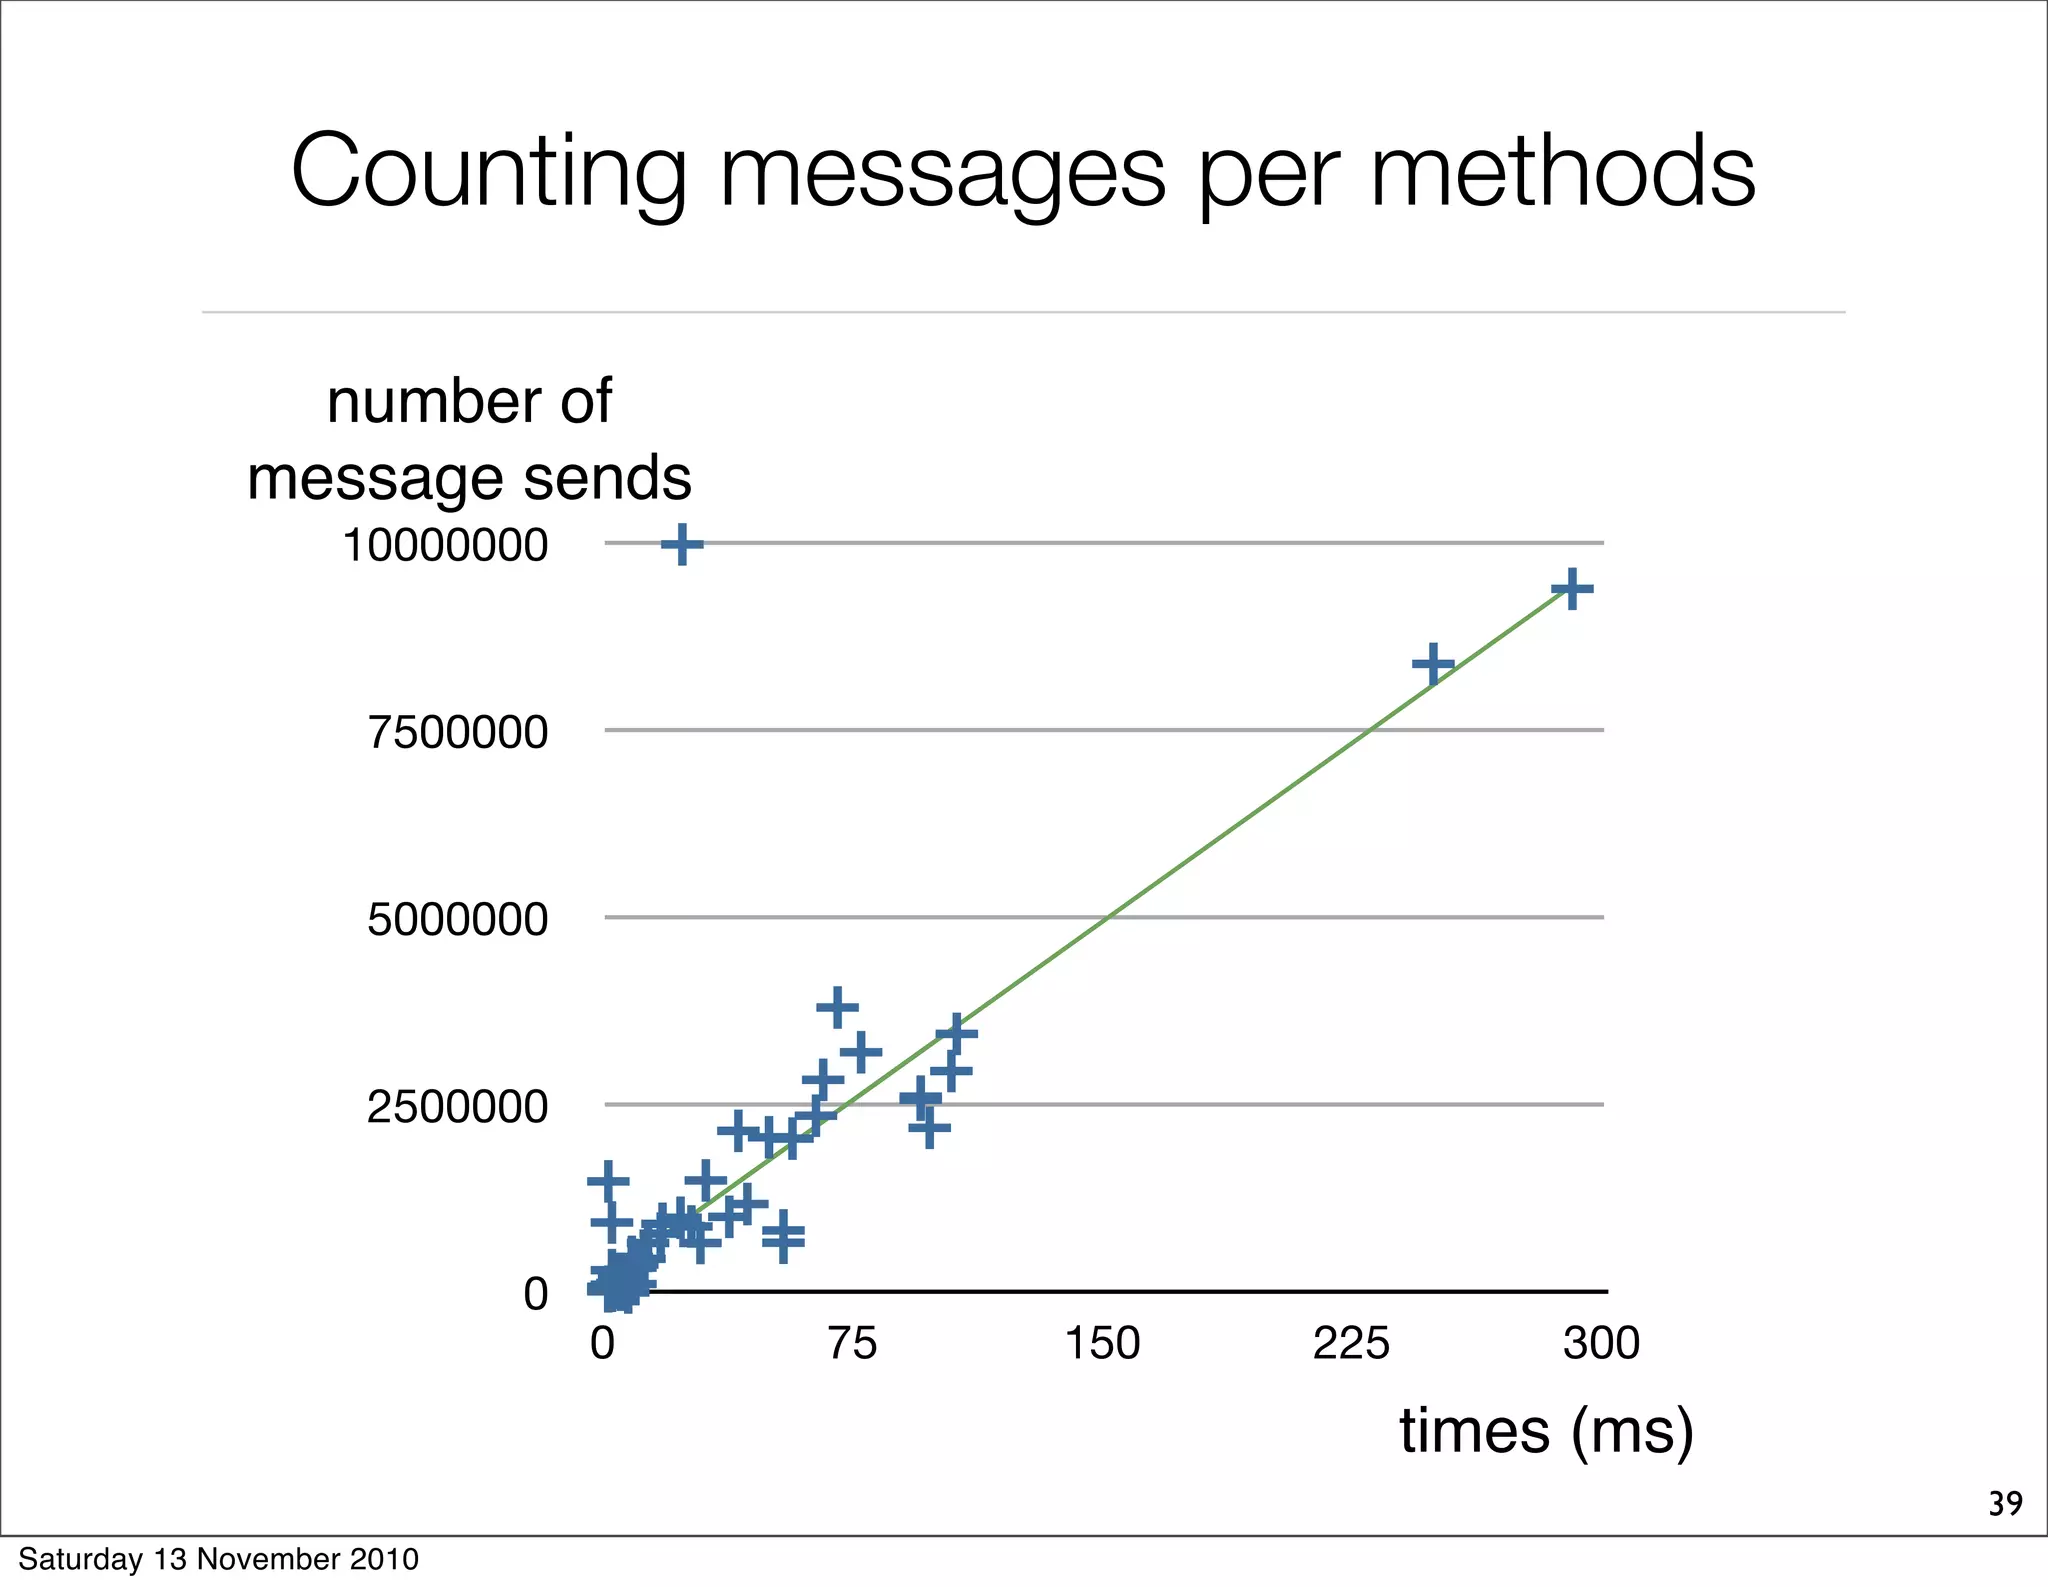
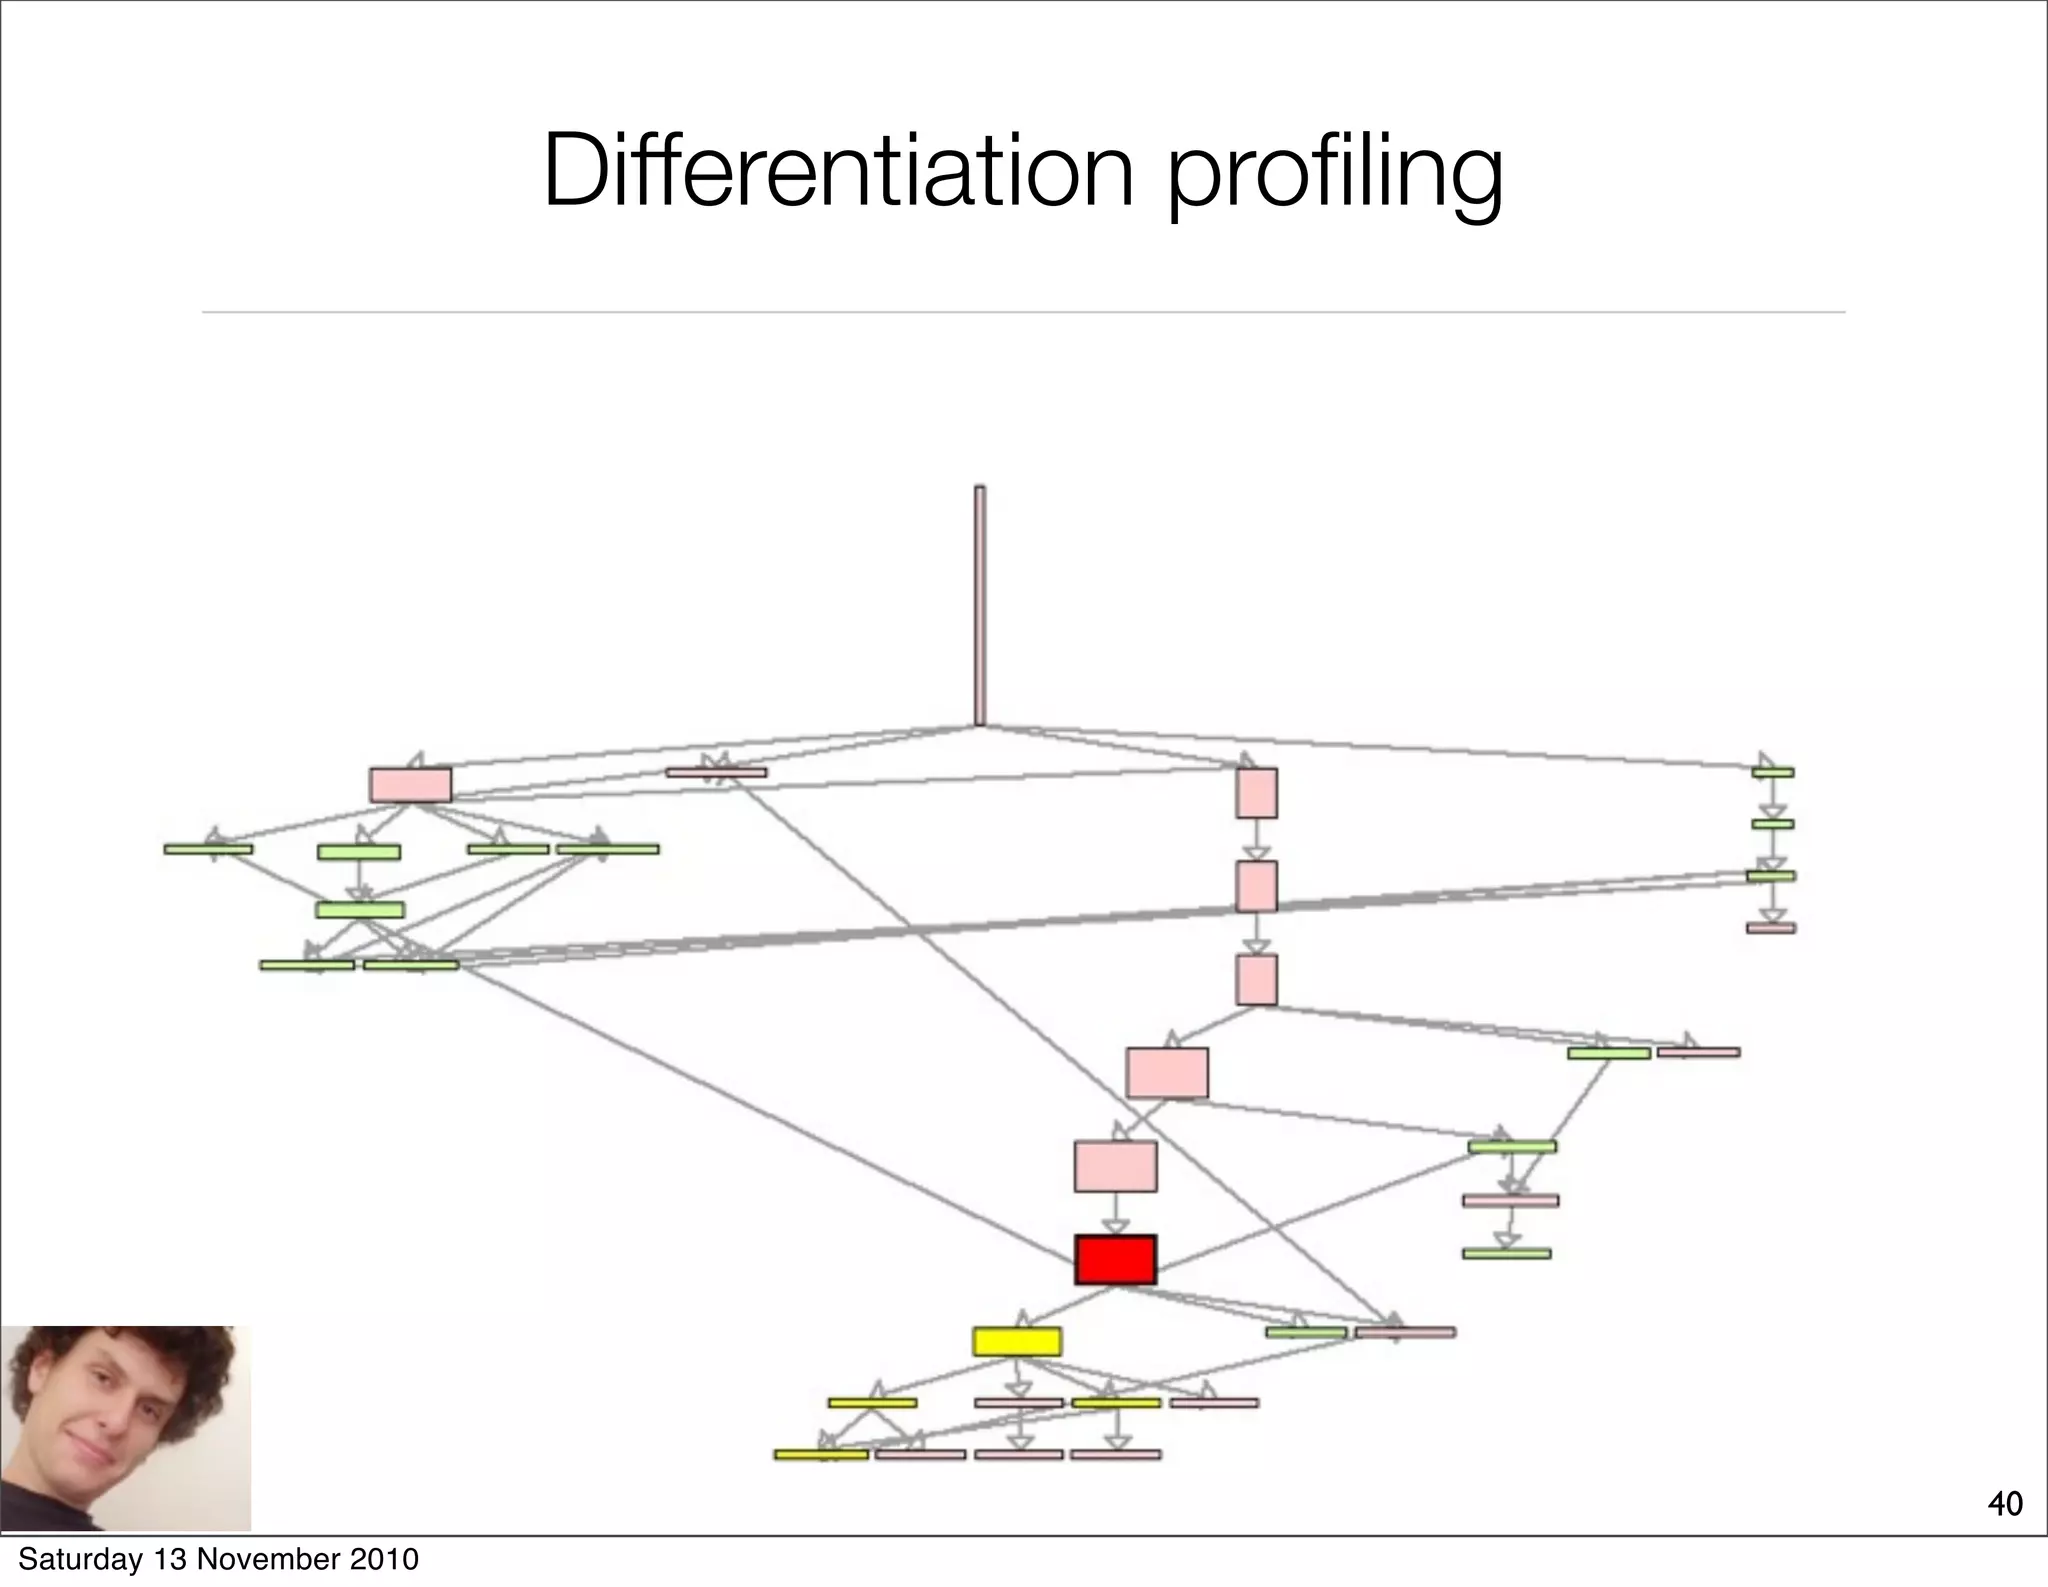
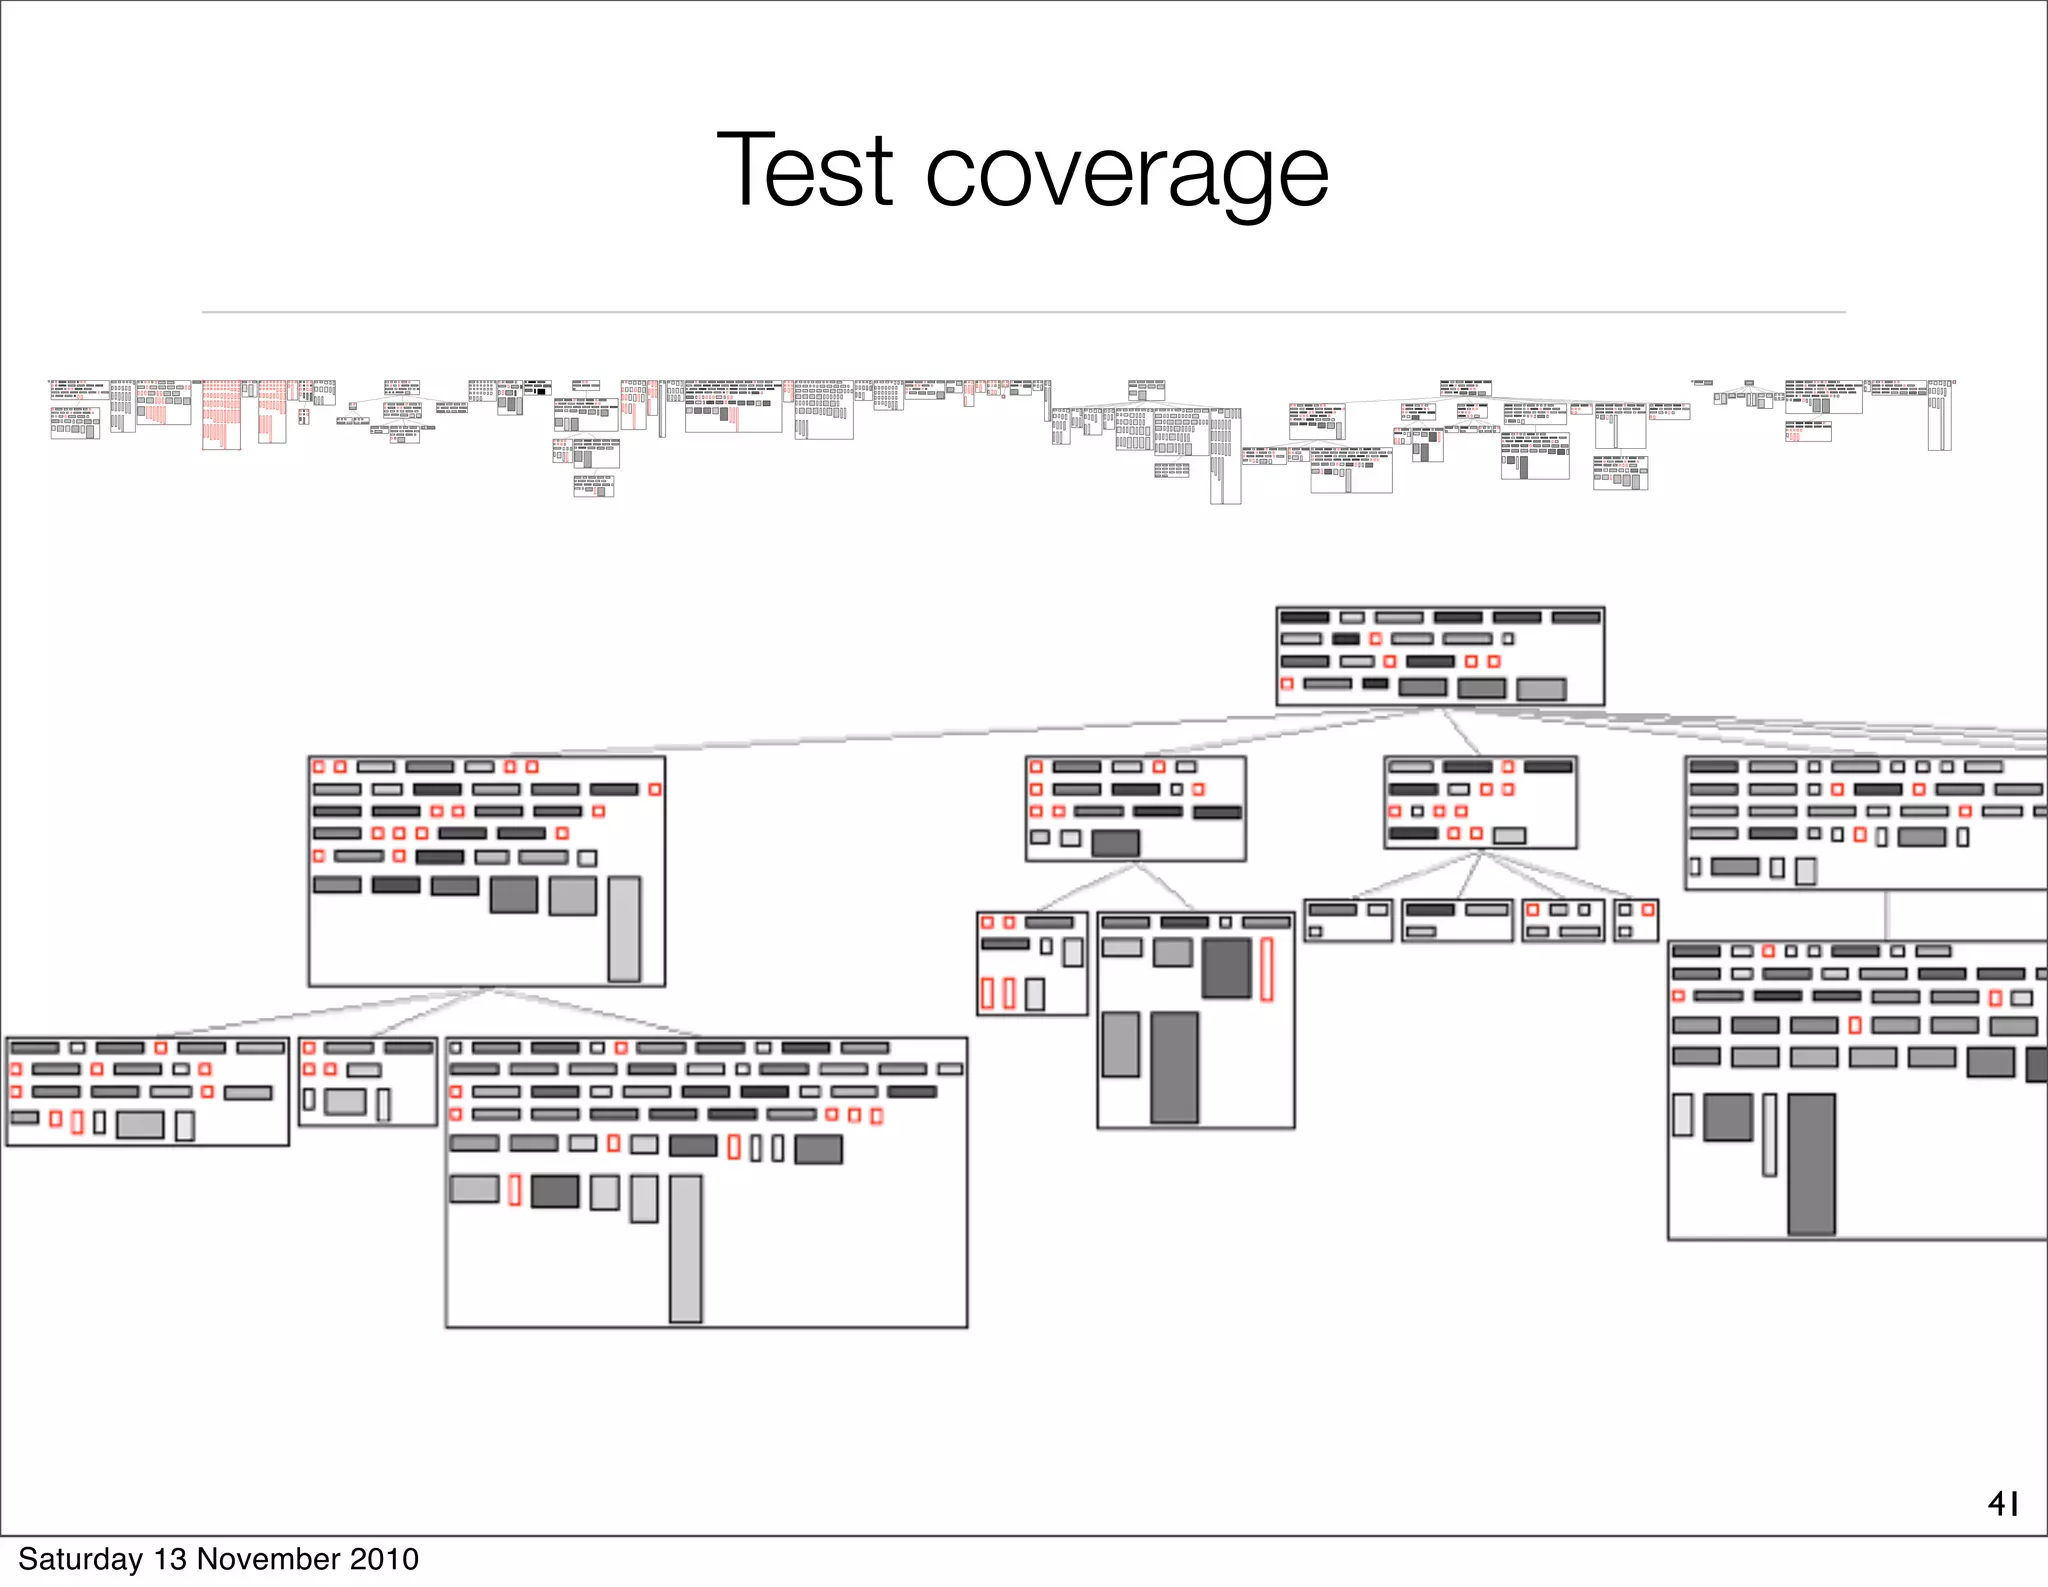
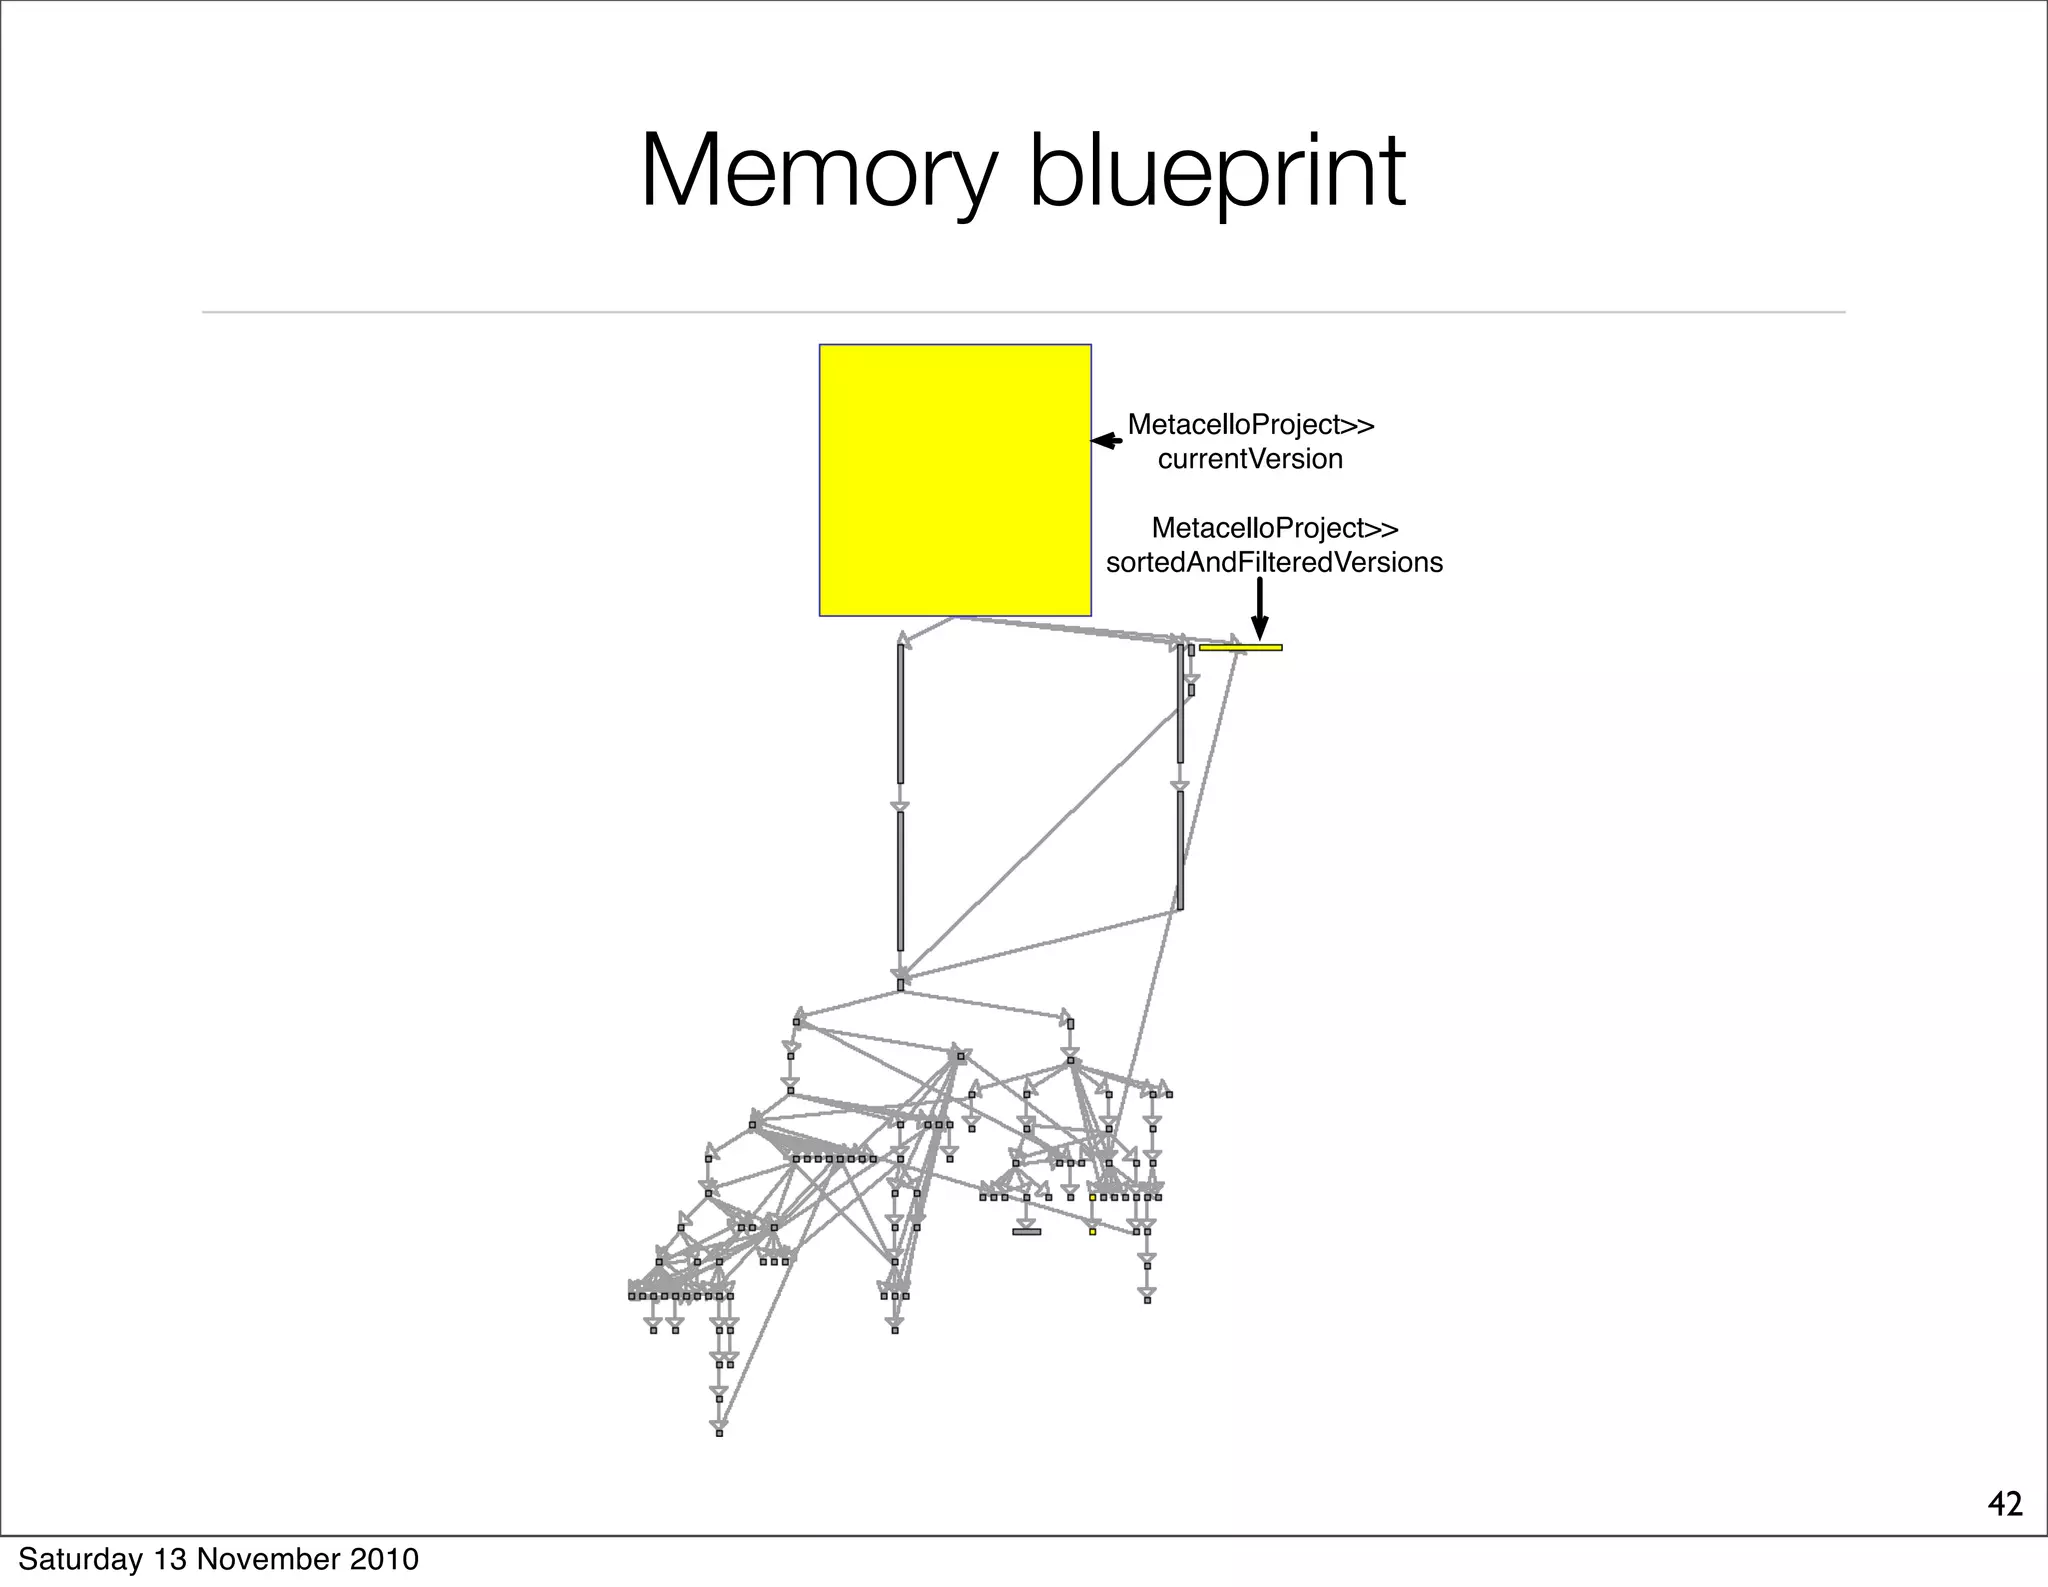
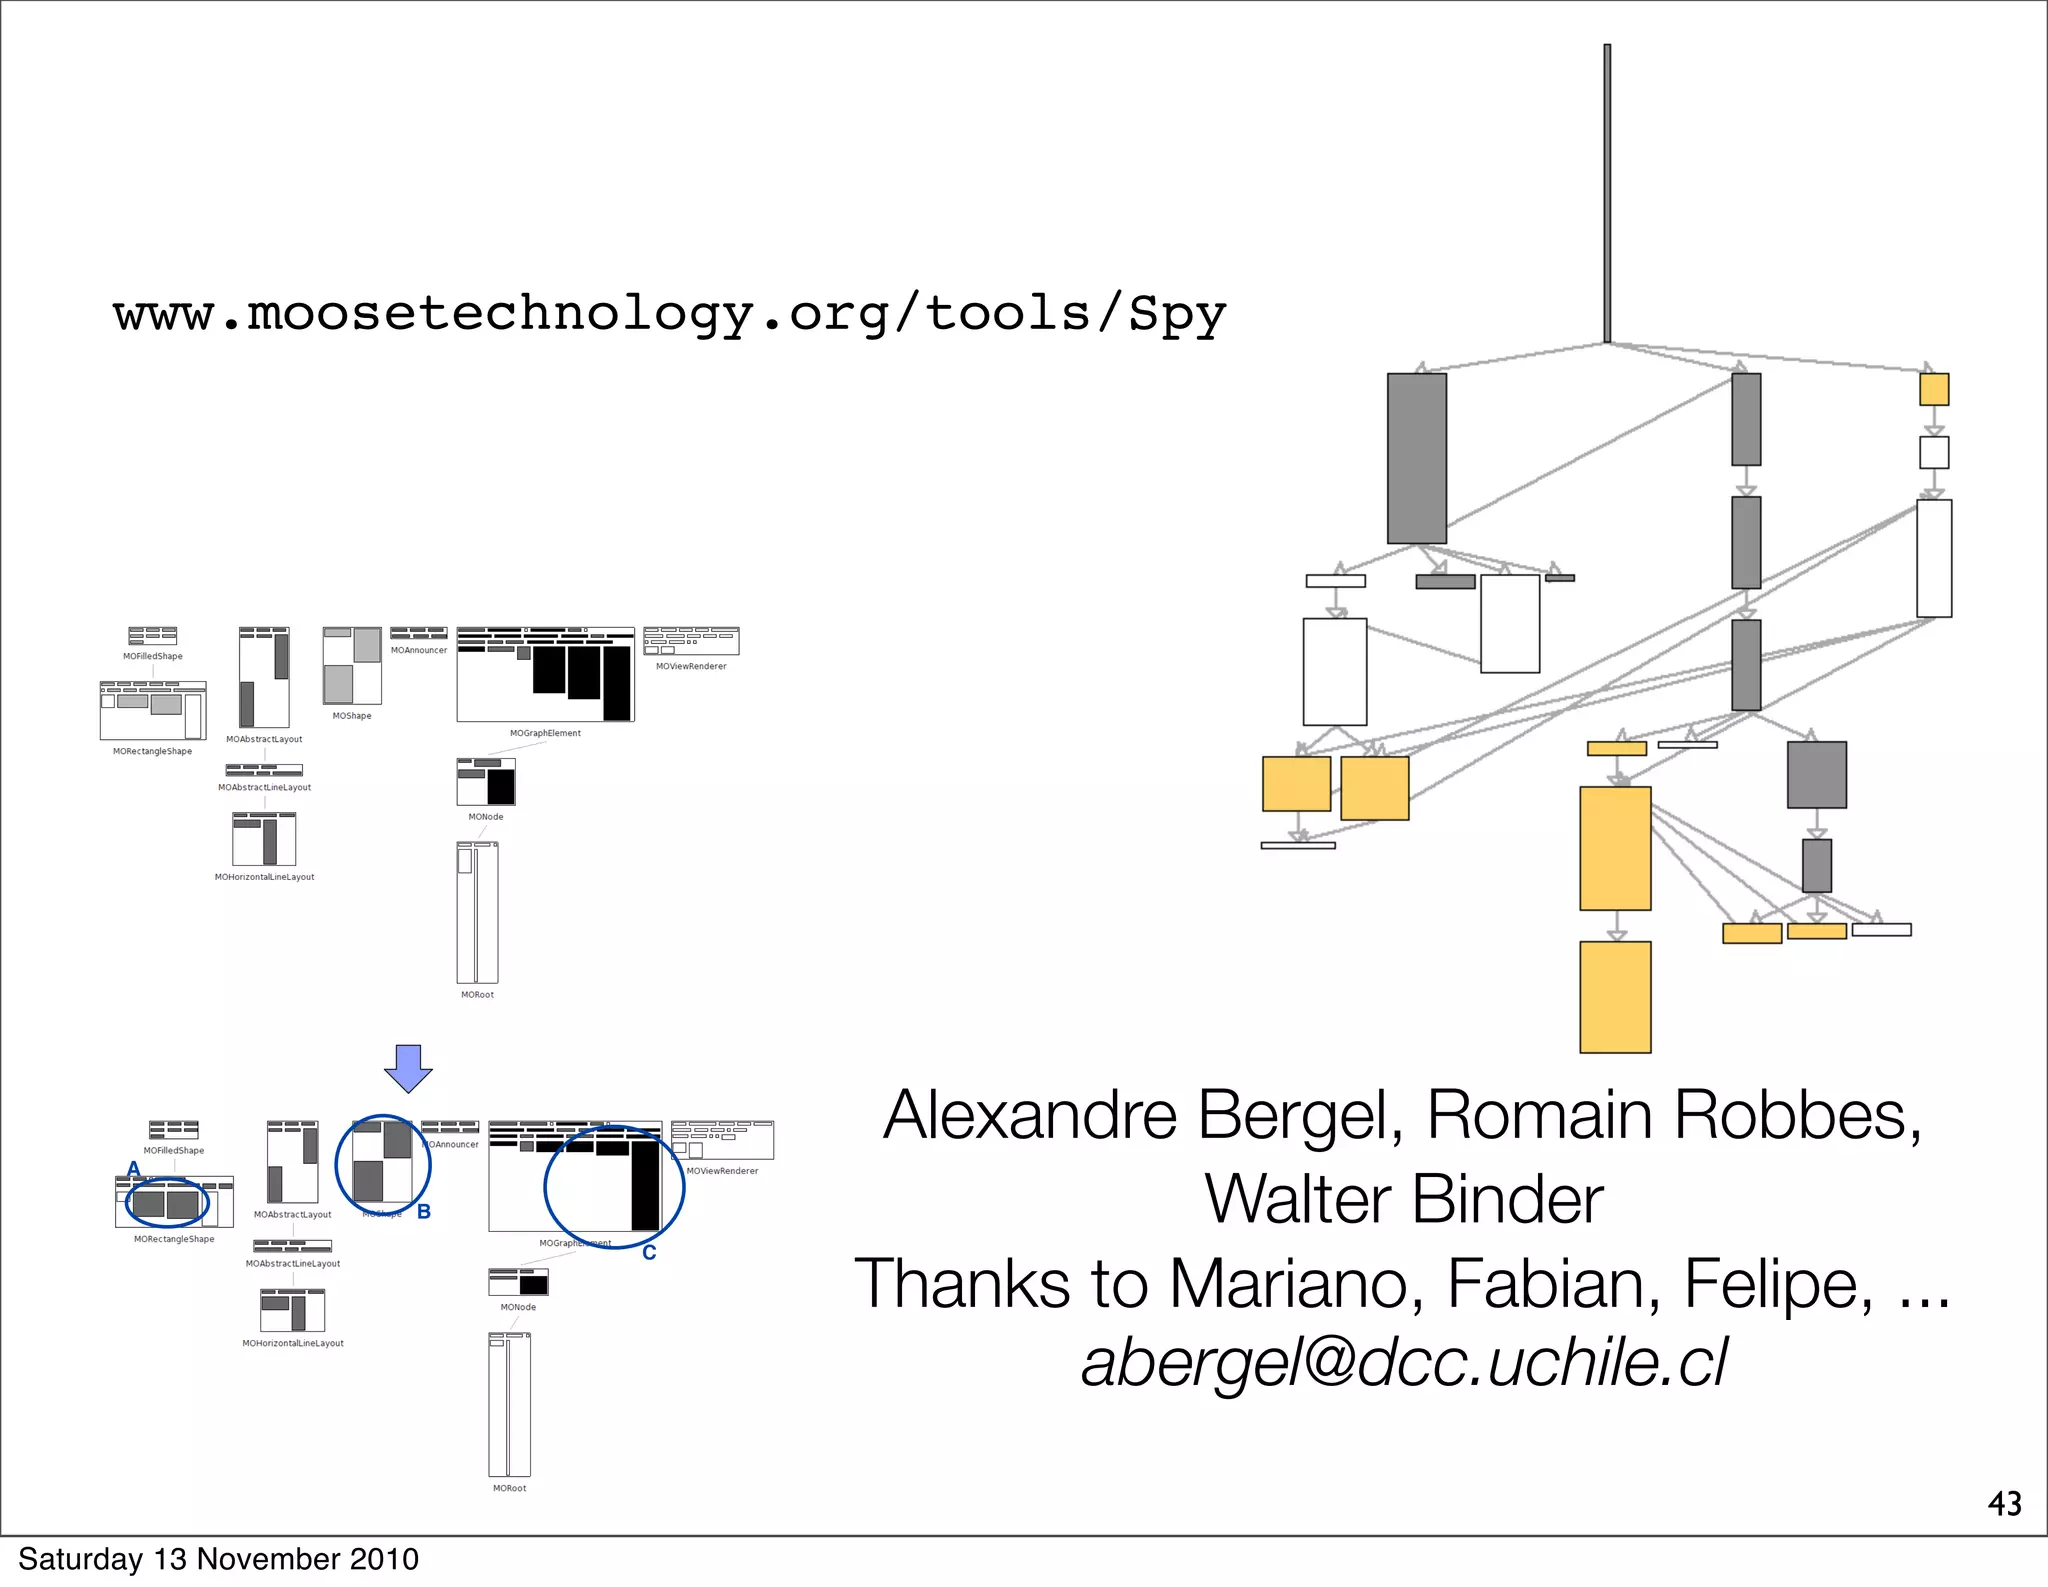

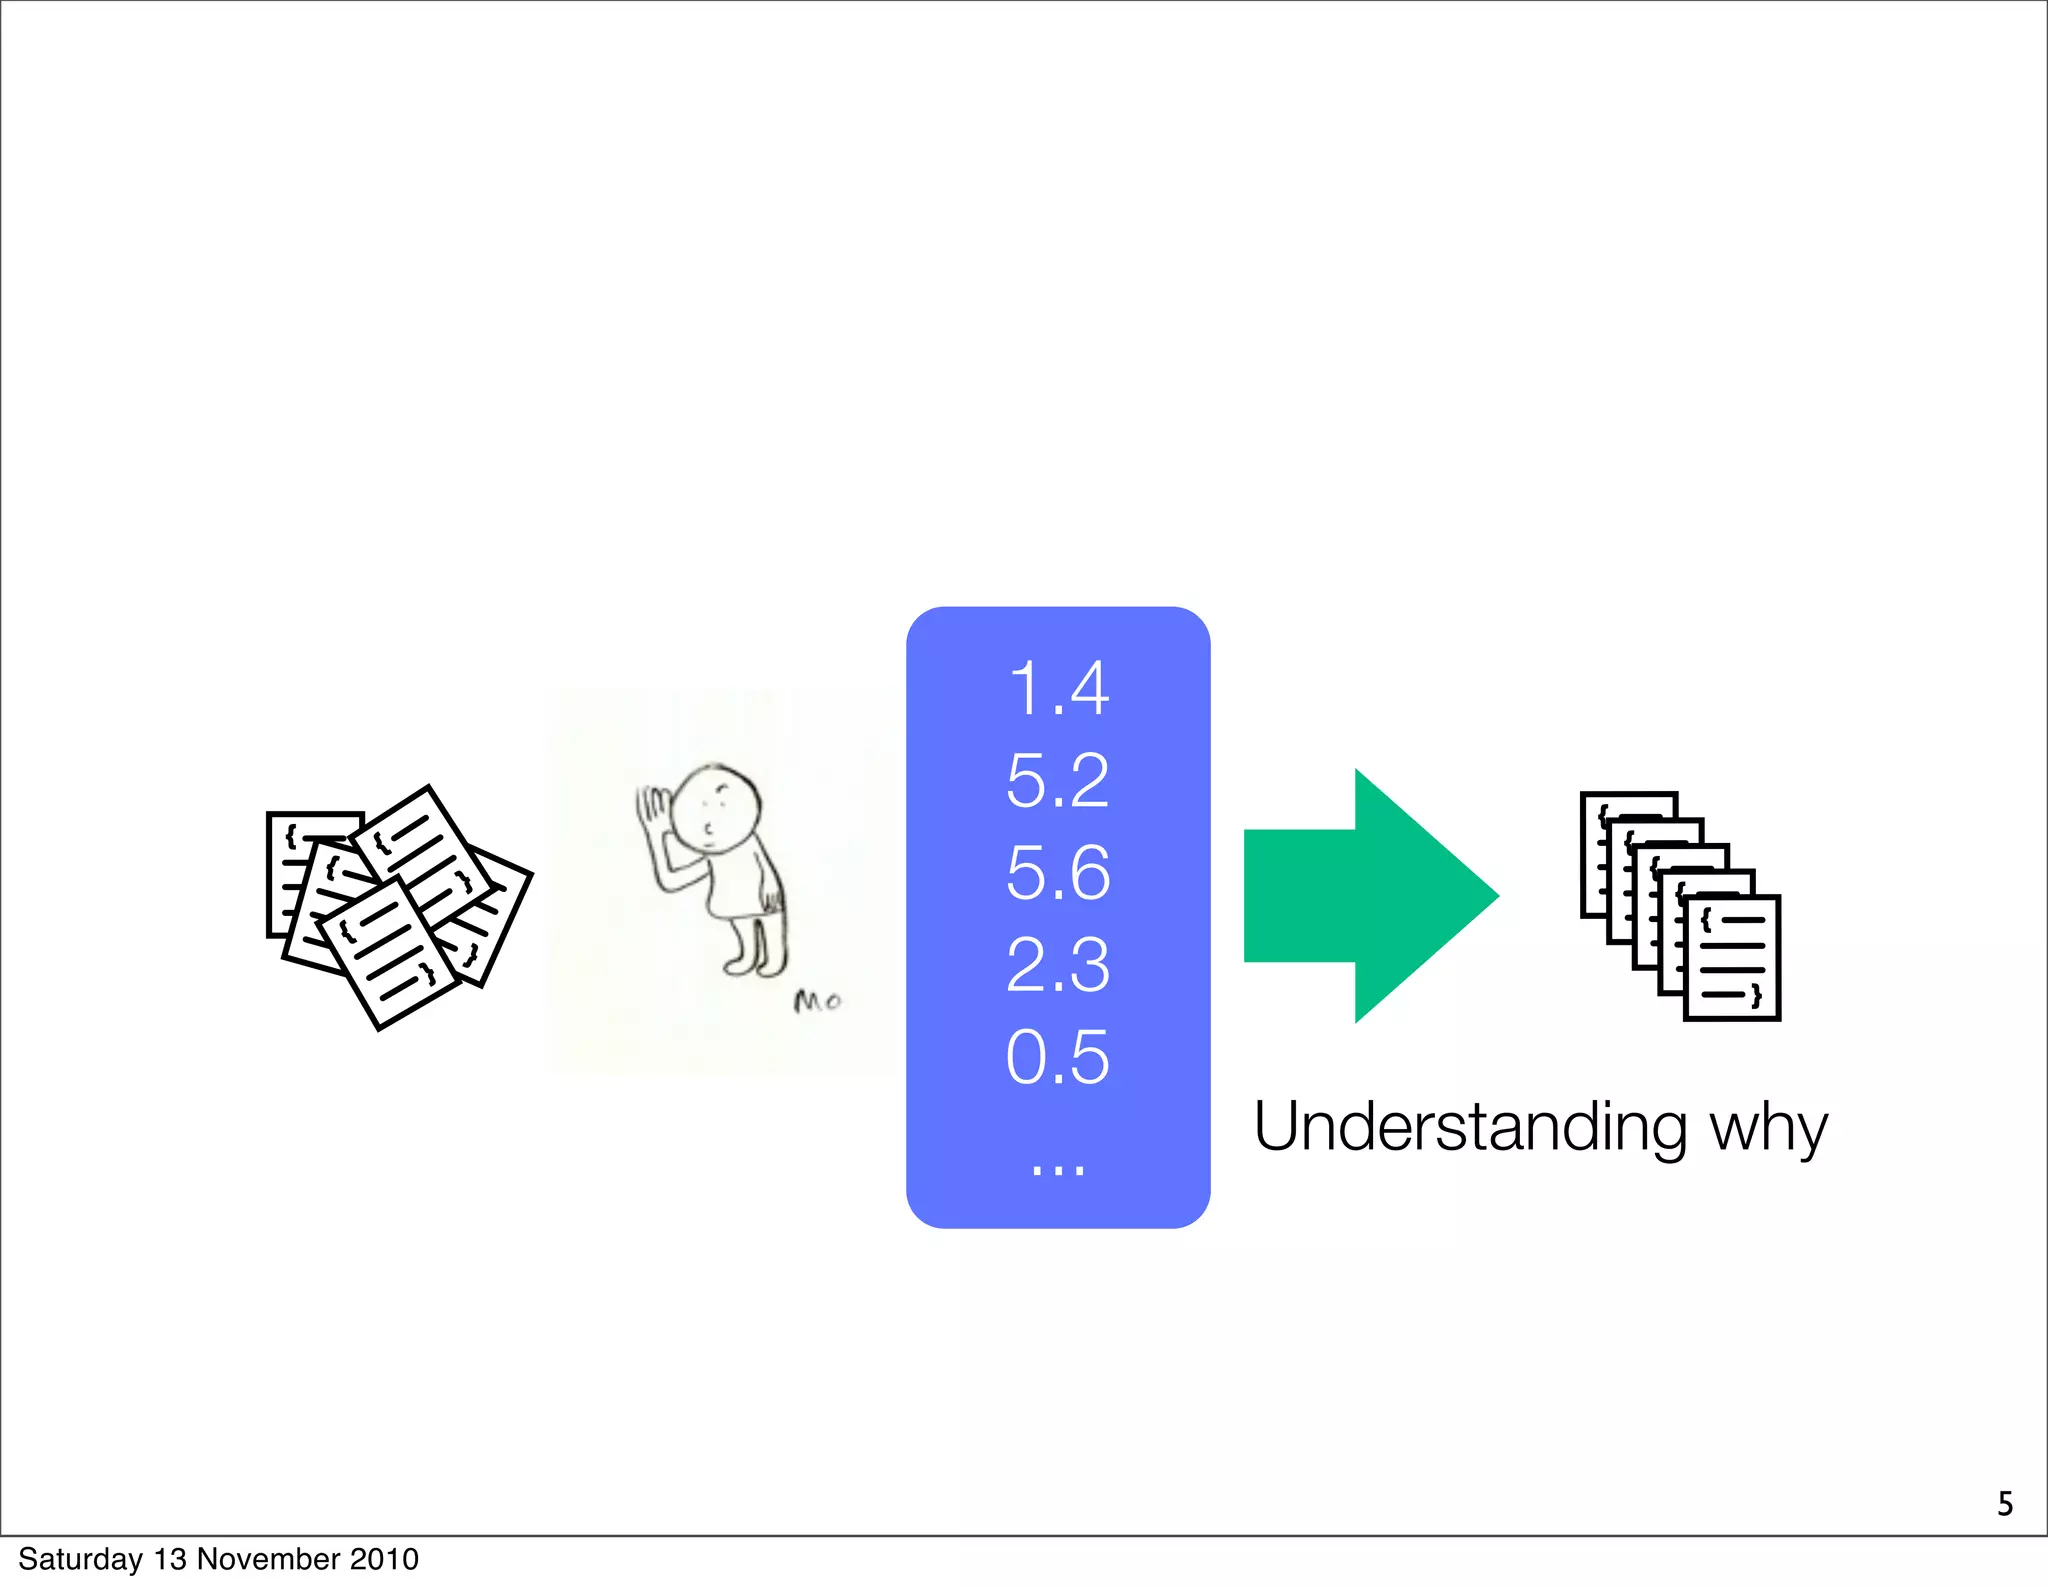
This document discusses multi-dimensional execution profiling. It presents an approach to profiling code using multiple metrics like execution time, number of executions, number of receiver objects, in order to better understand method performance. Blueprints are used to visualize profiling data with different views like structural, behavioral, and detailed views. The implementation counts messages instead of time to profile code and generates visualizations using scripting languages. This technique provides more insight into why certain methods are slow compared to traditional profiling tools.


![[ CNCF Q1 2024 ] Intro to Continuous Profiling and Grafana Pyroscope.pdf](https://cdn.slidesharecdn.com/ss_thumbnails/cncfq12024introtocontinuousprofilingandgrafanapyroscope-240407162420-9c15afb7-thumbnail.jpg?width=640&height=640&fit=bounds)


![Coded Agents – with UiPath SDK + LangGraph [Virtual Hands-on Workshop]](https://cdn.slidesharecdn.com/ss_thumbnails/codedagentsdeck-251215155422-5497c599-thumbnail.jpg?width=640&height=640&fit=bounds)


