Download to read offline


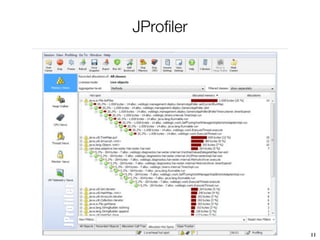
![gprof: call graph (~1984)
index % time self children called name
<spontaneous>
[1] 100.0 0.00 0.05 start [1]
0.00 0.05 1/1 main [2]
0.00 0.00 1/2 on_exit [28]
0.00 0.00 1/1 exit [59]
-----------------------------------------------
0.00 0.05 1/1 start [1]
[2] 100.0 0.00 0.05 1 main [2]
0.00 0.05 1/1 report [3]
-----------------------------------------------
0.00 0.05 1/1 main [2]
[3] 100.0 0.00 0.05 1 report [3]
0.00 0.03 8/8 timelocal [6]
0.00 0.01 1/1 print [9]
0.00 0.01 9/9 fgets [12]
0.00 0.00 12/34 strncmp <cycle 1> [40]
0.00 0.00 8/8 lookup [20]
0.00 0.00 1/1 fopen [21]
0.00 0.00 8/8 chewtime [24]
0.00 0.00 8/16 skipspace [44]
-----------------------------------------------
[4] 59.8 0.01 0.02 8+472 <cycle 2 as a whole>
[4]
0.01 0.02 244+260 offtime <cycle 2> [7]
0.00 0.00 236+1 tzset <cycle 2> [26]
-----------------------------------------------
6](https://image.slidesharecdn.com/2010-profilingblueprinttools-100708083345-phpapp02/85/Profiling-blueprints-6-320.jpg)

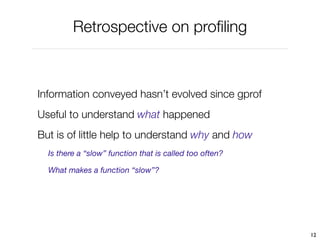
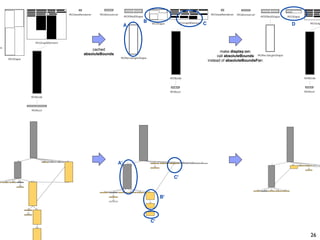
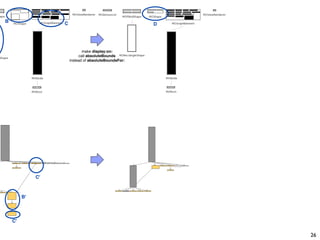
![Polymetric view can map up to 5
dimensions
width property
color height
property property
X property
Y
property
[Lanza 2003] 14](https://image.slidesharecdn.com/2010-profilingblueprinttools-100708083345-phpapp02/85/Profiling-blueprints-14-320.jpg)
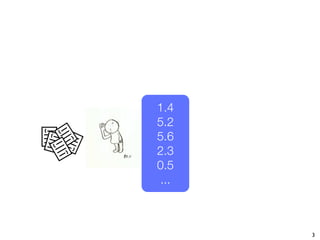
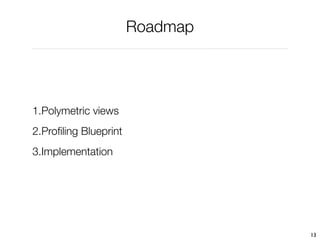
![KaiProfiler
viewProfiling: [
| view |
view := MOViewRenderer new.
view
nodes: (1 to: 100)
forEach: [:each |
view nodes: (1 to: 100)].
view root applyLayout
]
15](https://image.slidesharecdn.com/2010-profilingblueprinttools-100708083345-phpapp02/85/Profiling-blueprints-15-320.jpg)
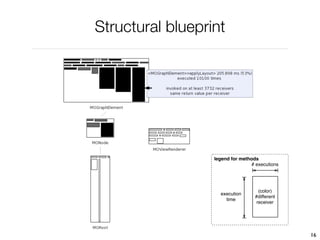
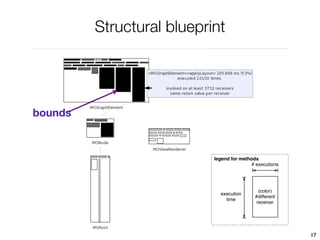
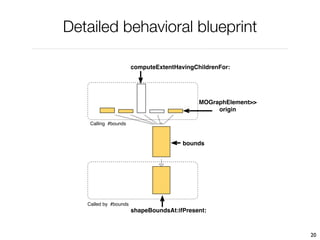
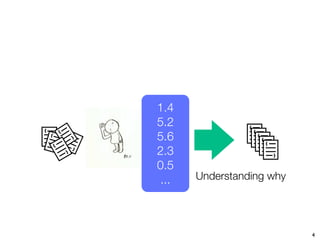
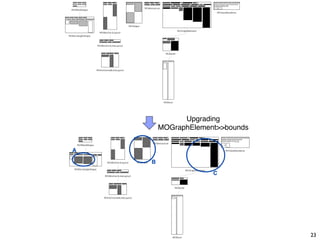
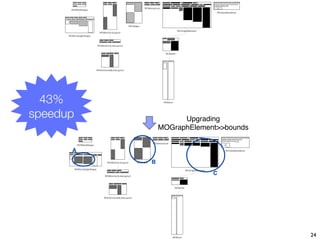
![Code of the bounds method
MOGraphElement>>bounds
"Answer the bounds of the receiver."
| basicBounds |
self shapeBoundsAt: self shape ifPresent: [ :b | ^ b ].
basicBounds := shape computeBoundsFor: self.
self shapeBoundsAt: self shape put: basicBounds.
^ basicBounds
21](https://image.slidesharecdn.com/2010-profilingblueprinttools-100708083345-phpapp02/85/Profiling-blueprints-21-320.jpg)
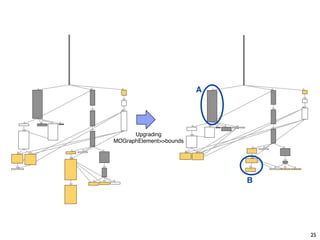
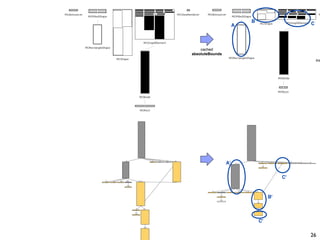
![Memoizing
MOGraphElement>>bounds
"Answer the bounds of the receiver."
| basicBounds |
boundsCache ifNotNil: [ ^ boundsCache ].
self shapeBoundsAt: self shape ifPresent: [ :b | ^ b ].
basicBounds := shape computeBoundsFor: self.
self shapeBoundsAt: self shape put: basicBounds.
^ boundsCache := basicBounds
22](https://image.slidesharecdn.com/2010-profilingblueprinttools-100708083345-phpapp02/85/Profiling-blueprints-22-320.jpg)
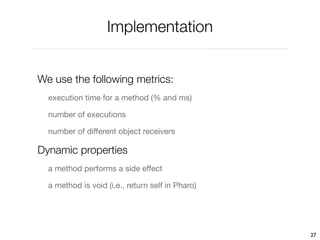
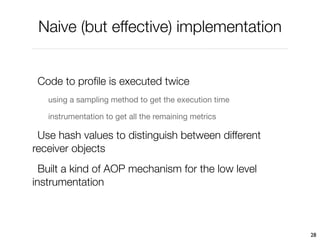


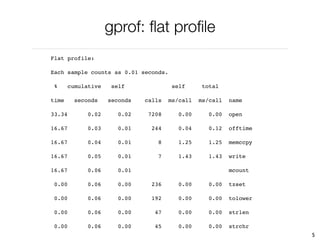
The document discusses the visualization of dynamic metrics in profiling through the use of blueprints, highlighting the limitations of traditional profiling tools like gprof in understanding performance issues. It presents a roadmap for enhancing profiling with polymetric views and specific implementation techniques in Pharo Smalltalk, aimed at better metric collection and visualization. The conclusion emphasizes the effectiveness of these visualizations in identifying optimization opportunities while suggesting future enhancements for comprehensive metric tracking.


![Script md a[1]](https://cdn.slidesharecdn.com/ss_thumbnails/script-mda1-101011070309-phpapp01-thumbnail.jpg?width=640&height=640&fit=bounds)