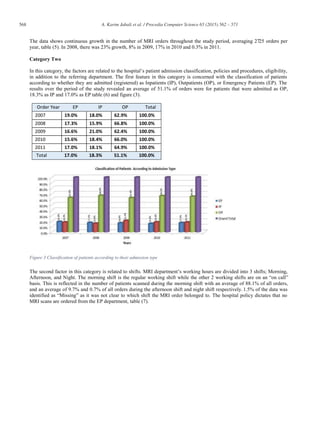
This document discusses key factors that influence MRI utilization at King Fahd Hospital of the University in Saudi Arabia from 2007-2011. The study analyzed patient demographic data such as age, gender, city of residence, and nationality. It found that 55% of patients were between 30-60 years old, orders were almost evenly split between males and females, most patients lived in Khobar city, and around 80% of patients were Saudi citizens. The document aims to promote effective MRI utilization, address over and under usage, and improve regulations and workflows within hospitals in the region.
![Procedia Computer Science 65 (2015) 562 – 571
1877-0509 © 2015 The Authors. Published by Elsevier B.V. This is an open access article under the CC BY-NC-ND license
(http://creativecommons.org/licenses/by-nc-nd/4.0/).
Peer-review under responsibility of Universal Society for Applied Research
doi:10.1016/j.procs.2015.09.131
ScienceDirect
Available online at www.sciencedirect.com
International Conference on Communication, Management and Information Technology (ICCMIT 2015)
Key factors influencing the usage of MRI in Saudi Arabia
A.Karim Jabalia
, Khalid Yousuf Faridb
, Abdel-aziz Matanib
, Fatma Al Mulhimc
a
Corresponding author, Associate Professor, Health Information Management and Technology Department, College of Applied Medical Sciences,
University of Dammam, Eastern Provence, Saudi Arabia.
b
Assistant Professor, Radiological Sciences Department, College of Applied Medical Sciences, University of Dammam, Eastern Provence, Saudi
Arabia.
c
Professor, Radiology Department Head, King Fahad Hospital of the University (KFHU), University of Dammam, Eastern Provence, Saudi Arabia.
Abstract
This article explores the current status of MRI utilisation trends in King Fahd Hospital of the University (KFHU), as one of
the major government hospitals of the Eastern Province in Saudi Arabia. The study covers a period of five years (2007-
2011). The factors and indications of utilisation levels were identified, grouped and categorised according to their nature
and according to their impact on MRI utilisation. Among other results it was revealed that the portion of “Non-Eligible”
patients underwent MRI scan is not negligible (≈9%).
The results showed serious obstacles in data collection so not all factors were found and incorporated in the analysis. Other
utilisation factors of diagnostic imaging procedures- need to be considered carefully in respect to the appropriateness and
effectiveness of policies and planning procedures. The outcome of this study is a start and can be benchmarked to other
similar research studies in the field covering other hospitals and medical establishments in the region.
Key Words: MRI, Utilisation, Teaching Hospital, Eastern Province, Saudi Arabia.
Introduction
Magnetic Resonance Imaging (MRI) is a form of non-invasive medical examination that greatly facilitates the diagnoses of
wide-ranging medical conditions. MRI scanners do not use ionizing radiation rather they use a powerful static magnetic
field, varying magnetic fields, radio frequency pulses and computer processing to produce detailed images of organs’ soft
tissues and practically all other internal body structures.
To be effectively utilised MR images can be displayed on the scanner’s computer monitor, transmitted electronically to
workstations, printed or copied to any storage device e.g. hard drive, CD, DVD, magneto-optical and optical desks. MRI is
mainly used with cases that cannot be assessed adequately with other more common and cheaper imaging modalities such
as X-rays, ultrasound (US) or computed tomography (CT) [1].
With today’s escalating cost of health services coupled with economic recession in addition to the fact that Saudi healthcare
system is currently being transformed from government financed and managed welfare system to a market oriented and
employment based insurance driven system, there is an urgent need to re-evaluate and reduce healthcare expenditures
without sacrificing the quality of patient care.
Medical imaging in particular MRI is of high cost services that needs to be transformed to be more rational and more
economic.](https://image.slidesharecdn.com/a75c7693-fc7c-47da-a649-1fb1be56a5d9-160316174541/85/mri-key-factor-fatma-1-320.jpg)
![563A. Karim Jabali et al. / Procedia Computer Science 65 (2015) 562 – 571
The cost and quality of provided health services is directly linked to the proper management of the available resources [1].
Utilisation management encompasses a set of activities designed to influence the use of the health service, like MRI, and
hence constrain their consumption [1]. Huge growth and rapid developments in imaging technology are raising concerns
about the appropriate utilisation of available MRI services. Medical imaging, including MRI, are one of the reasons health
costs are rising so rapidly and insurance that covers the cost of such service has become unaffordable for middle class
people in countries like the USA for instance [1]. Because of the spiralling costs, some medical establishments have started
resorting to outsourcing instead [1, 2], increasing working hours, renting MRI scanners [1] or rearranging patients’
management strategies, by separating inpatient from outpatients to cut waiting time and using paperless and PACS to
reduce expenses and speed up administration work [3-5]. This change raises the need to study medical service utilisation in
order to maximise efficiency and minimise expenditure.
So we can say that “utilisation” is a branch of science dedicated to the measurement of how effective the use of a service,
within an establishment, is compared to some predetermined reference values. Sounds common sense, dictates poor MRI
use, costs time and money, but unfortunately measurement of the extent of its use, or lack of it, is not a straight forward
process [6] because there is a countless number of influencing factors involved [7]. These factors differ in the degree of
their influence depending on the specific case studied. Apart from a few exceptions, [5, 8] comprehensive studies related to
MRI utilisation is not as common as needed in literature. Some medical establishments used computer programs to improve
tracing MRI use and utilisation [6], and some specialised studies focused on emerging trends by comparing MRI utilisation
with other techniques’ utilisation, such as diagnostic arthroscopy, to see if MRI is actually replacing this traditional
technique, because the increase of MRI use and decrease of the particular technique use, seems to suggest so [7].
Furthermore, despite the importance and wide spread of MRI technology, the idea to investigate the utilisation profile of
MRI is an almost untouched area by researchers in many developing countries. Likewise locally in KSA the topic has not
been explored enough, although there are some studies that touch it indirectly as [9]. So the topics of utilisation of medical
equipment, including MRI, is an emerging topic and this research work can form a crucial addition of a high value to
healthcare management and technology research and exploitation in the region.
Generally, physicians are not in favour of developing medical service utilisation or its managements’ activities because
they see it as restrictive to their work and involves an intolerable, administrative burden. However stakeholders think
otherwise and see utilisation management, although imperfect, as a necessary practice [4]. During the last two decades,
conferences and symposiums were regularly held to discuss research work on different aspects and issues associated with
MRI and other types of radiological imaging [10]. In most cases “cost effectiveness” is the key and knowing how to
measure this factor will determine if the investment was worth it [5]. Many studies aimed to expose ineffective MRI use; for
instance, it was found in a USA military study that 62% of MRI scanning to the knee was unjustified hence incurring
unnecessary resources depletion [11].
In each case, as it seems, there are always dominant factors that greatly influence MRI utilisation. In countries like USA and
Japan for instance, it was found that “Volume” is what makes considerable difference in effective MRI utilisation because
volume is what keeps “ends meet”. So analysing the MRI volume market there is an essential action needed to help
dependent organisations survive [8]. In Sweden however, it was found that in spite of a homogeneous medical care system
and services across the country, effective MRI utilisation with dissemination, access and use varied tremendously from
region to region. In depth research showed that the socio-demographical factors such as age variations and regional
population fluctuation are what play an influencing role in this case [12]. It was concluded that the high maintenance and
operating costs of MRI scanners, account for the low numbers of scanners in the country [13]. A study in Turkey that
covered the trend use of MRI scanners from 1995 to 2003, recognised the factor: “utilisation rates of new diagnostic
imaging procedures” such as MRI, as a key issue and emphasised that this factor needs to be considered carefully with
respect to appropriateness of policies and procedures and planning of medical imaging services [14].
Most recently in the light of economic crisis faced by many countries, particularly in Europe, in the UK reports by tax
payers alliance organisations are increasingly being published. These reports go deep into scrutinising government health
service, including MRI utilisation, and in some cases expose, with evidence, the inadequacy of many NHS Trusts in
utilising such an expensive, but essential, medical service. The main factor considered in the UK report is the relative
comparison of the usage rate of scanners in different trusts [15]. In Japan, some cases have proved to be difficult to decide
upon as far as MRI Utilisation is concerned, such as terminal illness cases [16].](https://image.slidesharecdn.com/a75c7693-fc7c-47da-a649-1fb1be56a5d9-160316174541/85/mri-key-factor-fatma-2-320.jpg)
![566 A. Karim Jabali et al. / Procedia Computer Science 65 (2015) 562 – 571
Another feature of MRI utilisation in this category is the spread of orders between male and female patients. In this
context, it is shown that the average distribution of MRI orders with respect to gender shows that 48.7% of scans were
prescribed for female patients and 51.3% were for male patients, table (2).
Table 2 Gender of MRI patients over 5 years
Year F M
2007 49.0% 51.0%
2008 46.8% 53.2%
2009 48.9% 51.1%
2010 48.6% 51.4%
2011 50.0% 50.0%
Average 48.7% 51.3%
These percentages correlate closely to national statistics of the population, 49.8% females and 50.2% males [17].
It was also found that Khobar city is the major city in which, 51.9% of served patients, actually live. While Dammam city
occupies only 19.8% of patients. Moreover 92.2 % of patients were from all other cities within the Eastern Province, while
7.8% only are from outside the region, table (3). This occurrence is allowed as all Saudi citizens, regardless oftheir place of
residence are eligible to be served in all governments’ hospitals.
Table 3 Patients’ Cities of residence
City Frequency Percentage
Khobar 7070 51.9%
Dammam 2701 19.8%
Dhahran 1180 8.7%
Qatif 811 6.0%
Ehsa 791 5.8%
Unknown 532 3.9%
Others 413 3.0%
Hafrulbaten 128 0.9%
Total 13626 100%
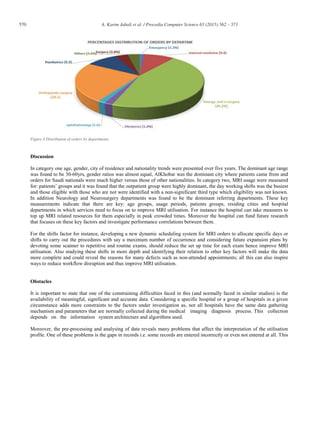
Patients who underwent MRI examinations were grouped according to their nationalities. The data show that an
average of 79.9% of the orders were for Saudi citizens and an average of 20.1% were for non-Saudis, table (4) and figure
(2).](https://image.slidesharecdn.com/a75c7693-fc7c-47da-a649-1fb1be56a5d9-160316174541/85/mri-key-factor-fatma-5-320.jpg)
![567A. Karim Jabali et al. / Procedia Computer Science 65 (2015) 562 – 571
Figure 2 Distribution of patients into Saudis and Non-Saudis
The average growth of population for both Saudi and Non-Saudis in KSA is about 3.4% in the period of the study
[17]. Saudi citizens served in KFHU has increased from 75.37% 2007 to 81.12% in 2011 and consequently, the portion of
non-Saudi patients over the period of the study ranges from 24.0% (2007) to 18.88% (2011), table (5).
Table 4 Saudi and Non Saudi patients over 5 year
Furthermore, non-Saudi patients were classified according to their nationalities and most of them were from
Egypt, India, Sudan, Yemen, Philippines, Pakistan, and Jordan with 22.8%, 11.1%, 10.0%, 9.6%, 7.6%, 6.7%,
and 6.6% respectively, table (5) .
Table 5 Non-Saudi Patients underwent MRI
Egypt 22.8%
India 11.1%
Sudan 10.0%
Yemen 9.6%
Philippines 7.6%
Pakistan 6.7%
Jordan 6.6%
Others 25.6%
Year Non Saudi Saudi
2007 24.6% 75.4%
2008 20.0% 80.0%
2009 20.5% 79.5%
2010 18.1% 82.0%
2011 18.9% 81.1%
Average 20.1% 79.9%](https://image.slidesharecdn.com/a75c7693-fc7c-47da-a649-1fb1be56a5d9-160316174541/85/mri-key-factor-fatma-6-320.jpg)


![[대한병리학회] 의료 인공지능 101: 병리를 중심으로](https://cdn.slidesharecdn.com/ss_thumbnails/pathology-201106004112-thumbnail.jpg?width=640&height=640&fit=bounds)


