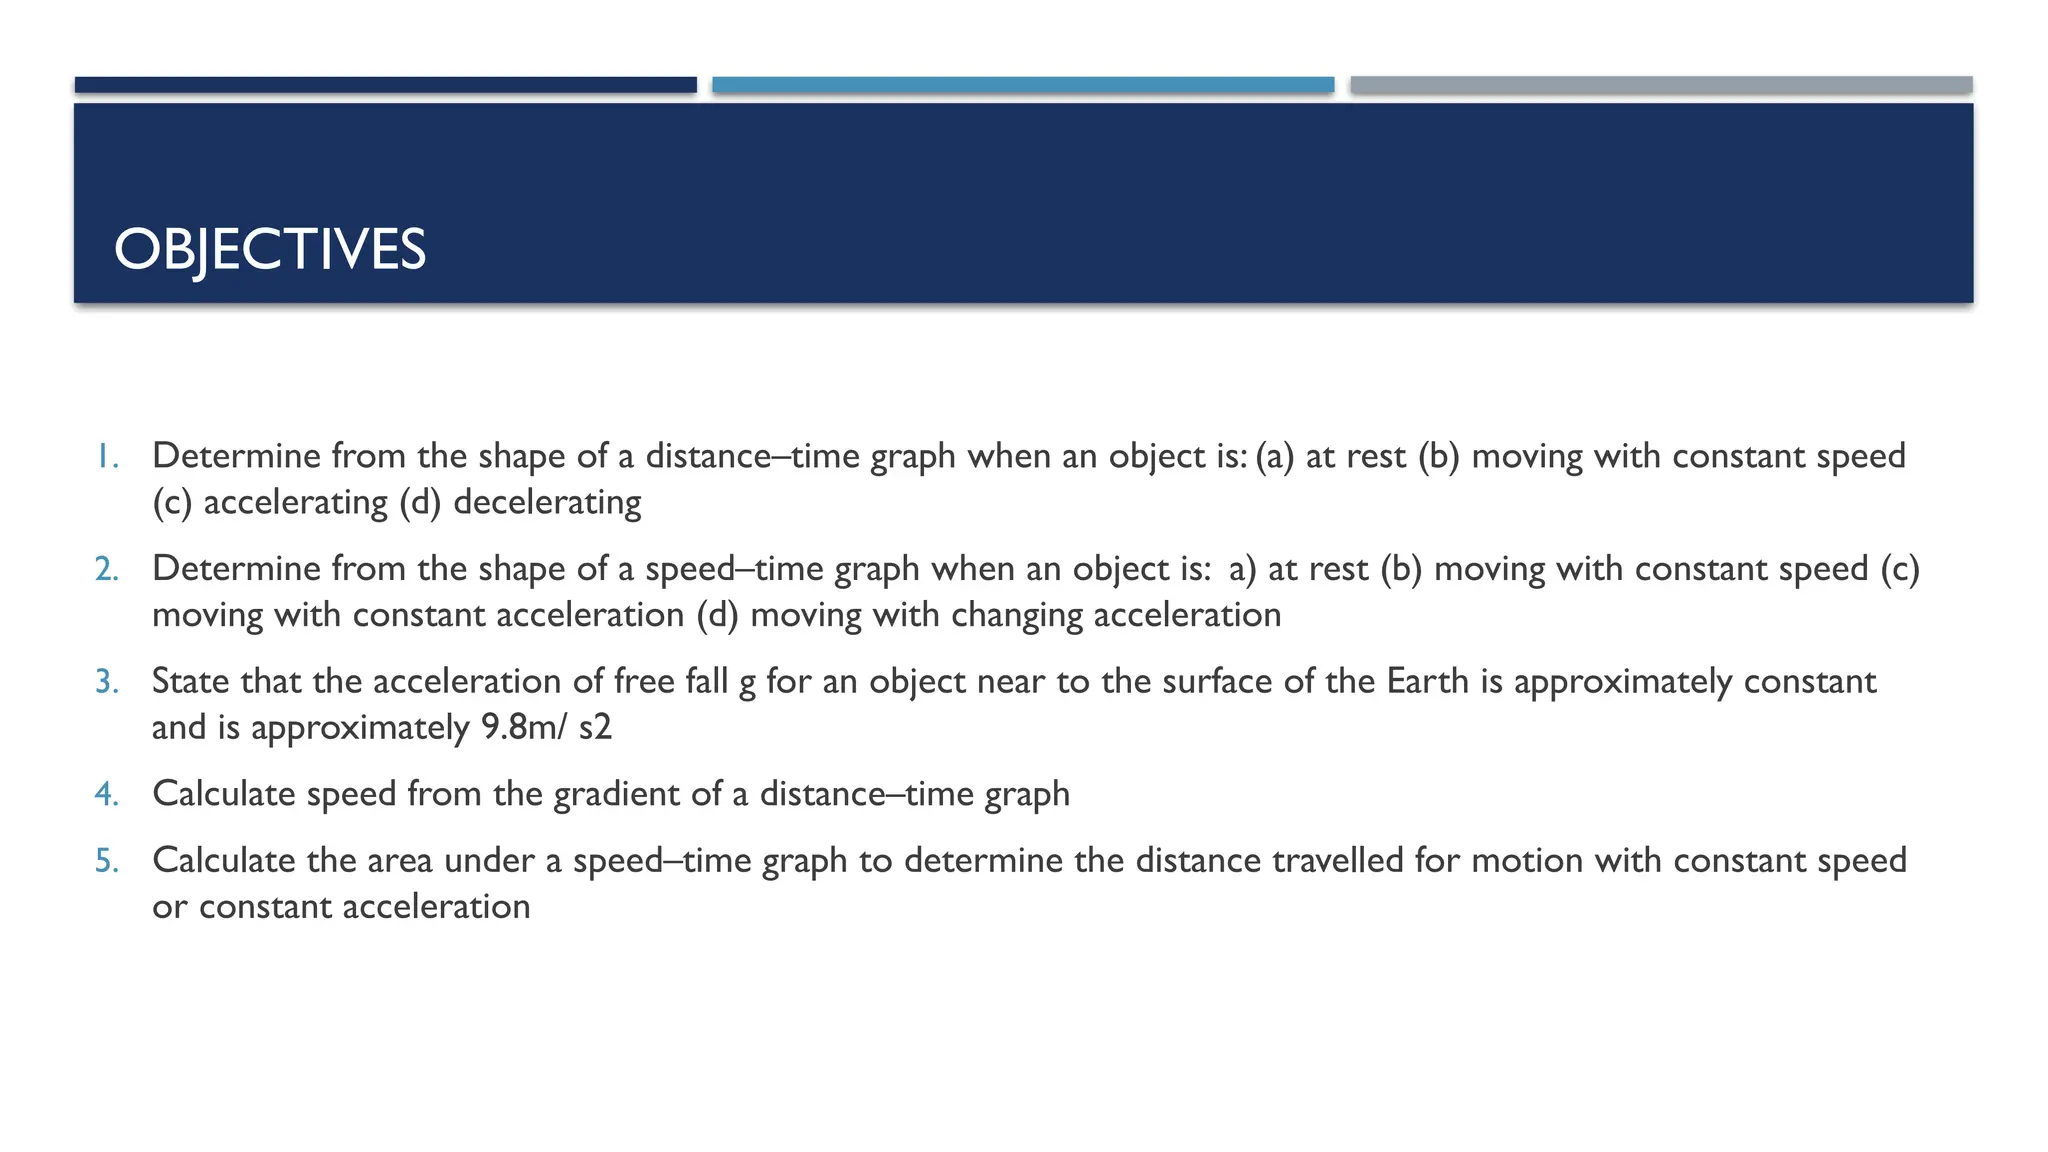
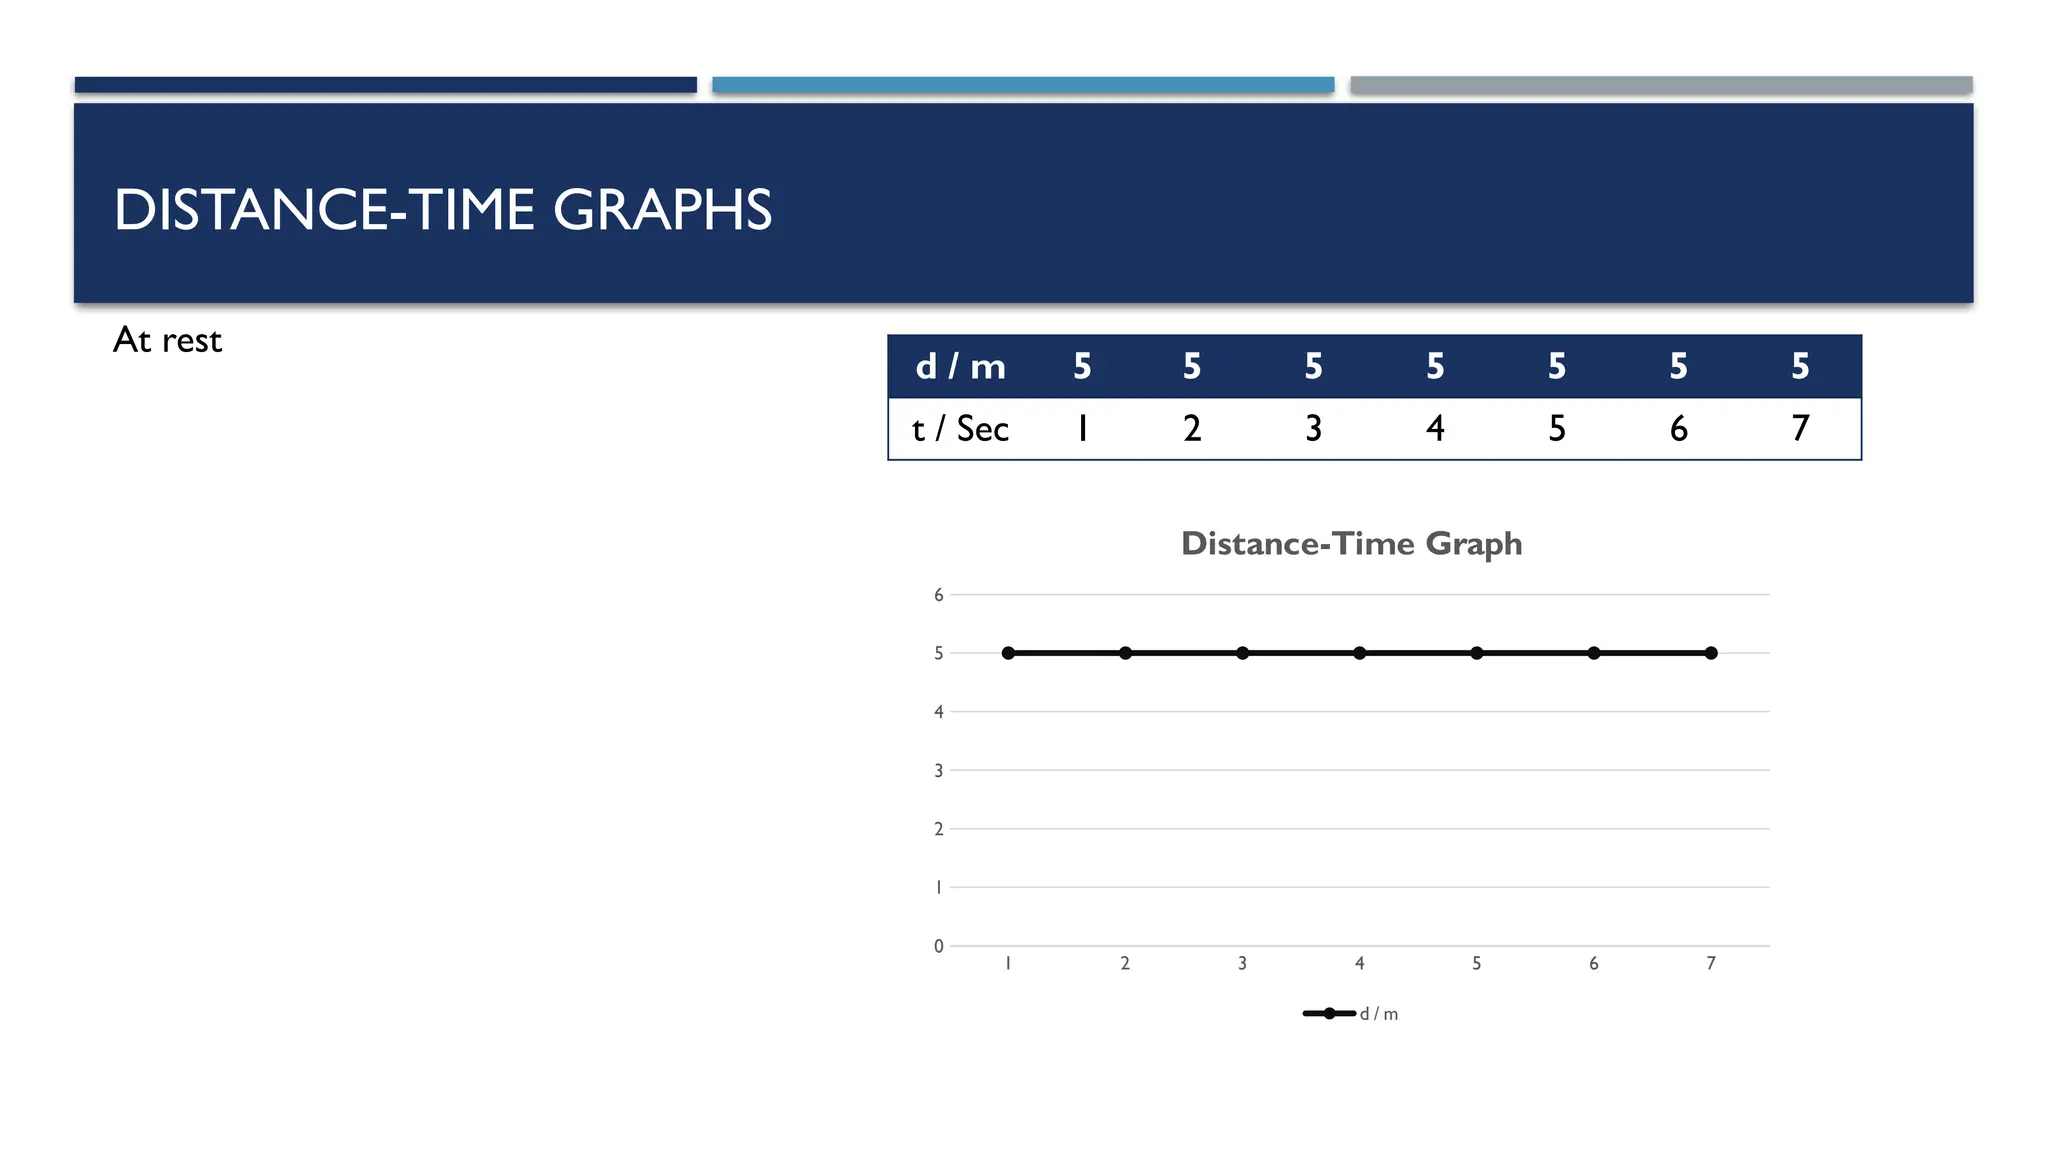
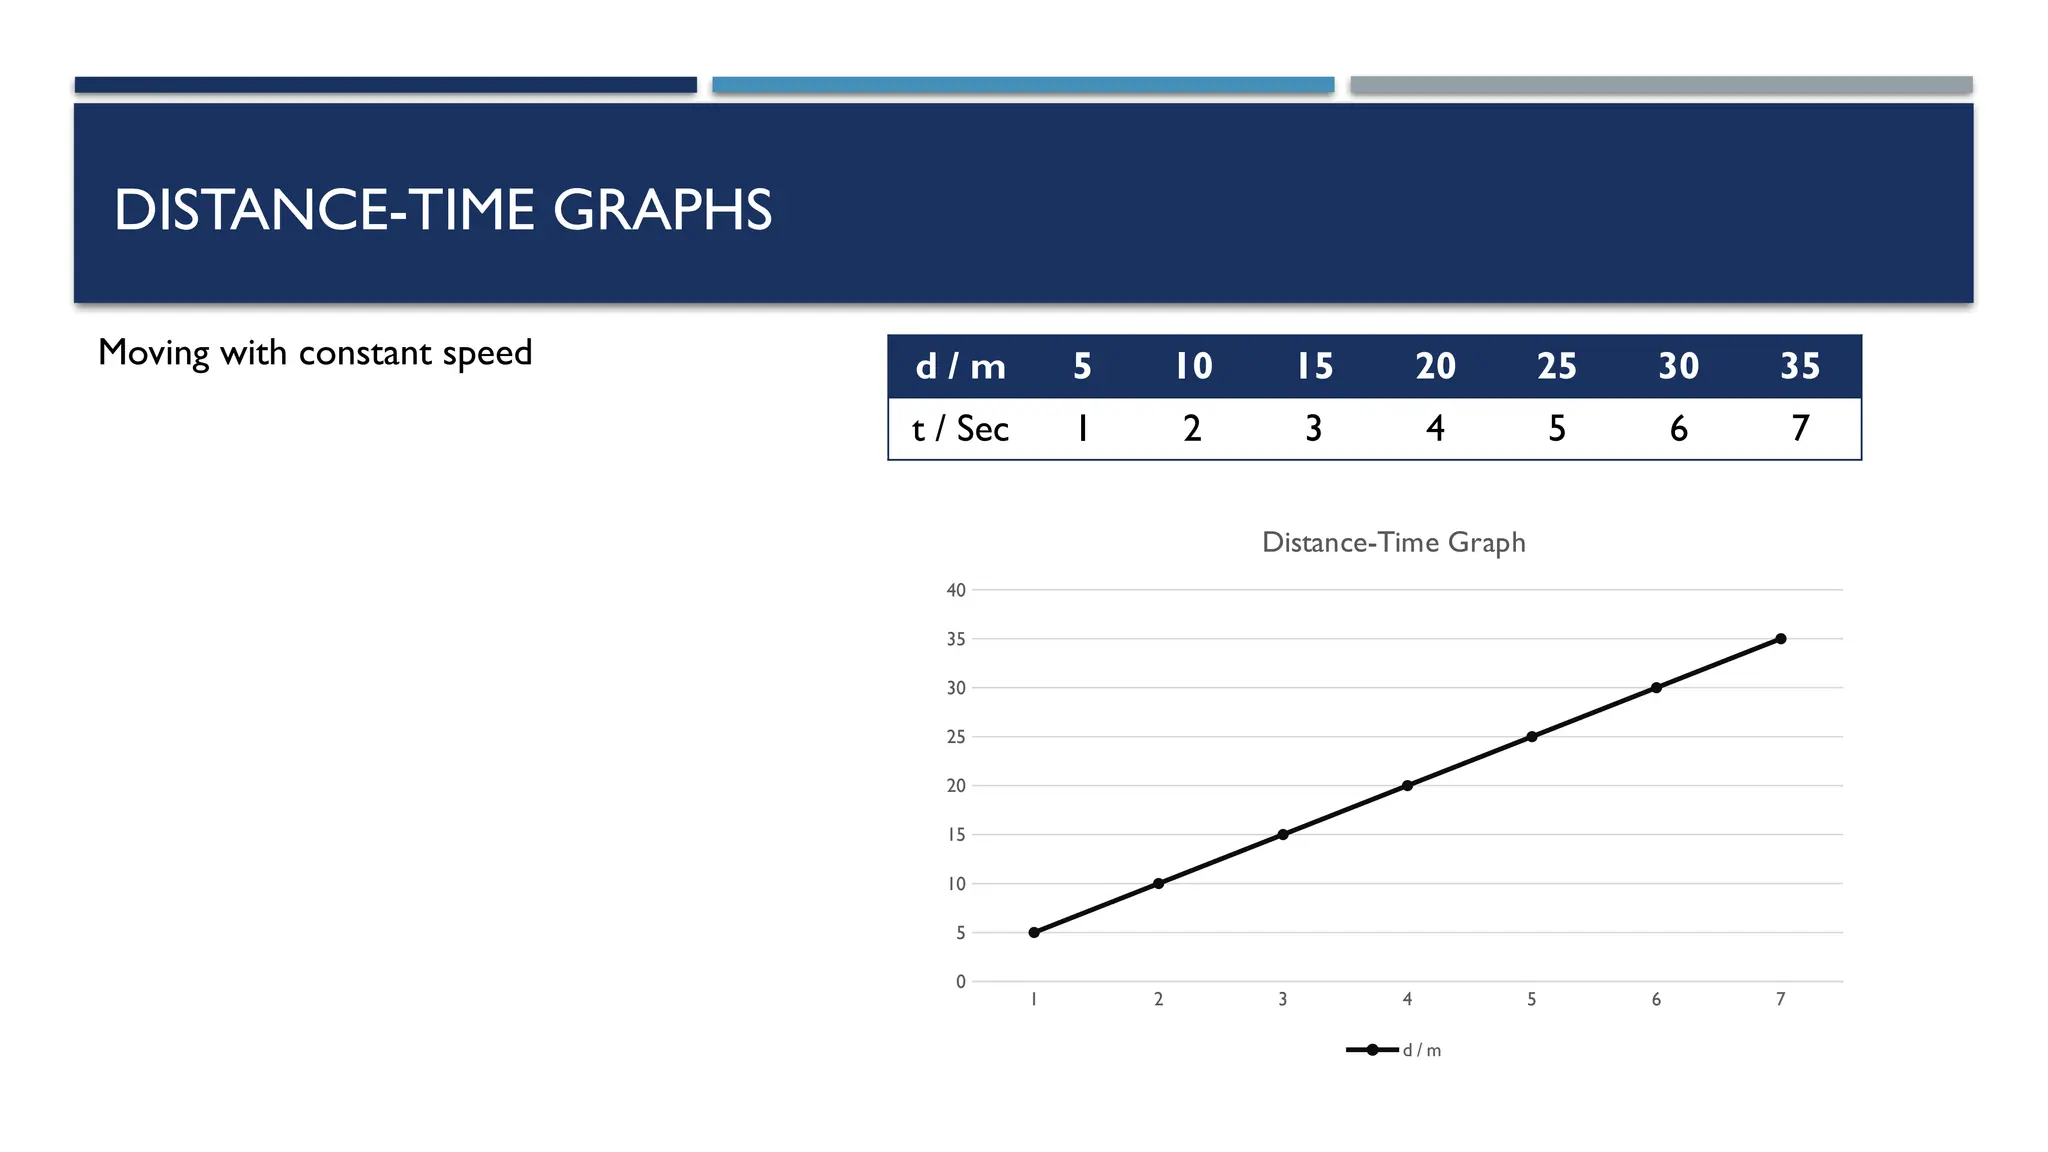
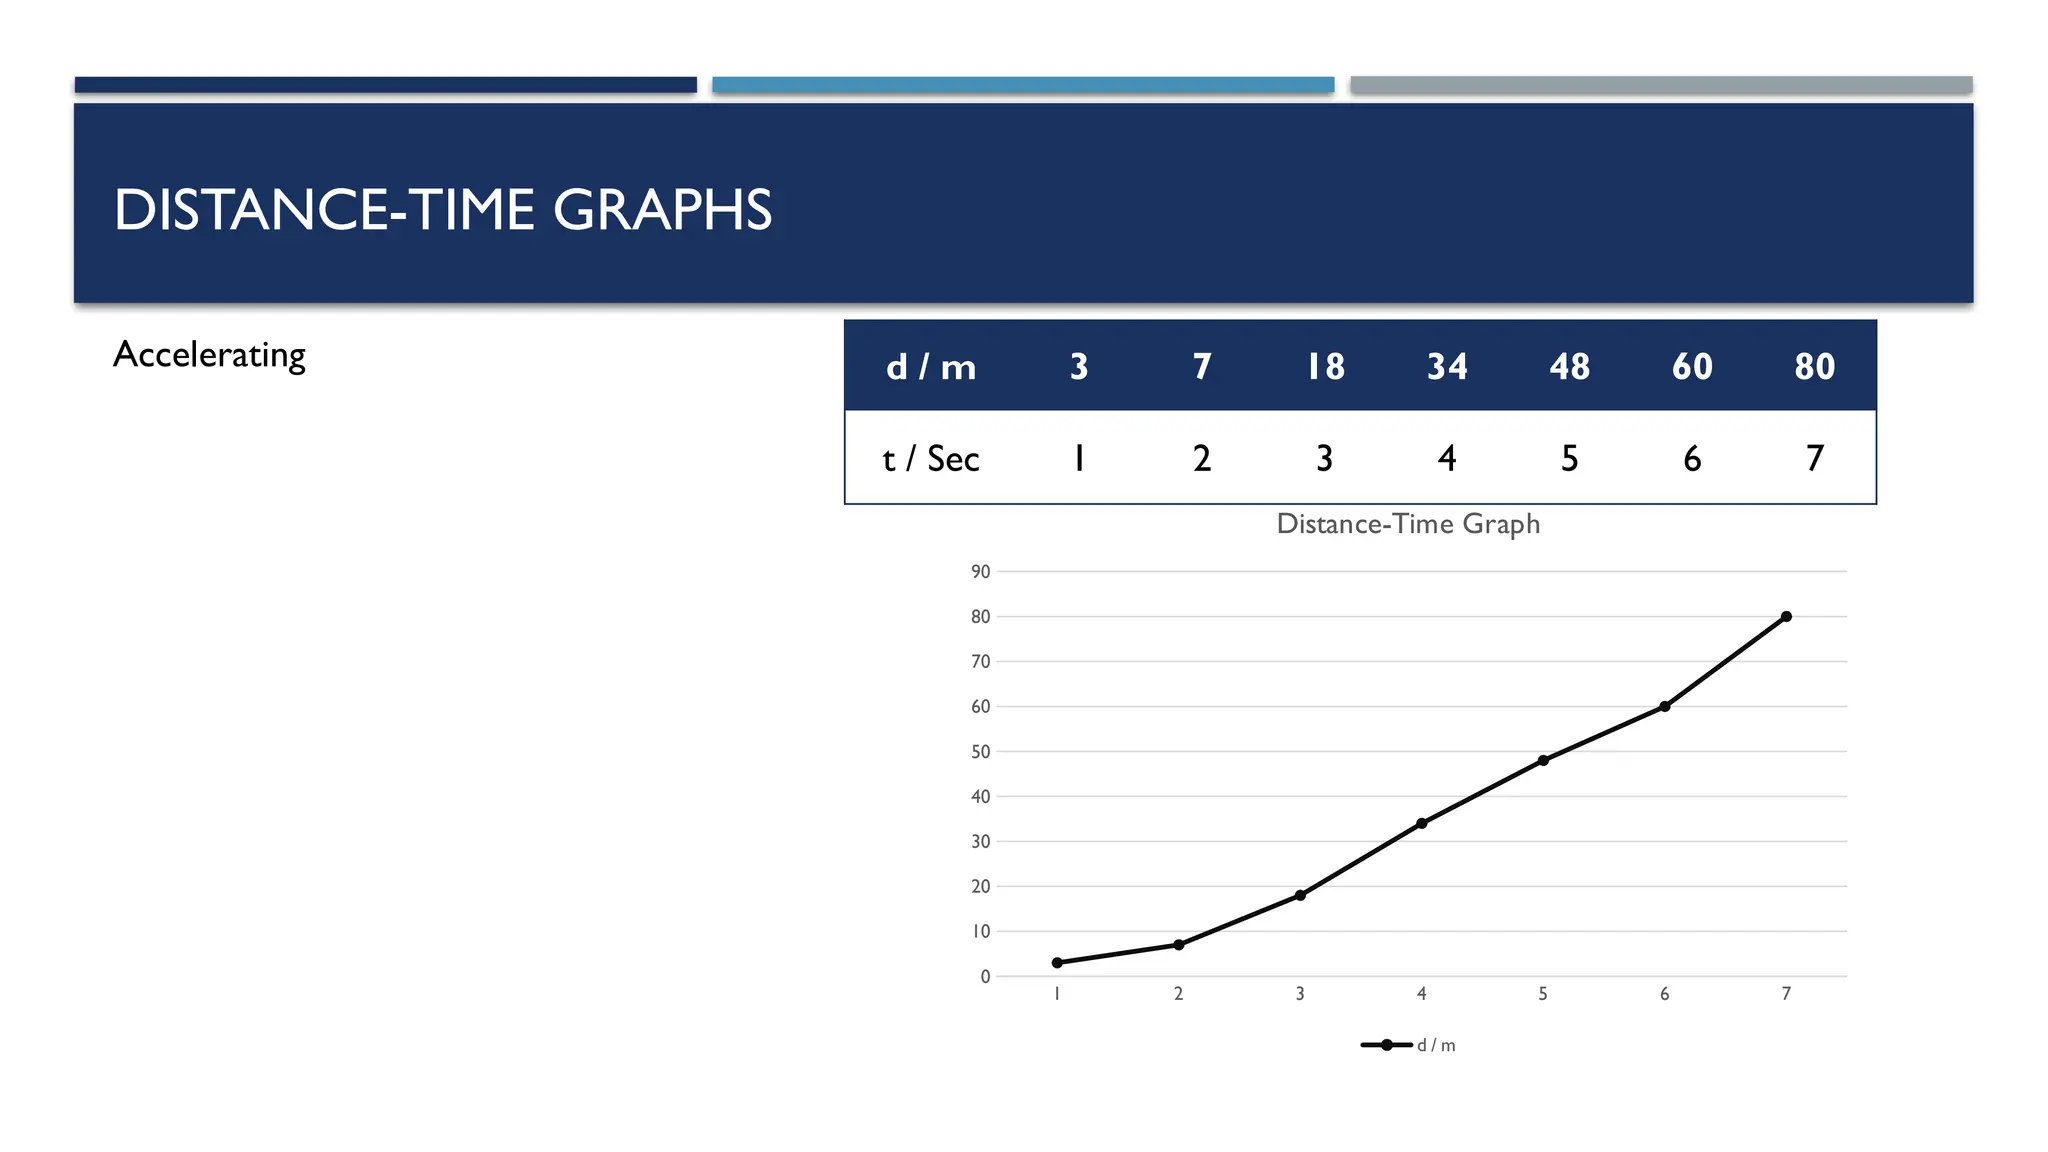
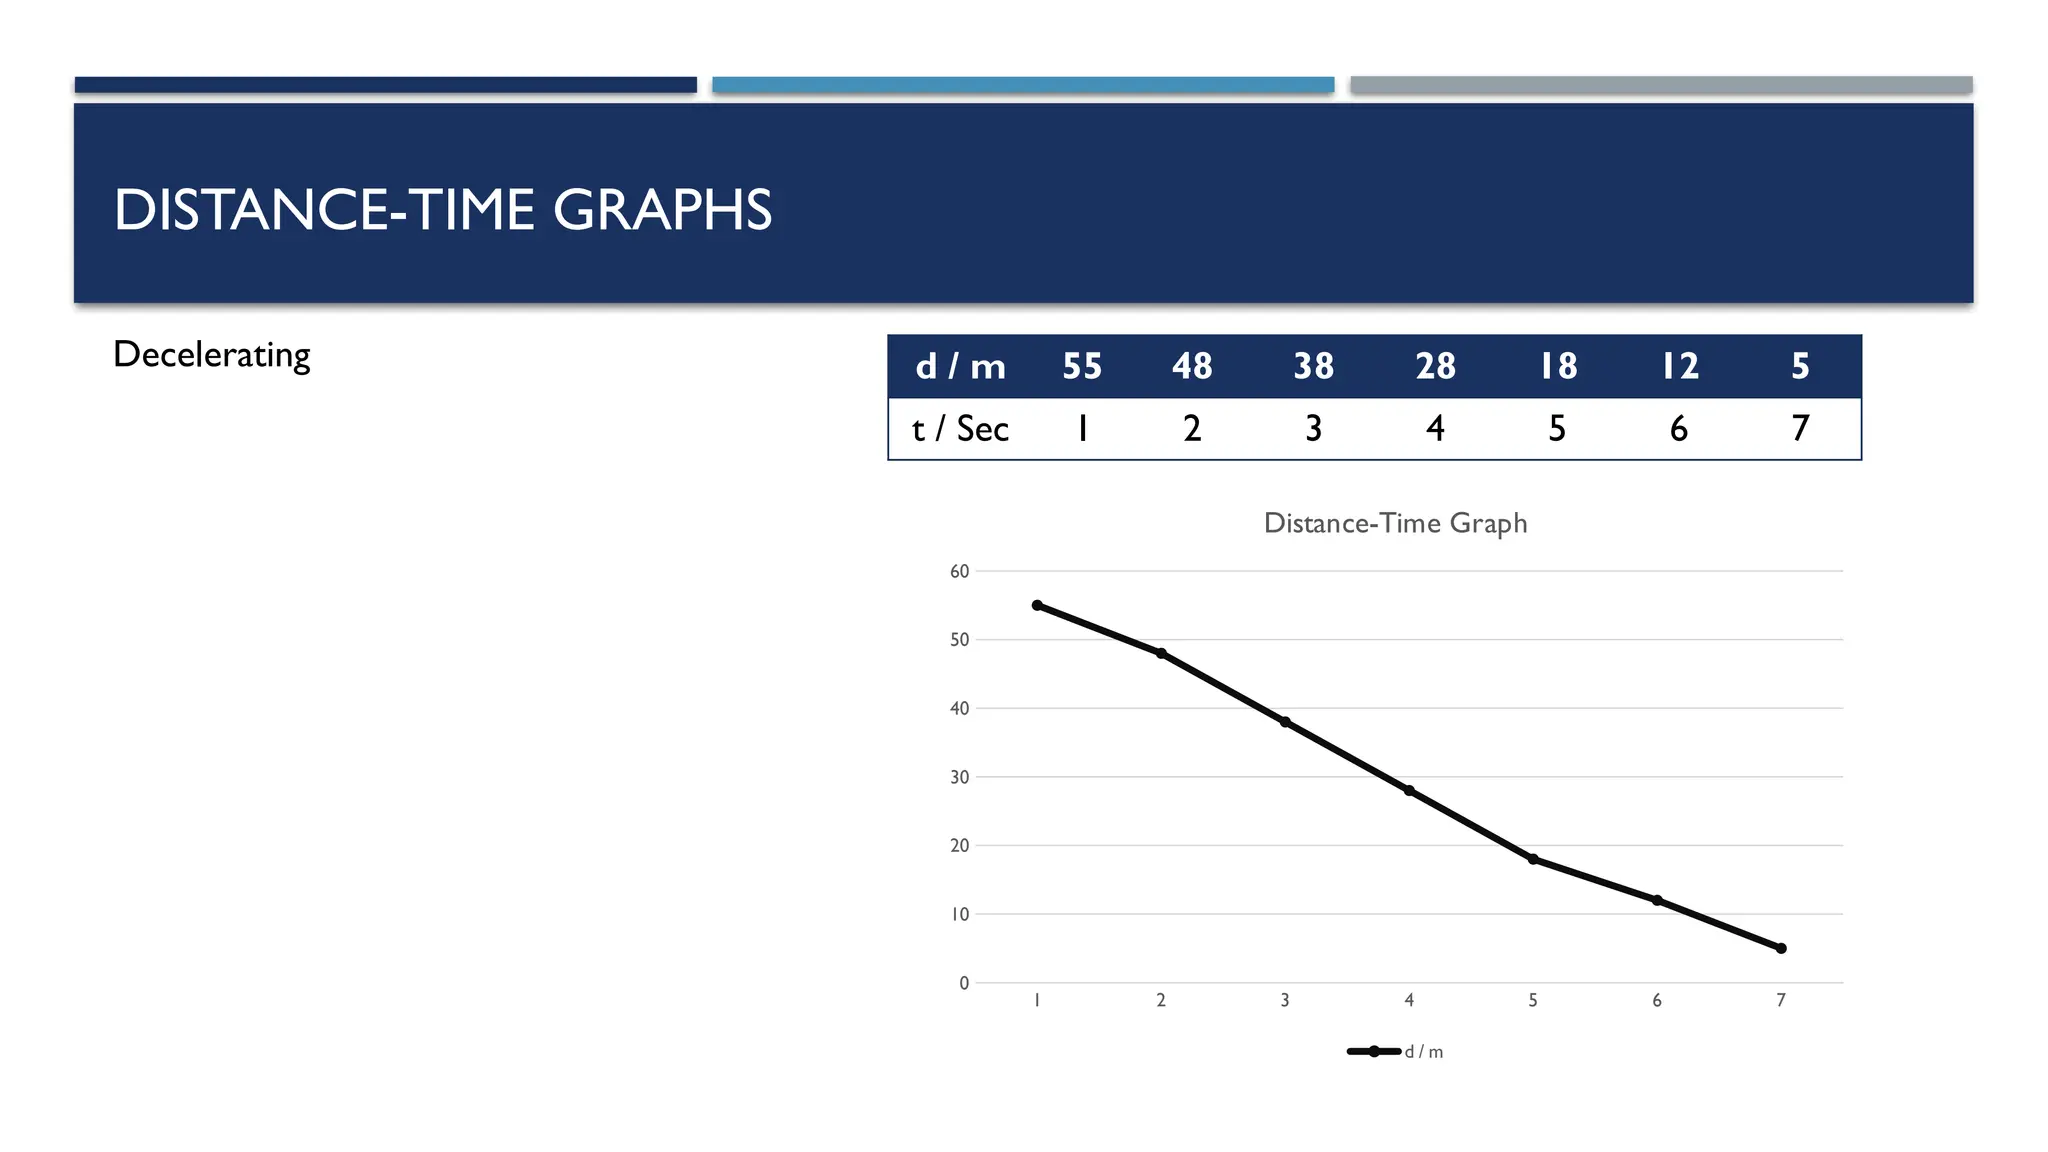
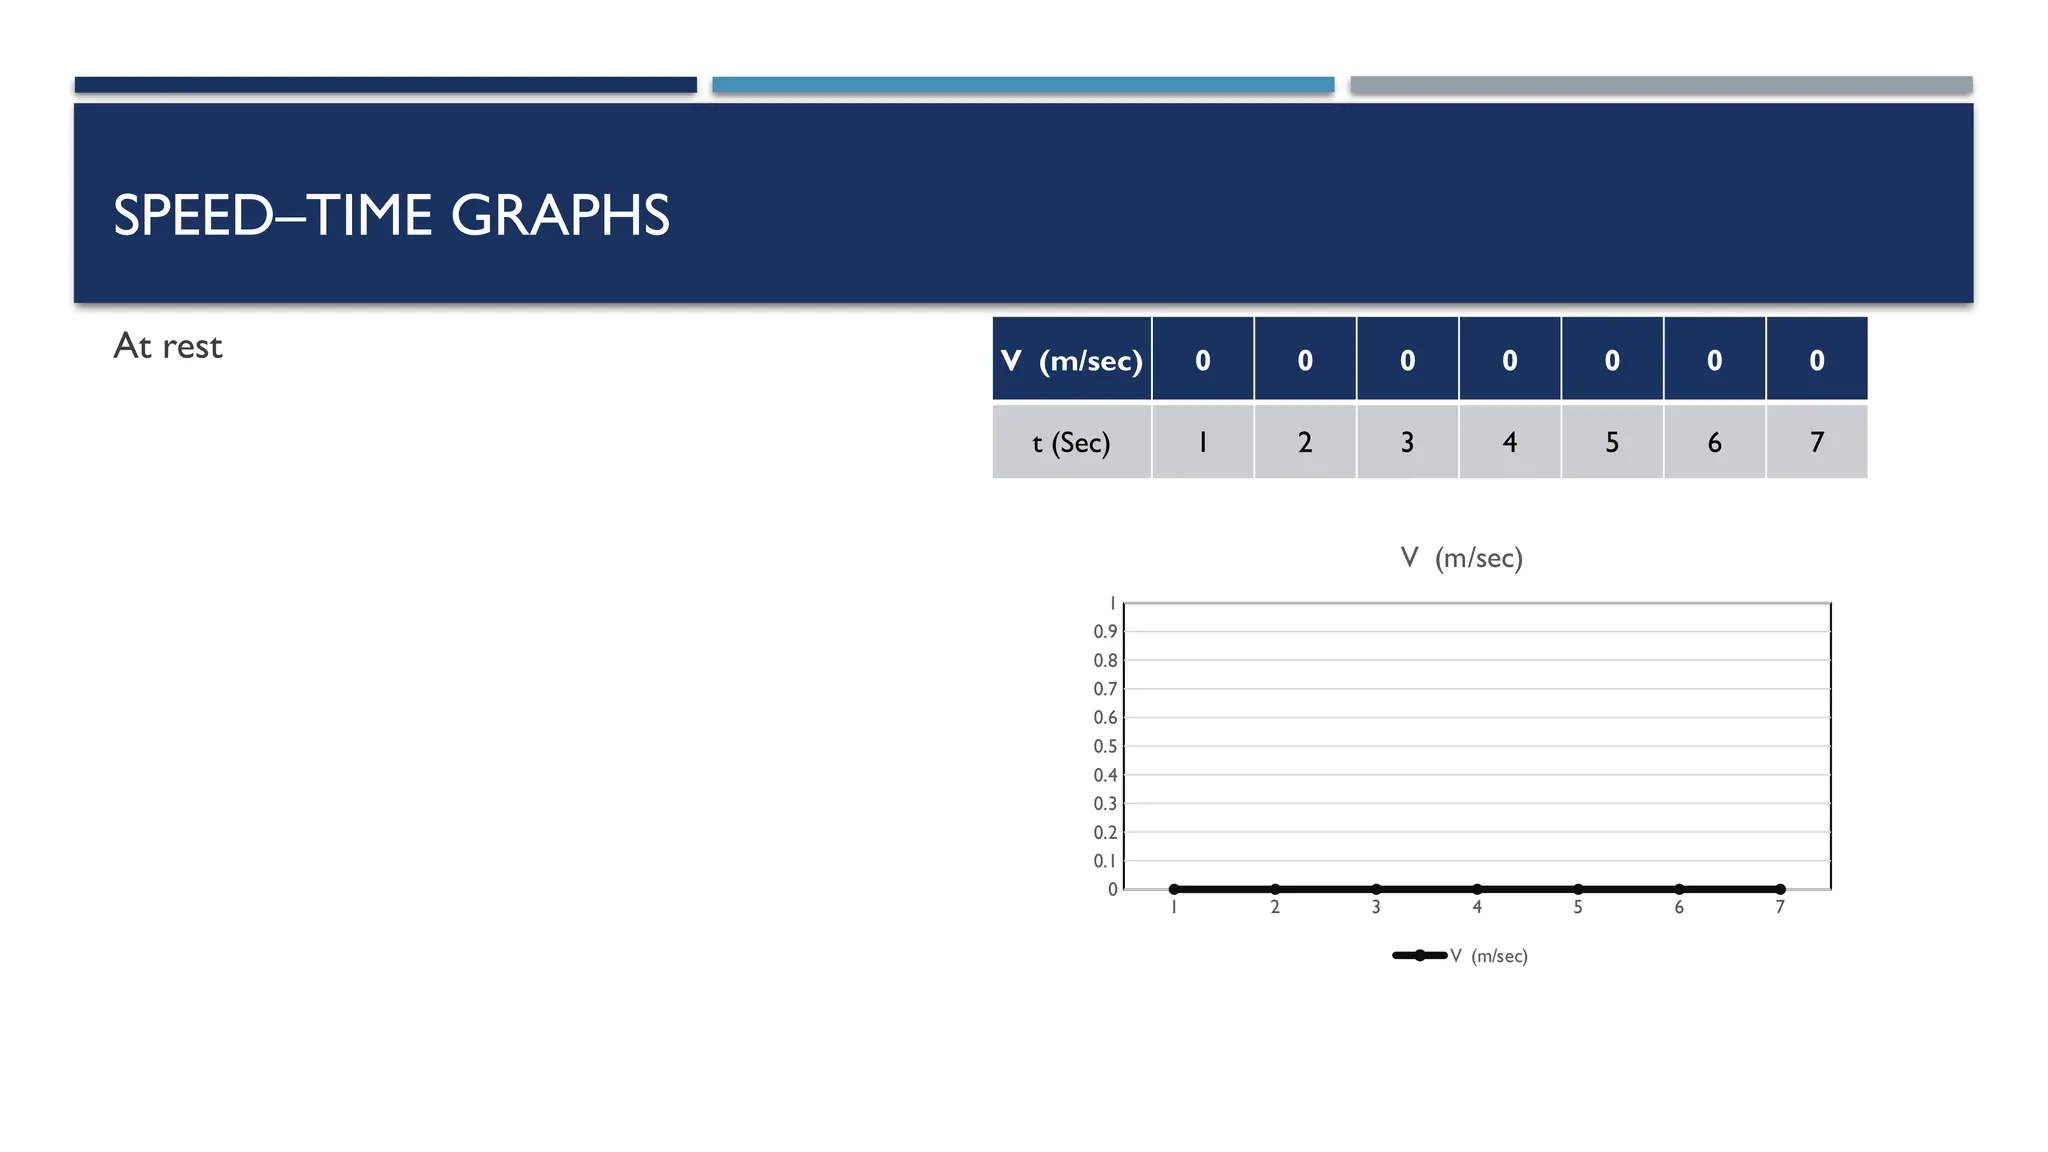
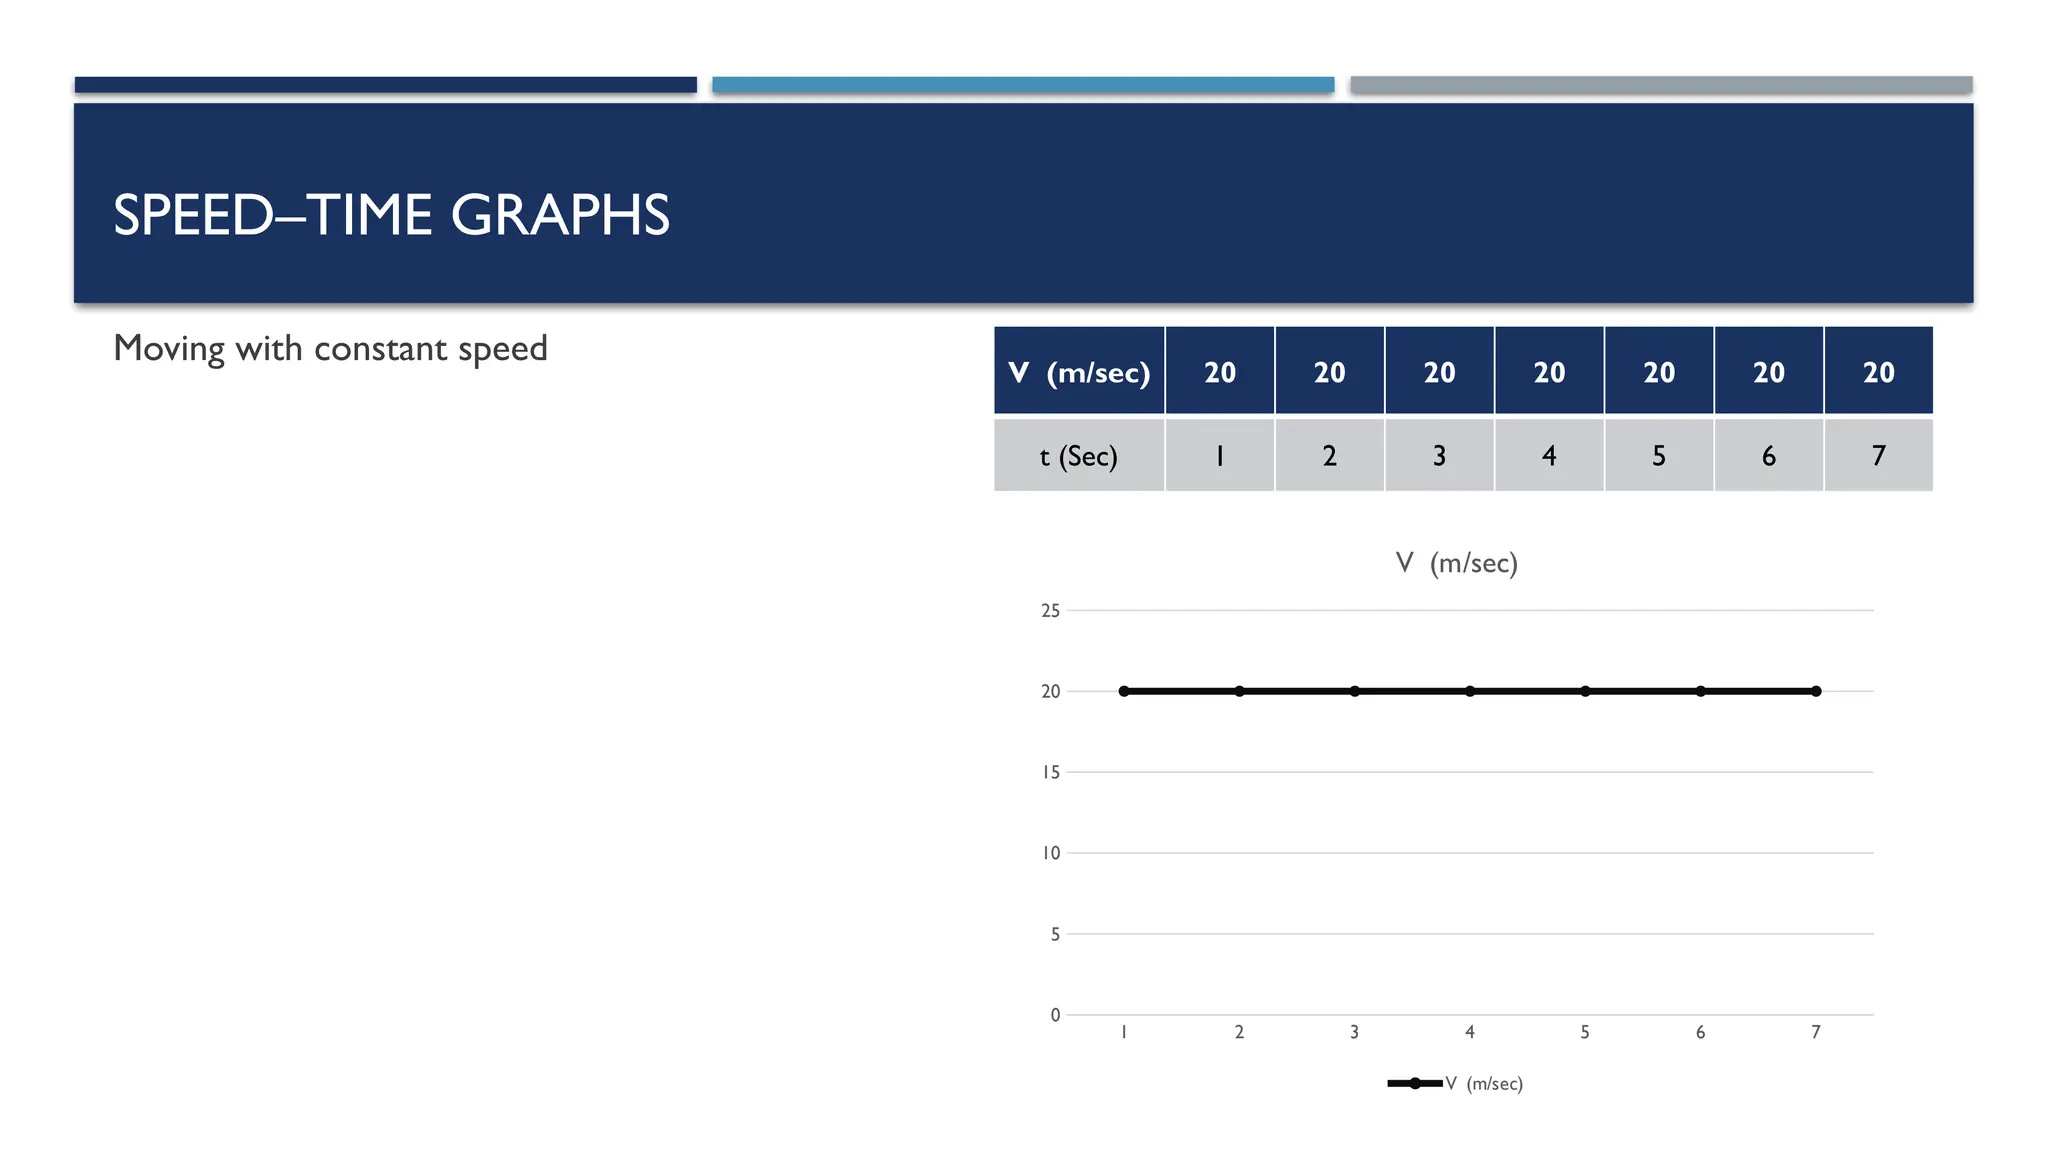
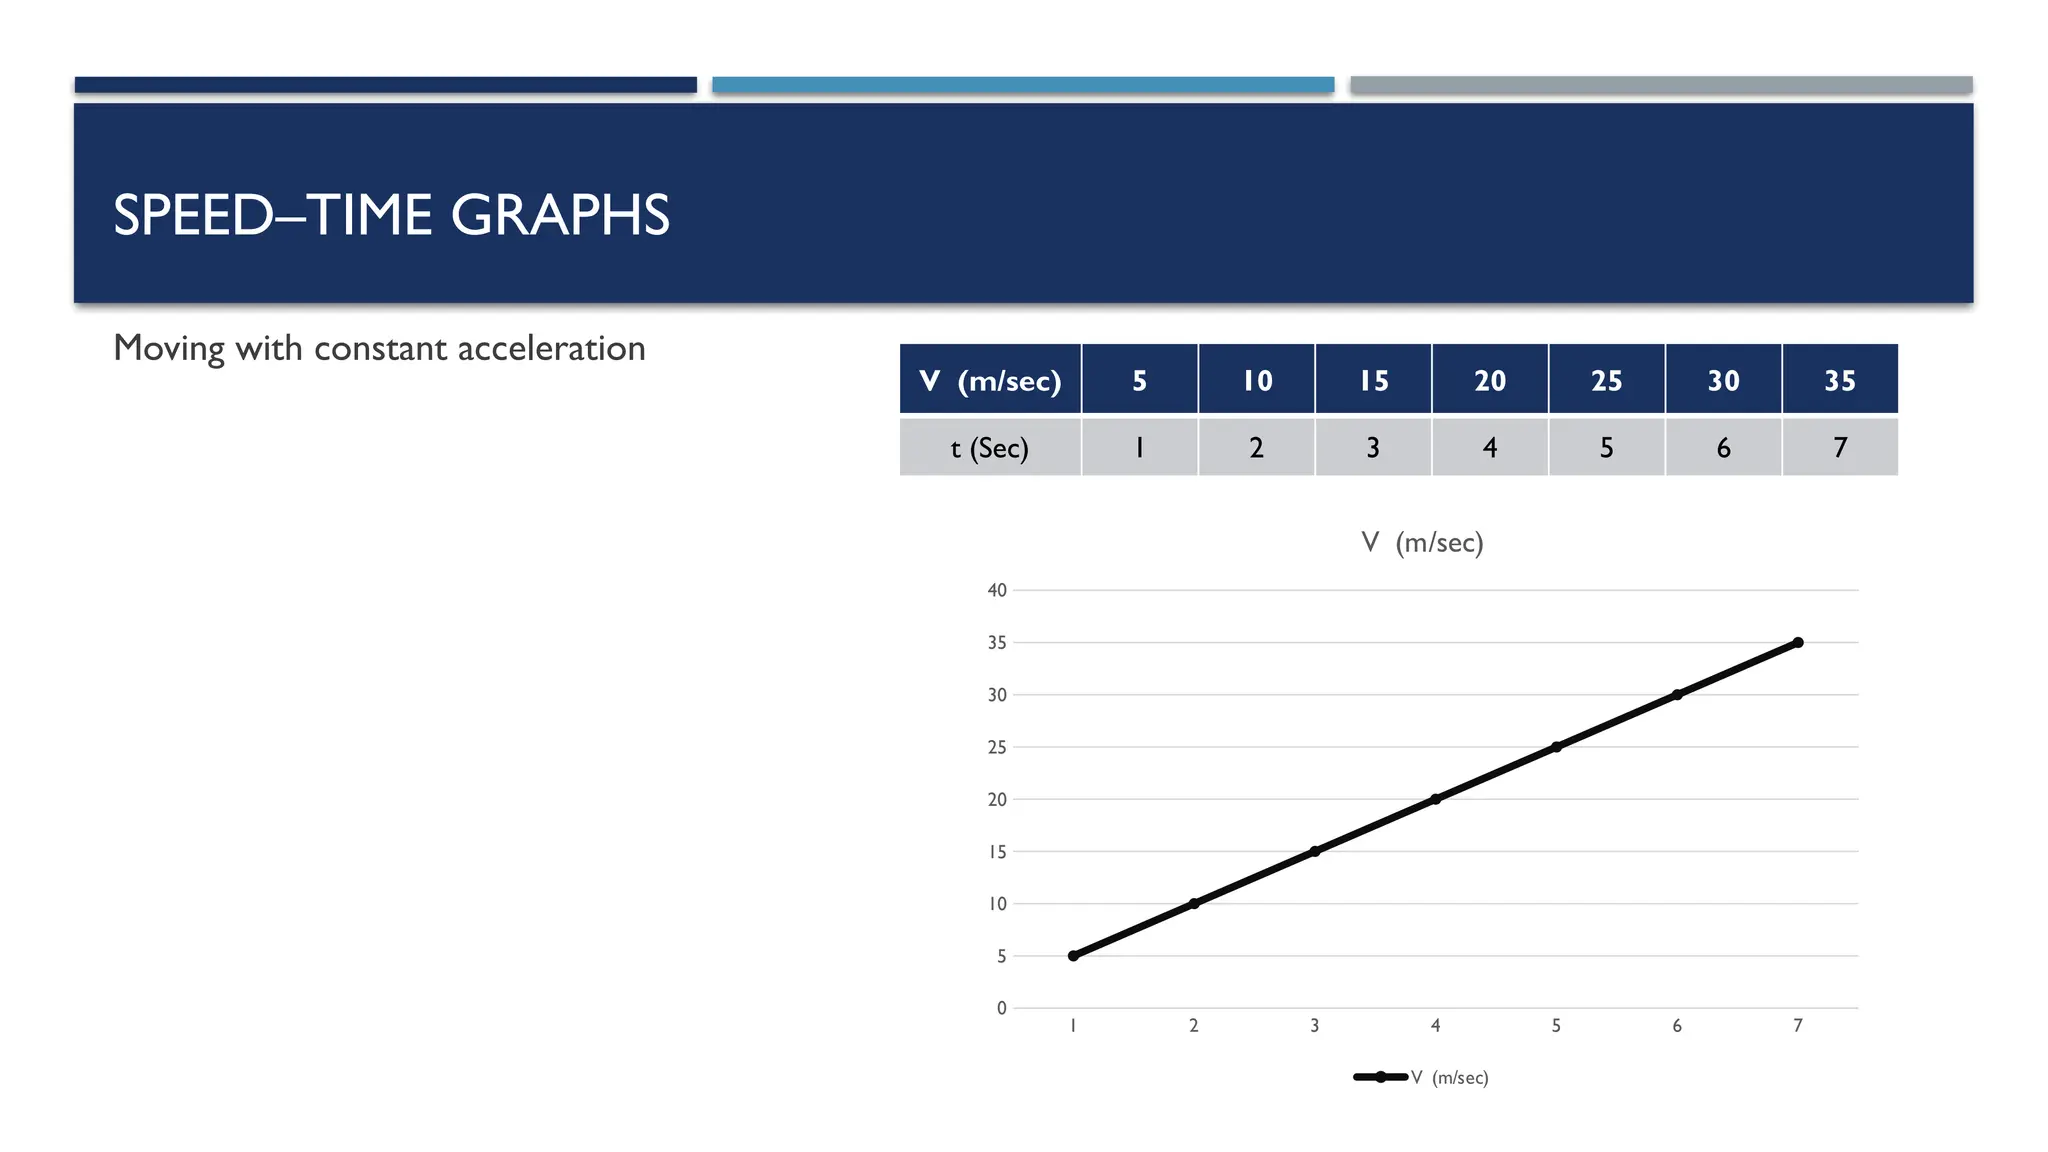
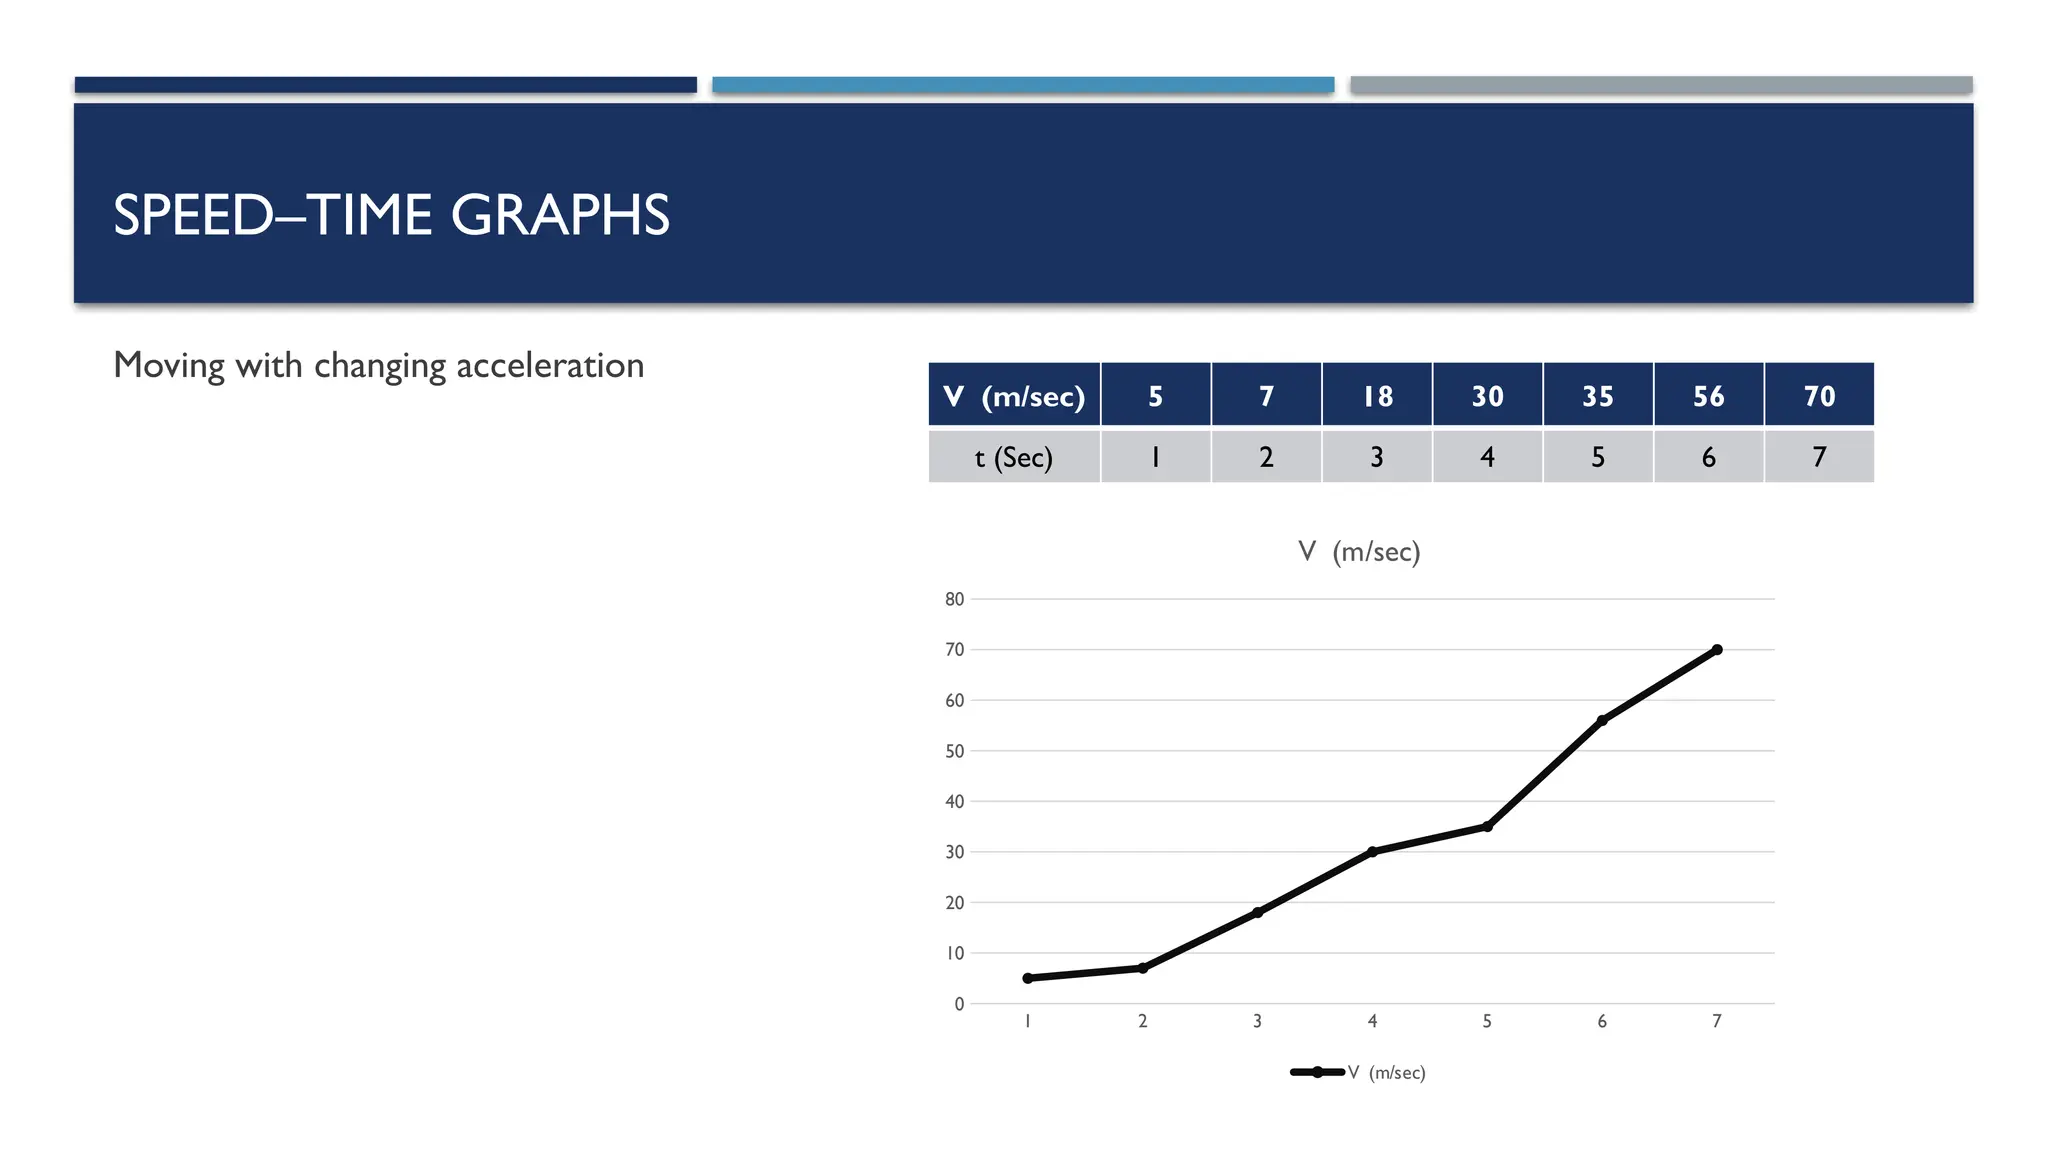
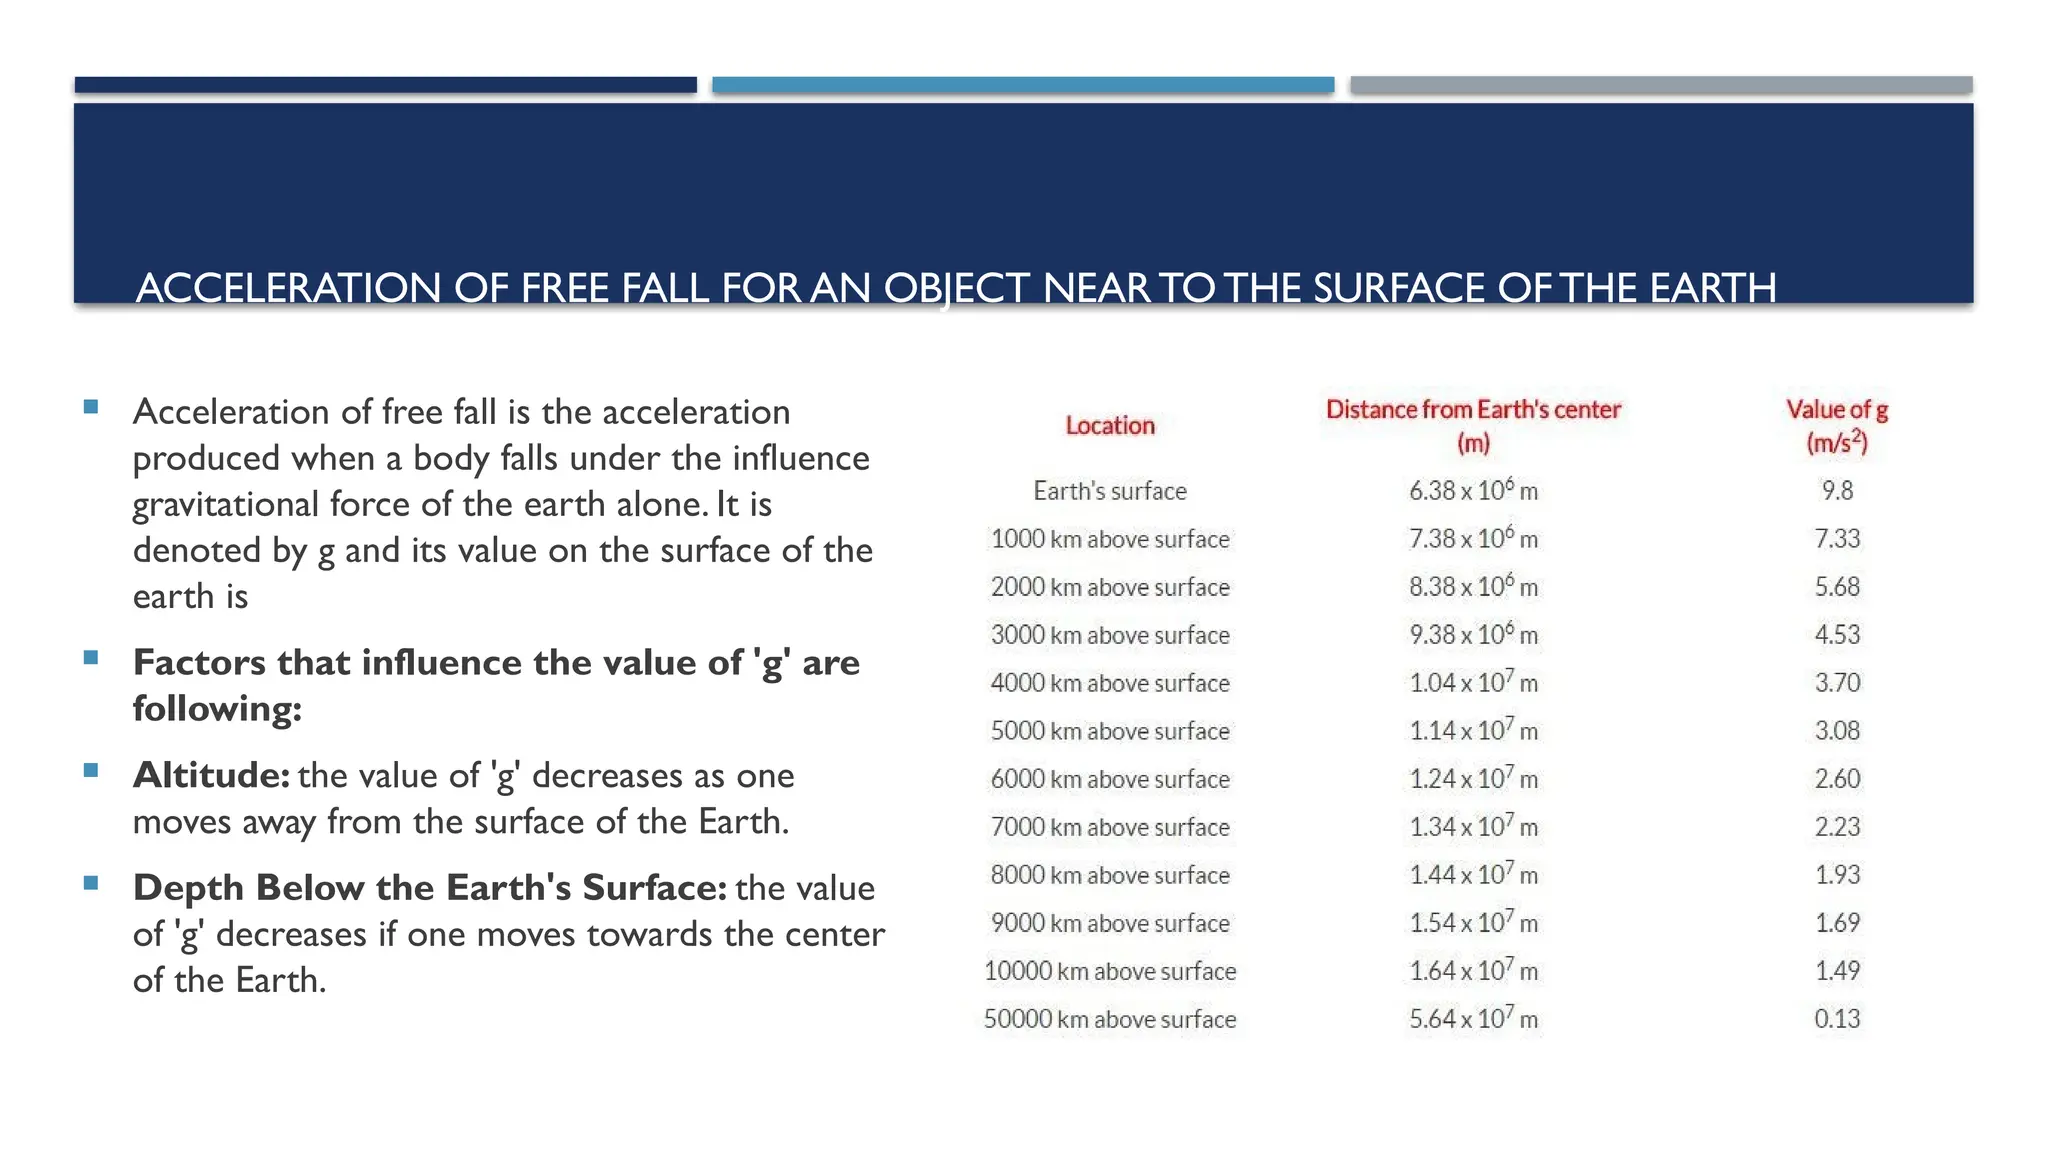
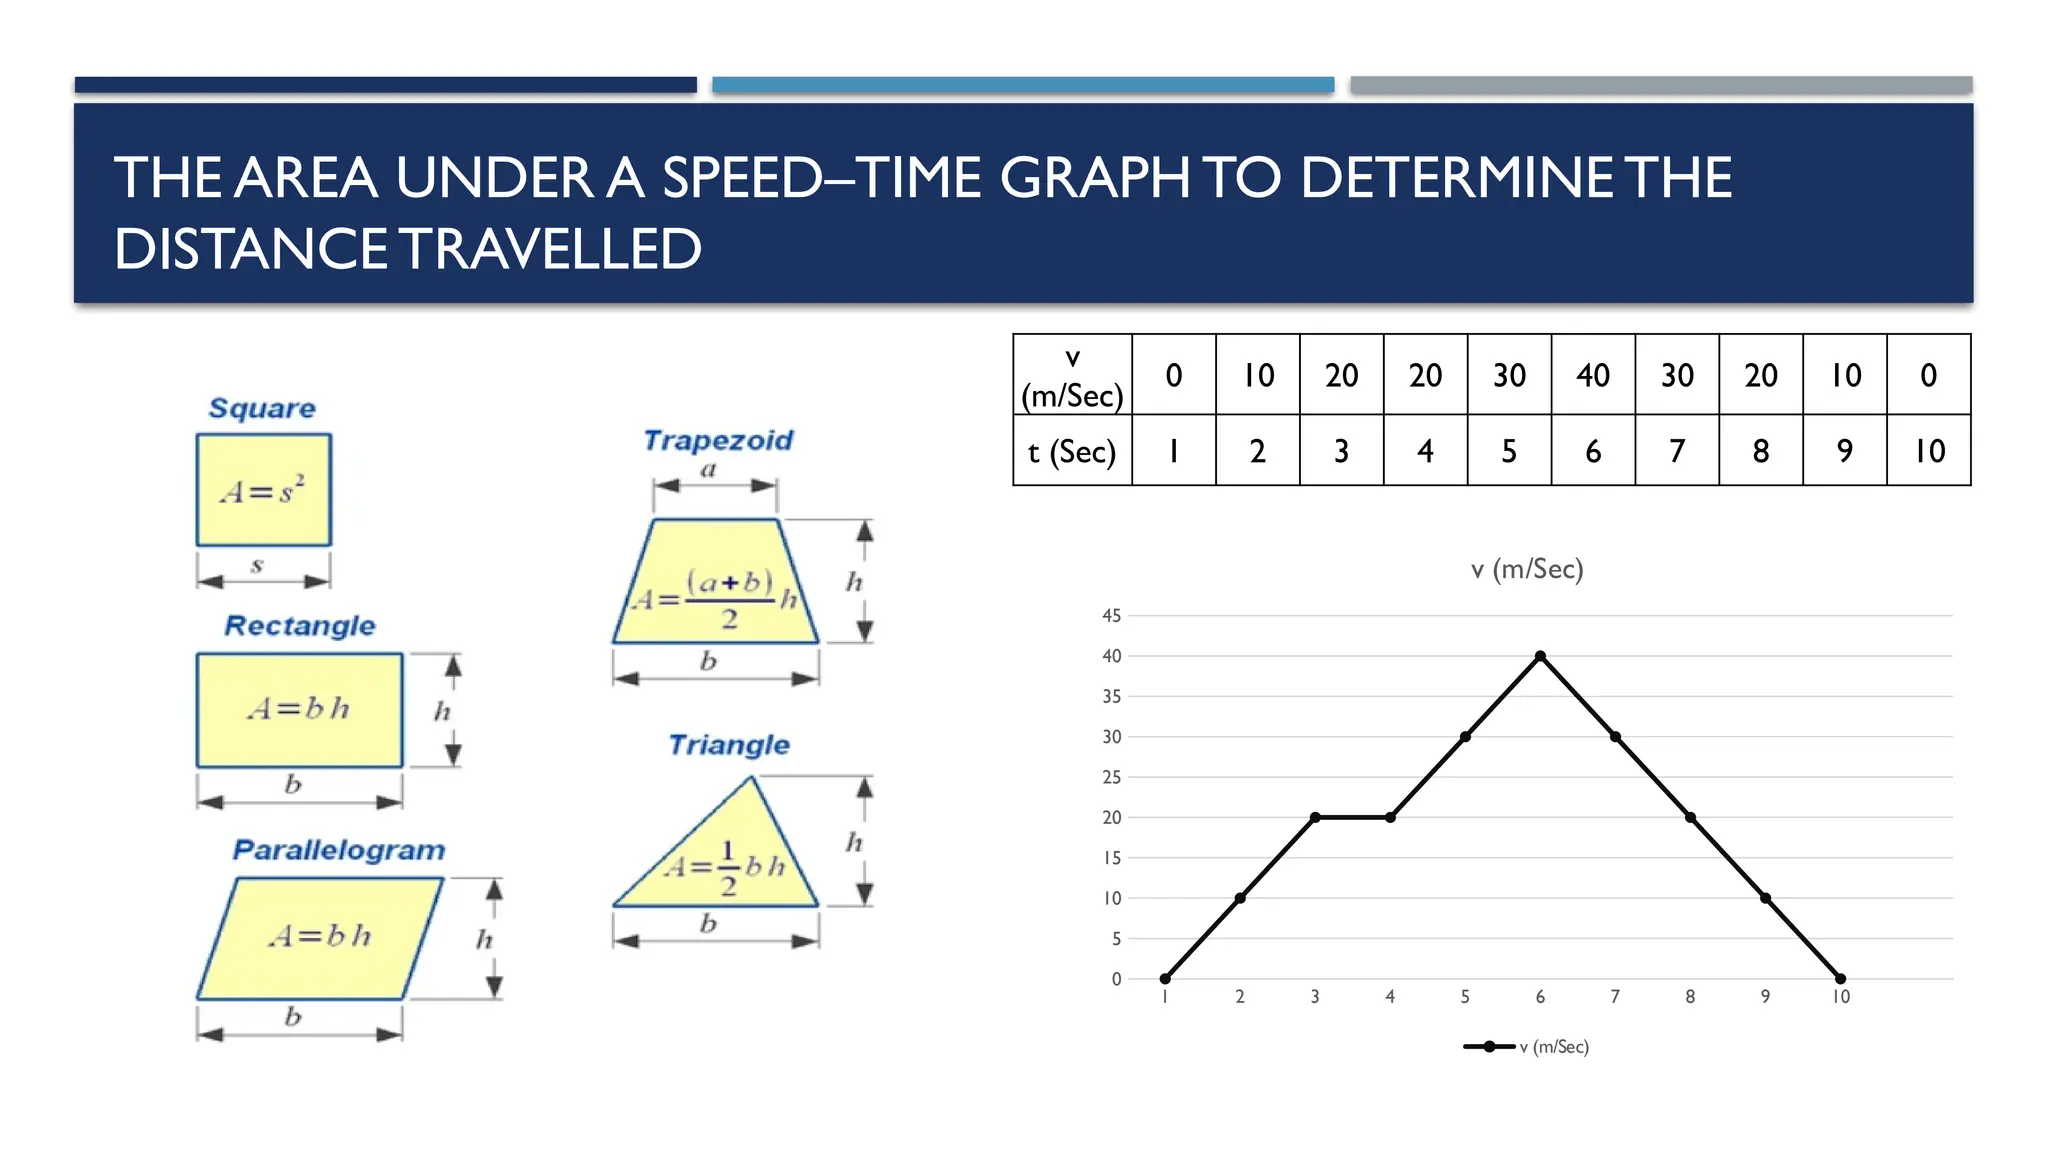
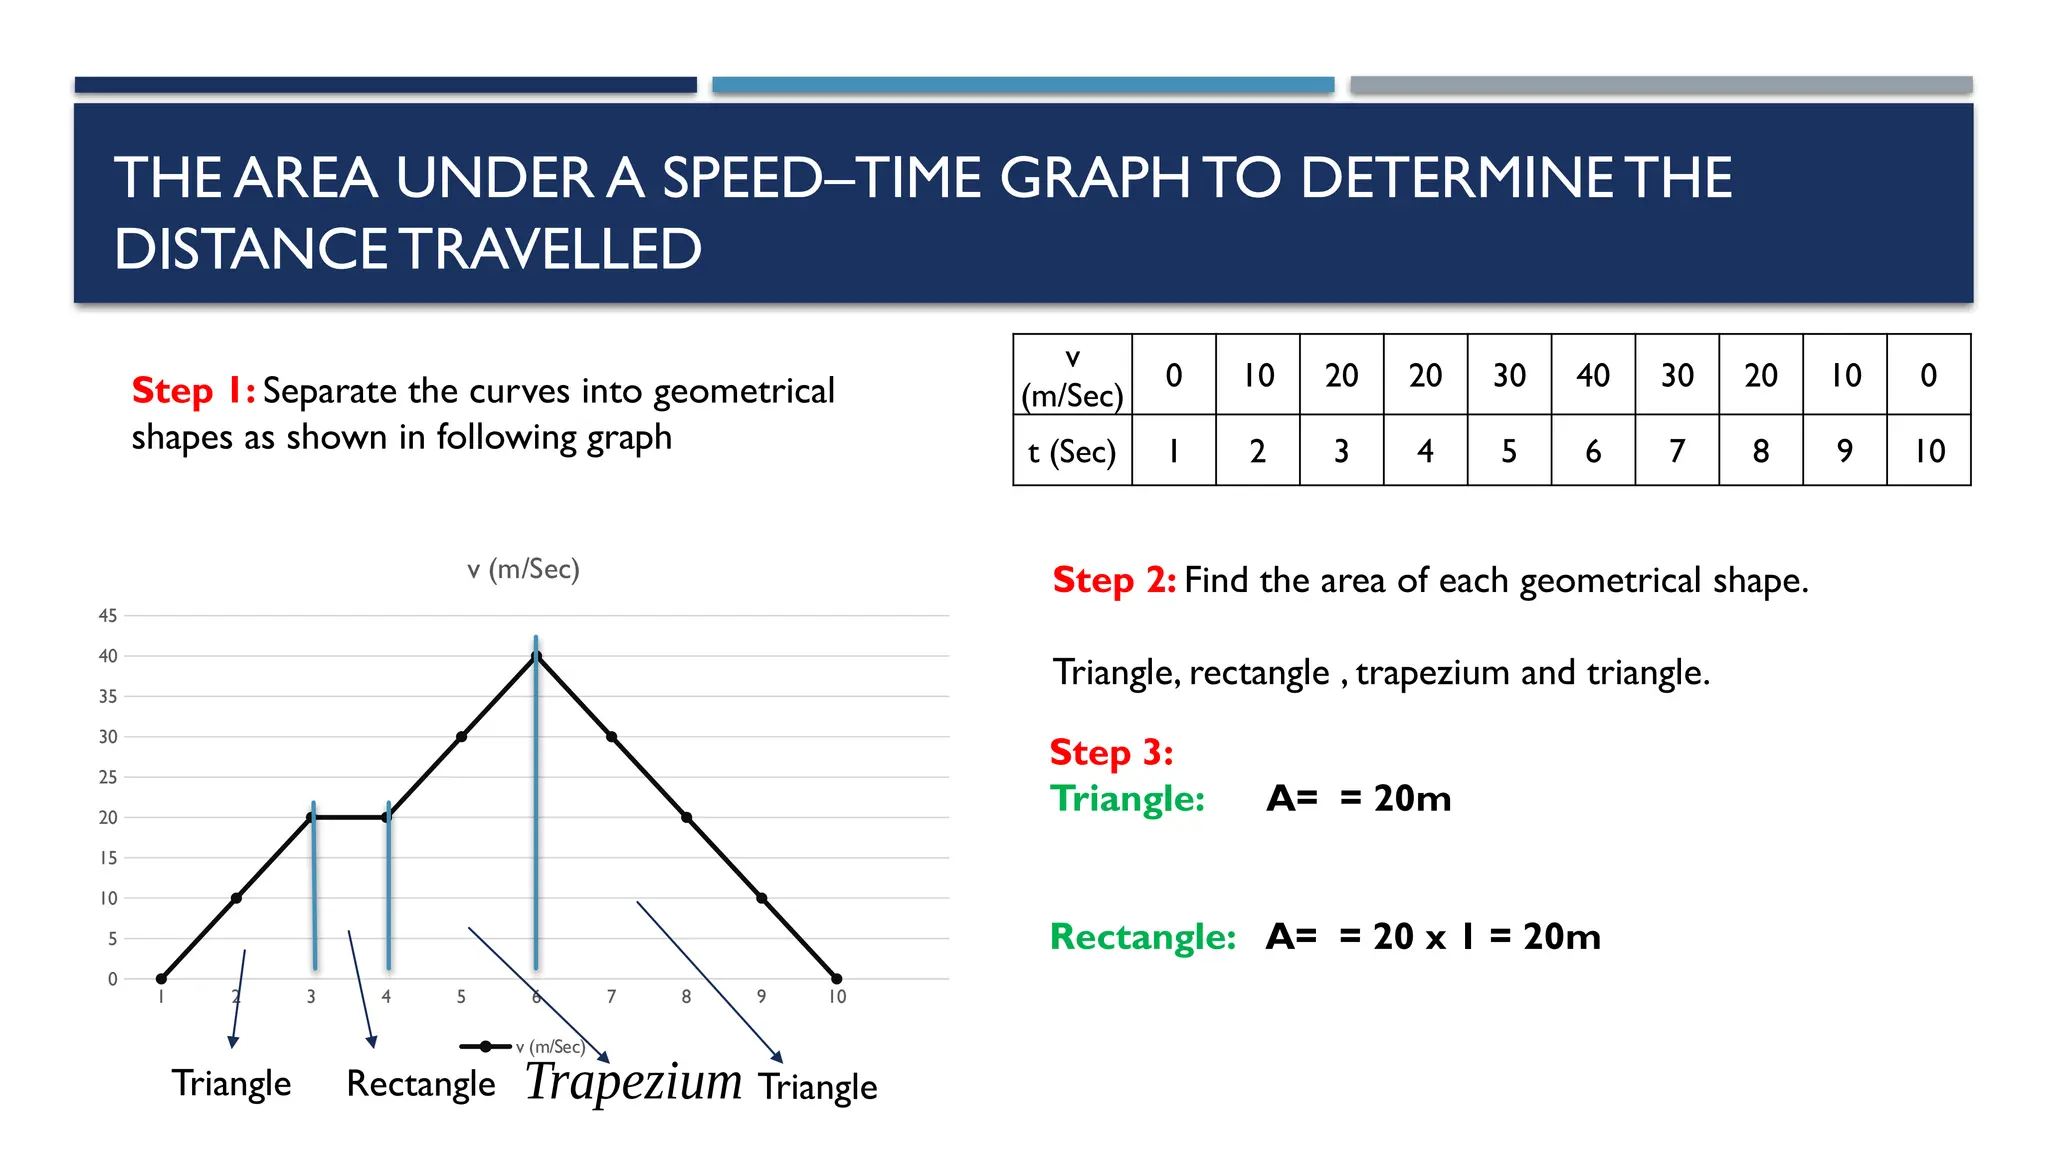
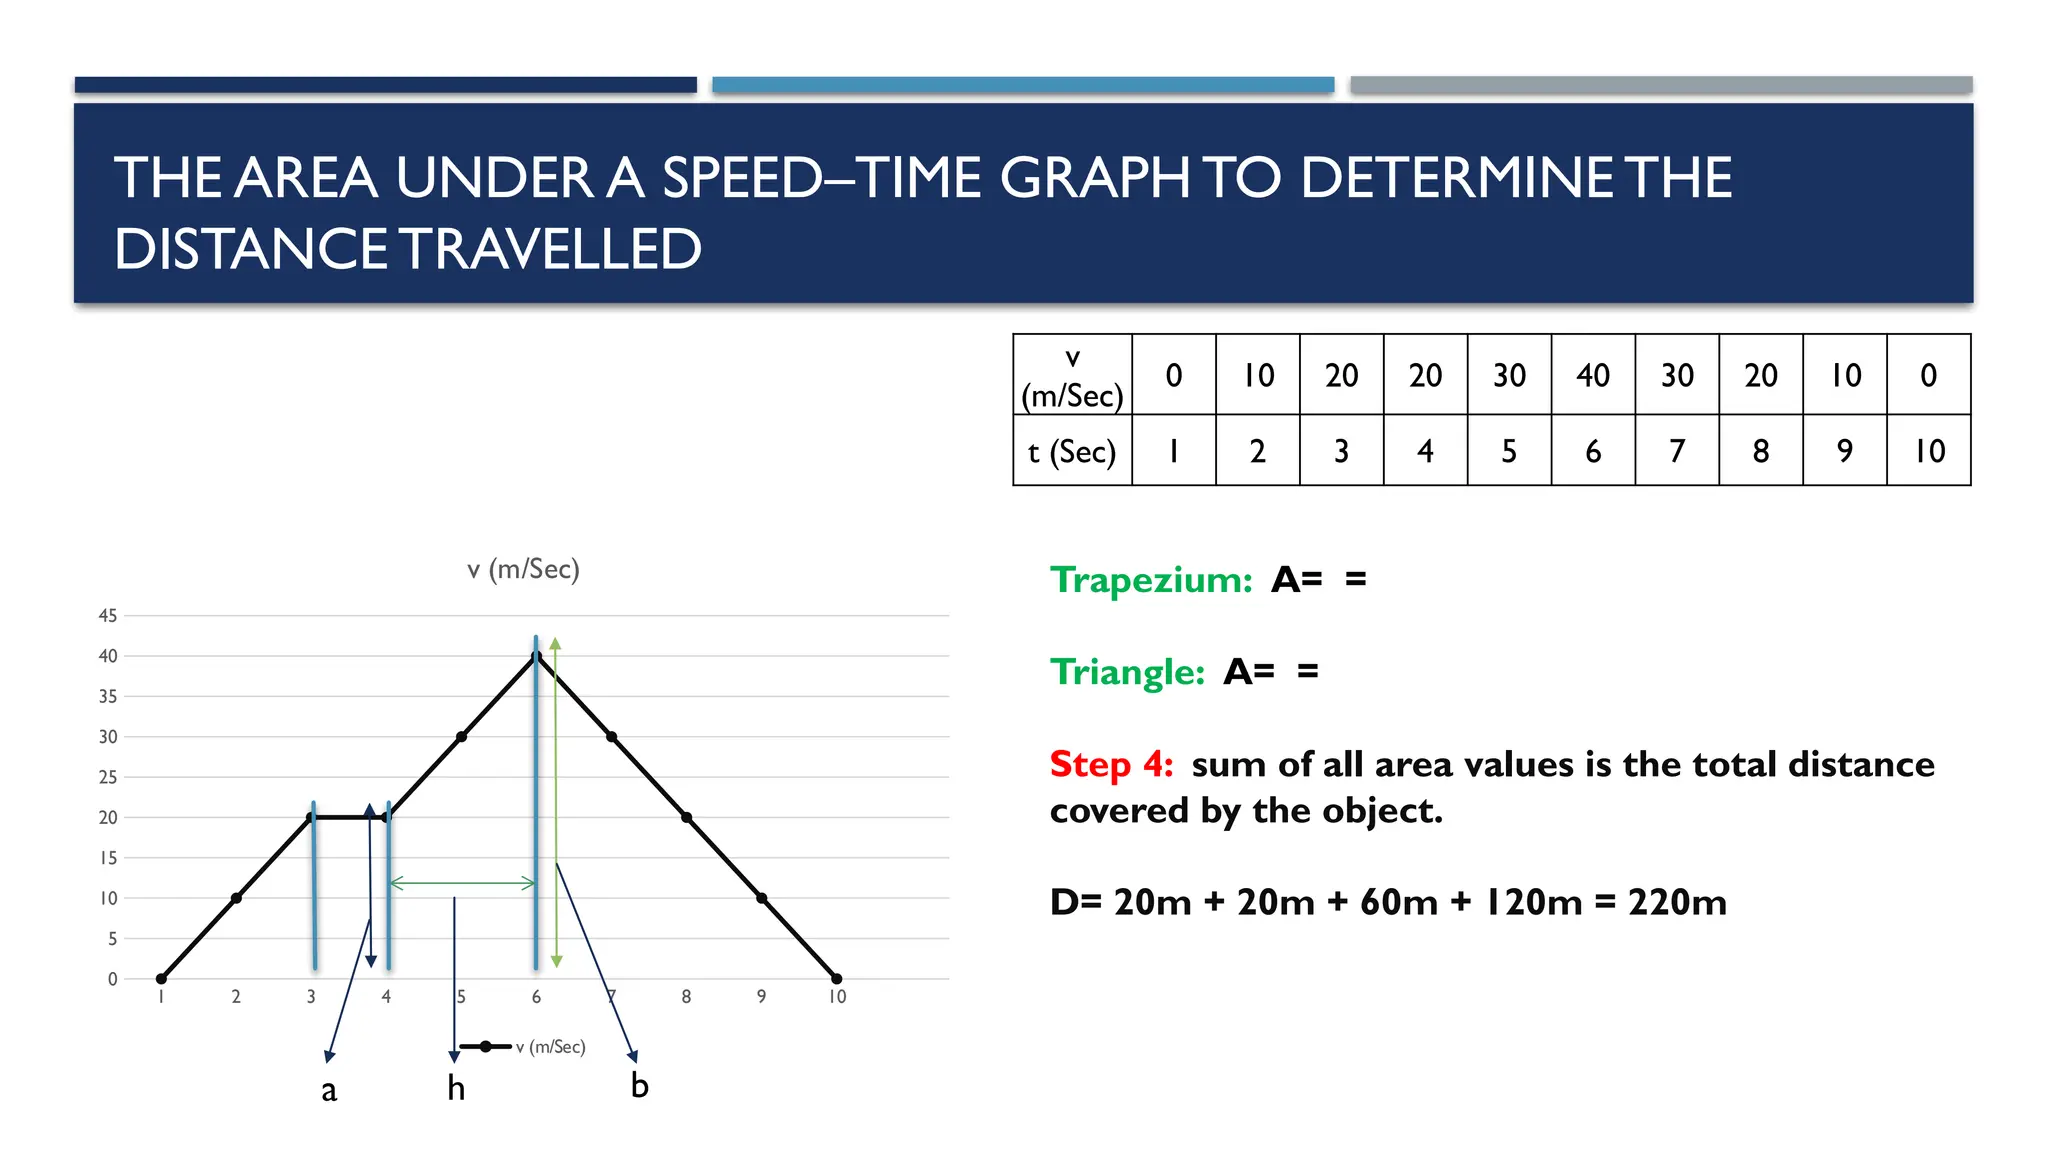
MOTION 1.2 GRAPHS
PHYSICS 5054
OBJECTIVES
1. Determine from the shape of a distance–time graph when an object is: (a) at rest (b) moving with constant speed
(c) accelerating (d) decelerating
2. Determine from the shape of a speed–time graph when an object is: a) at rest (b) moving with constant speed (c)
moving with constant acceleration (d) moving with changing acceleration
3. State that the acceleration of free fall g for an object near to the surface of the Earth is approximately constant
and is approximately 9.8m/ s2
4. Calculate speed from the gradient of a distance–time graph
5. Calculate the area under a speed–time graph to determine the distance travelled for motion with constant speed
or constant acceleration
DISTANCE-TIME GRAPHS
At rest
d / m 5 5 5 5 5 5 5
t / Sec 1 2 3 4 5 6 7
1 2 3 4 5 6 7
0
1
2
3
4
5
6
Distance-Time Graph
d / m
DISTANCE-TIME GRAPHS
Moving with constant speed d / m 5 10 15 20 25 30 35
t / Sec 1 2 3 4 5 6 7
1 2 3 4 5 6 7
0
5
10
15
20
25
30
35
40
Distance-Time Graph
d / m
DISTANCE-TIME GRAPHS
Accelerating d / m 3 7 18 34 48 60 80
t / Sec 1 2 3 4 5 6 7
1 2 3 4 5 6 7
0
10
20
30
40
50
60
70
80
90
Distance-Time Graph
d / m
DISTANCE-TIME GRAPHS
Decelerating d / m 55 48 38 28 18 12 5
t / Sec 1 2 3 4 5 6 7
1 2 3 4 5 6 7
0
10
20
30
40
50
60
Distance-Time Graph
d / m
SPEED–TIME GRAPHS
At rest
1 2 3 4 5 6 7
0
0.1
0.2
0.3
0.4
0.5
0.6
0.7
0.8
0.9
1
V (m/sec)
V (m/sec)
V (m/sec) 0 0 0 0 0 0 0
t (Sec) 1 2 3 4 5 6 7
SPEED–TIME GRAPHS
Moving with constant speed
V (m/sec) 20 20 20 20 20 20 20
t (Sec) 1 2 3 4 5 6 7
1 2 3 4 5 6 7
0
5
10
15
20
25
V (m/sec)
V (m/sec)
SPEED–TIME GRAPHS
Moving with constant acceleration
1 2 3 4 5 6 7
0
5
10
15
20
25
30
35
40
V (m/sec)
V (m/sec)
V (m/sec) 5 10 15 20 25 30 35
t (Sec) 1 2 3 4 5 6 7
SPEED–TIME GRAPHS
Moving with changing acceleration
V (m/sec) 5 7 18 30 35 56 70
t (Sec) 1 2 3 4 5 6 7
1 2 3 4 5 6 7
0
10
20
30
40
50
60
70
80
V (m/sec)
V (m/sec)
ACCELERATION OF FREE FALL FOR AN OBJECT NEARTOTHE SURFACE OFTHE EARTH
 Acceleration of free fall is the acceleration
produced when a body falls under the influence
gravitational force of the earth alone. It is
denoted by g and its value on the surface of the
earth is
 Factors that influence the value of 'g' are
following:
 Altitude: the value of 'g' decreases as one
moves away from the surface of the Earth.
 Depth Below the Earth's Surface: the value
of 'g' decreases if one moves towards the center
of the Earth.
THE AREA UNDER A SPEED–TIME GRAPHTO DETERMINE THE
DISTANCE TRAVELLED
v
(m/Sec)
0 10 20 20 30 40 30 20 10 0
t (Sec) 1 2 3 4 5 6 7 8 9 10
1 2 3 4 5 6 7 8 9 10
0
5
10
15
20
25
30
35
40
45
v (m/Sec)
v (m/Sec)
THE AREA UNDER A SPEED–TIME GRAPHTO DETERMINE THE
DISTANCE TRAVELLED
v
(m/Sec)
0 10 20 20 30 40 30 20 10 0
t (Sec) 1 2 3 4 5 6 7 8 9 10
1 2 3 4 5 6 7 8 9 10
0
5
10
15
20
25
30
35
40
45
v (m/Sec)
v (m/Sec)
Step 1: Separate the curves into geometrical
shapes as shown in following graph
Step 2: Find the area of each geometrical shape.
Triangle, rectangle , trapezium and triangle.
Step 3:
Triangle: A= = 20m
Rectangle: A= = 20 x 1 = 20m
Triangle Rectangle Trapezium Triangle
THE AREA UNDER A SPEED–TIME GRAPHTO DETERMINE THE
DISTANCE TRAVELLED
v
(m/Sec)
0 10 20 20 30 40 30 20 10 0
t (Sec) 1 2 3 4 5 6 7 8 9 10
1 2 3 4 5 6 7 8 9 10
0
5
10
15
20
25
30
35
40
45
v (m/Sec)
v (m/Sec)
Trapezium: A= =
Triangle: A= =
Step 4: sum of all area values is the total distance
covered by the object.
D= 20m + 20m + 60m + 120m = 220m
a h b

motion, types and concepts related to o level physics

  • 1.
  • 2.
    OBJECTIVES 1. Determine fromthe shape of a distance–time graph when an object is: (a) at rest (b) moving with constant speed (c) accelerating (d) decelerating 2. Determine from the shape of a speed–time graph when an object is: a) at rest (b) moving with constant speed (c) moving with constant acceleration (d) moving with changing acceleration 3. State that the acceleration of free fall g for an object near to the surface of the Earth is approximately constant and is approximately 9.8m/ s2 4. Calculate speed from the gradient of a distance–time graph 5. Calculate the area under a speed–time graph to determine the distance travelled for motion with constant speed or constant acceleration
  • 3.
    DISTANCE-TIME GRAPHS At rest d/ m 5 5 5 5 5 5 5 t / Sec 1 2 3 4 5 6 7 1 2 3 4 5 6 7 0 1 2 3 4 5 6 Distance-Time Graph d / m
  • 4.
    DISTANCE-TIME GRAPHS Moving withconstant speed d / m 5 10 15 20 25 30 35 t / Sec 1 2 3 4 5 6 7 1 2 3 4 5 6 7 0 5 10 15 20 25 30 35 40 Distance-Time Graph d / m
  • 5.
    DISTANCE-TIME GRAPHS Accelerating d/ m 3 7 18 34 48 60 80 t / Sec 1 2 3 4 5 6 7 1 2 3 4 5 6 7 0 10 20 30 40 50 60 70 80 90 Distance-Time Graph d / m
  • 6.
    DISTANCE-TIME GRAPHS Decelerating d/ m 55 48 38 28 18 12 5 t / Sec 1 2 3 4 5 6 7 1 2 3 4 5 6 7 0 10 20 30 40 50 60 Distance-Time Graph d / m
  • 7.
    SPEED–TIME GRAPHS At rest 12 3 4 5 6 7 0 0.1 0.2 0.3 0.4 0.5 0.6 0.7 0.8 0.9 1 V (m/sec) V (m/sec) V (m/sec) 0 0 0 0 0 0 0 t (Sec) 1 2 3 4 5 6 7
  • 8.
    SPEED–TIME GRAPHS Moving withconstant speed V (m/sec) 20 20 20 20 20 20 20 t (Sec) 1 2 3 4 5 6 7 1 2 3 4 5 6 7 0 5 10 15 20 25 V (m/sec) V (m/sec)
  • 9.
    SPEED–TIME GRAPHS Moving withconstant acceleration 1 2 3 4 5 6 7 0 5 10 15 20 25 30 35 40 V (m/sec) V (m/sec) V (m/sec) 5 10 15 20 25 30 35 t (Sec) 1 2 3 4 5 6 7
  • 10.
    SPEED–TIME GRAPHS Moving withchanging acceleration V (m/sec) 5 7 18 30 35 56 70 t (Sec) 1 2 3 4 5 6 7 1 2 3 4 5 6 7 0 10 20 30 40 50 60 70 80 V (m/sec) V (m/sec)
  • 11.
    ACCELERATION OF FREEFALL FOR AN OBJECT NEARTOTHE SURFACE OFTHE EARTH  Acceleration of free fall is the acceleration produced when a body falls under the influence gravitational force of the earth alone. It is denoted by g and its value on the surface of the earth is  Factors that influence the value of 'g' are following:  Altitude: the value of 'g' decreases as one moves away from the surface of the Earth.  Depth Below the Earth's Surface: the value of 'g' decreases if one moves towards the center of the Earth.
  • 12.
    THE AREA UNDERA SPEED–TIME GRAPHTO DETERMINE THE DISTANCE TRAVELLED v (m/Sec) 0 10 20 20 30 40 30 20 10 0 t (Sec) 1 2 3 4 5 6 7 8 9 10 1 2 3 4 5 6 7 8 9 10 0 5 10 15 20 25 30 35 40 45 v (m/Sec) v (m/Sec)
  • 13.
    THE AREA UNDERA SPEED–TIME GRAPHTO DETERMINE THE DISTANCE TRAVELLED v (m/Sec) 0 10 20 20 30 40 30 20 10 0 t (Sec) 1 2 3 4 5 6 7 8 9 10 1 2 3 4 5 6 7 8 9 10 0 5 10 15 20 25 30 35 40 45 v (m/Sec) v (m/Sec) Step 1: Separate the curves into geometrical shapes as shown in following graph Step 2: Find the area of each geometrical shape. Triangle, rectangle , trapezium and triangle. Step 3: Triangle: A= = 20m Rectangle: A= = 20 x 1 = 20m Triangle Rectangle Trapezium Triangle
  • 14.
    THE AREA UNDERA SPEED–TIME GRAPHTO DETERMINE THE DISTANCE TRAVELLED v (m/Sec) 0 10 20 20 30 40 30 20 10 0 t (Sec) 1 2 3 4 5 6 7 8 9 10 1 2 3 4 5 6 7 8 9 10 0 5 10 15 20 25 30 35 40 45 v (m/Sec) v (m/Sec) Trapezium: A= = Triangle: A= = Step 4: sum of all area values is the total distance covered by the object. D= 20m + 20m + 60m + 120m = 220m a h b