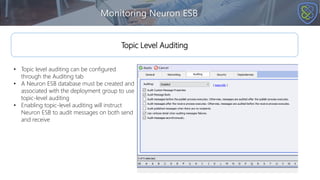
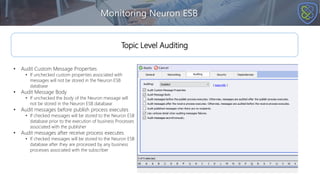
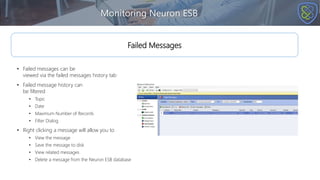
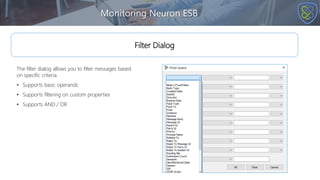
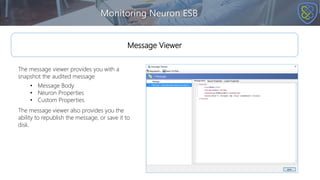
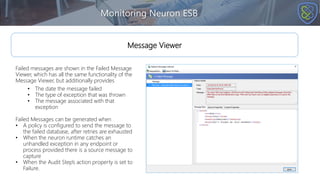
This document provides an overview of monitoring capabilities in Neuron ESB, including: auditing messages at the topic level; viewing message history and failed messages; monitoring active sessions and endpoint health; using WMI events and performance counters; and accessing information via the Neuron ESB REST API. It includes goals, a lesson plan, and descriptions of topic-level auditing configuration, the message viewer, republishing strategies, and Windows Management Instrumentation in Neuron ESB. Demo sections are also included to showcase various monitoring features in practice.
The document describes the Correlation Composer tool for HP OpenView Operations (OVO). It enables specifying correlation logic through a graphical user interface (GUI) and pre-packaged templates. The Correlation Composer allows defining common correlation scenarios more easily than the existing Event Correlation System (ECS) Designer tool and integrates external data. It provides out-of-the-box correlation for common problems and allows customizing and extending correlation functionality.
This document provides an introduction to Neuron ESB, including its features, tools, architecture, and how to install and configure it. It discusses Neuron ESB's messaging capabilities, services, business process designer, workflow designer, adapters, and other components. The document also includes sections on installing Neuron ESB, its software and system requirements, and demos of key features to familiarize users.
I do not have enough context to summarize this document. It contains operational security information about Neuron ESB and does not have a clear summary point.
- Neuron ESB is a hybrid integration platform built on .NET that provides features like messaging, API/SOA gateway capabilities, reporting, connectors to integrate applications, and management tools.
- It uses a topic-based pub/sub messaging engine and includes tools for business process design, workflow design, service brokering, auditing, and monitoring.
- The Neuron ESB runtime hosts the platform's services and loads configuration files to run Neuron ESB solutions, with multiple runtime instances supported on a single machine.
The document provides an overview of Neuron ESB, an integration platform. It outlines the goals of introducing Neuron ESB's features, tools, and operating principles. The objectives include understanding the tools and services, configuring and creating solutions, hosting solutions using the runtime, the role of messaging, and installing/configuring the runtime and database. An overview of the key components is then provided, including the explorer, designer, messaging, adapters, monitoring, and more.
- The document discusses how to configure logging and troubleshoot issues in Neuron ESB, including setting the logging level, viewing event and trace logs, and using logs to troubleshoot installation problems. It provides details on logging configuration, the types of logs produced, and how to centralize logging. Common installation errors are also covered, along with how to generate more verbose logs to aid in troubleshooting.
Introduction to Long Running Workflows 3.7StephenKardian
This document provides an introduction to long running workflows in Neuron ESB. It discusses workflow types (normal, request-reply, correlated), persistence which allows workflows to restart from their last operation, and workflow endpoints which host workflow definitions and process messages through them. It also provides overviews of the workflow designer, activities for control flow, languages, messaging, web services, XML, errors, and primitives that can be used to implement workflows in Neuron ESB.
The document provides an introduction to messaging with Neuron ESB. It discusses the goals of learning about Neuron's hierarchical topic-based pub/sub messaging system. The key concepts covered include Neuron messages, topics, parties, conditions, subscriptions, and topic taxonomy. It provides examples and discusses best practices for structuring topic taxonomies and determining an appropriate structure based on business and technical requirements.
The document discusses how to track workflows by viewing workflow instances and details, canceling and restarting workflows, and using persistence points; it also covers hosting workflow endpoints by creating an endpoint that references a workflow definition and topic to process messages, and settings like concurrent workflows and timeouts; the document provides demonstrations of viewing workflow tracking, creating and deploying endpoints, and verifying workflow operations.
Analyze Your Code With Visual Studio 2015 Diagnostic ToolsKen Cenerelli
These slides detail the new Diagnostic Tools Window in Visual Studio 2015. We look at all of the new tools and there are lots of resources too.
This talk was given at CTTDNUG on January 27, 2016.
The document discusses Neuron ESB deployment configuration, including:
- Understanding deployment groups which provide environment-specific configuration for Neuron servers, databases, and messaging.
- Using environmental variables to dynamically configure properties for different environments like development, test, and production.
- Deploying Neuron solutions via methods like copying files, or using the import/export functionality in the Neuron Explorer UI or command line.
- Running multiple Neuron instances on a single machine to separate solutions or workloads.
Adapters in Neuron ESB bridge external protocols, databases, applications and transports. They support various message exchange patterns and transactions. Neuron ESB ships with many built-in adapters like FTP, SQL, and RabbitMQ. Adapters are configured through endpoints in the Neuron ESB Explorer where their properties and connection details are set. Metadata harvesting allows browsing target systems to generate schemas and sample messages.
EJB3.1 defines enterprise beans as server-side components that encapsulate business logic. The main types of enterprise beans are session beans, message-driven beans, and entity beans. Session beans are further divided into stateless, stateful, and singleton beans. Enterprise beans provide benefits such as portability, transaction management, and scalability.
Understand how to monitor different components of your business infrastructure such as application servers, databases, big data stores, web servers, ERP software, middleware and messaging components, as well as virtual and cloud resources. You will also learn how to assign threshold values, configure alerts, automate corrective actions, generate reports, and create custom dashboards.
Module 14 Building Custom Adapters ConnectorsCourtney Doeing
The document discusses building custom adapters for Neuron ESB. It describes the adapter framework architecture, including how to define properties, constructor, base methods, send/publish methods, and custom metadata. The objectives are to understand how to build, integrate, deploy, and debug custom adapters. The lab guides users through building a custom adapter, registering it with Neuron ESB, and debugging at design and run time.
Fault tolerance is important for distributed systems to continue functioning in the event of partial failures. There are several phases to achieving fault tolerance: fault detection, diagnosis, evidence generation, assessment, and recovery. Common techniques include replication, where multiple copies of data are stored at different sites to increase availability if one site fails, and check pointing, where a system's state is periodically saved to stable storage so the system can be restored to a previous consistent state if a failure occurs. Both techniques have limitations around managing consistency with replication and overhead from checkpointing communications and storage requirements.
This document discusses Neuron ESB deployment and configuration, including:
- Configuring Deployment Groups to define environment settings for Neuron servers, databases, and endpoints.
- Using Endpoint Hosts for failover clustering within Deployment Groups.
- Maintaining Environmental Variables for dynamic configuration and binding expressions.
- Deploying Neuron ESB solutions using import/export, source control, or the command line.
- Configuring multiple Neuron instances and high availability deployments across multiple machines.
The document describes an Online College Stationary Portal (OCSP) system that aims to improve on a manual existing system. The proposed system provides a user-friendly interface and powerful database management. It offers benefits like increased accuracy, effectiveness, security, and reduced manual work. The system allows generating reports, printing various reports, and allocating products to departments and staff. It also includes modules for managing users, departments, products, stock, orders, and bills.
This document discusses context-driven test automation and describes four common contexts for automation: individual developer, development team, project, and product line. It analyzes two case studies - the ITE and xBVT test automation frameworks - and how they address common test automation tasks like distribution, setup/teardown, execution, verification and reporting differently depending on their context. The key lesson is that the approach that works best depends on who writes and uses the tests rather than a one-size-fits-all framework. Defining the context upfront helps determine how automation tasks are implemented.
The document discusses object-oriented system development life cycles and methodologies. It describes Rumbaugh's Object Modeling Technique (OMT), which uses object models, dynamic models, and functional models to analyze, design, and implement systems. It also covers Booch methodology, which focuses on analysis and design using class, object, state, module, process, and interaction diagrams. Additionally, it mentions Jacobson's use case methodology for user-driven analysis.
Enterprise JavaBeans (EJB) are server-side components that allow for the development of scalable, transactional, secure distributed applications. There are three main types of EJB components: session beans which represent business logic and processes, entity beans which manage persistent data storage, and message-driven beans which consume messages from external systems like JMS. EJB provides a standardized architecture for building modular, portable enterprise applications that can be deployed across compliant application servers.
The document discusses building custom adapters for Neuron ESB using the Adapter Framework. It covers understanding the adapter framework architecture, creating custom adapter properties and metadata, overriding base methods, debugging adapters, and integrating custom adapters into Neuron ESB Explorer by registering the DLL. The overall goal is to familiarize users with developing custom adapters for integrating third party systems.
Build, Test and Extend Integrated Workflows 3.7StephenKardian
This document discusses building, testing, and extending integrated workflows in Neuron ESB. It covers containers, flow control, exception management, external assemblies, message processing, arguments and variables, custom workflows and activities, building workflows, and debugging workflows. The goals are to understand complex workflow logic, custom activities, flow control, exception handling, external code integration, message transformation, and testing workflows.
Developing and Hosting SOAP Based ServicesStephenKardian
This document discusses developing and hosting SOAP-based services in Neuron ESB. It covers creating and importing SOAP services, hosting WSDL documents, using WCF bindings and custom bindings/behaviors, and inspecting and writing SOAP headers. The document provides details on the key elements of a WSDL and how to associate a WSDL with a client connector in Neuron ESB. It also reviews how to create SOAP services, import existing SOAP services, and access SOAP headers in business processes.
“Microservices” have become a trendy development strategy. Hosting and running such services used to be pretty painful... but here comes Service Fabric! Let’s take a closer look at this platform, its different development models and all the features it offers, and not only for microservices!
This presentation demonstrate how Incorta support the data security requirements. It describes how to define the session variable and how to define the security filters.
The document discusses LinkedIn's network updates service. It describes the service's architecture, which uses a pull-based model where members' feeds are dynamically assembled from the updates of their connections. The service handles high volumes of updates, delivers updates and emails to millions of members daily, and integrates with external services like Twitter. It emphasizes scaling the system through techniques like filtering, caching, parallelization and sharding databases.
This document discusses workflow patterns and correlation in Neuron ESB. It describes the singleton pattern, which restricts workflow instances to one object to coordinate actions. It also covers correlated send/receive patterns using correlation IDs and sets to associate messages. Compensation is discussed as a way to undo completed work in non-transactional systems using compensable activities. The document provides examples of singleton, correlated send/receive, and compensation implementation and recommends hands-on practice through a correlated workflow lab.
Using Adapters and Mediation to Integrate Systems 3.7StephenKardian
This document provides an overview of adapters in Neuron ESB and their use in integrating systems. It describes the different messaging semantics supported by adapters, including publish/subscribe. It provides examples of specific adapters like Microsoft Exchange, File, and ODBC and their supported features. The document also discusses how adapter metadata and policies can be used to affect message properties and failure handling between integrated systems.
The document discusses web security in Neuron ESB. It covers security models, using certificates with service endpoints, and using OAuth. Security models like transport and message are used to secure communication between endpoints. Transport secures the channel, while message secures individual messages. Certificates can be used for transport security by associating a certificate credential with an endpoint. OAuth is used to authenticate REST calls, by creating OAuth providers in Neuron ESB and associating them with service connectors. Custom OAuth providers can also be created and used.
- Swagger is a specification for describing RESTful APIs in a machine-readable format. Swagger documents stored in the Neuron ESB Explorer Repository can be hosted and associated with REST client connectors.
- The Neuron ESB supports mediating between JSON, XML, and binary formats using process steps. JSON objects can be dynamically converted and JSON templates can be used for transformations.
- HTTP headers play an important role in REST APIs, allowing additional information to be passed with requests and responses. Service policies can manage HTTP status codes.
Introduction to API and Service Hosting 3.7StephenKardian
This document provides an introduction to API and service hosting in Neuron ESB. It discusses service endpoints, which allow Neuron ESB to interact with clients and services. There are two types of service endpoints: client connectors, which publish directly to the bus; and service connectors, which subscribe directly from the bus and route traffic to existing services. The document describes how to create service endpoints, configure the general, binding, security, and other settings for each endpoint type. It also covers service policies, which define retry behavior and timeouts for failed service calls.
This document discusses extending business processes in Neuron ESB by creating custom business process steps. It covers creating a custom process step project, registering custom steps, and using them in business processes. The goals are to understand custom process steps, when to use them, and the business process API for executing processes from code. The lab objectives are to create a custom process and register a custom step with the Neuron ESB Explorer.
Here are the key things you will do in the lab:
1. Build a business process that uses decision and parallel process steps to control flow and process messages concurrently.
2. Add exception handling using try/catch blocks and enrich exceptions with additional context.
3. Reference an external .NET assembly from within a code process step.
4. Access Neuron ESB APIs like the configuration, client context, and publish messages directly.
5. Debug the business process using breakpoints and inspecting variables at each step.
6. Store and retrieve custom properties and state at the message, instance, and global level.
The lab will reinforce how to design complex, dynamic processes that leverage Neuron
This document provides an introduction to business processes in Neuron ESB. It describes the business process designer and library used to build processes. It explains how to test processes and the various flow control, language, message, and service steps available to define process logic and integrate with external systems. Key topics covered include building decision logic, looping, parallel processing, calling external services, manipulating messages, and auditing processes.
This document provides an overview of using repository documents in Neuron ESB, including:
- The repository provides centralized storage and management of documents that can be leveraged by business processes and workflows.
- In business processes and workflows, steps/activities can select documents from the repository instead of requiring the data to be entered manually.
- It demonstrates how to create and use repository documents in business processes, workflows, and code editors.
- The lab objective is to create a document in the repository and use it in a simple business process.
The document provides an overview of the Neuron ESB Client API. It discusses communicating with Neuron ESB using the Client API versus HTTP, the Party API object model for publishing and subscribing, connecting and disconnecting from Neuron ESB, and publishing and receiving messages. It also provides examples of sending messages asynchronously, casting message bodies to .NET objects, and rolling back transactions. The goal is to provide an understanding of how to use the Neuron ESB Client API to integrate .NET applications and communicate with Neuron ESB.
The document discusses Enterprise Service Bus (ESB) fundamentals, including what an ESB is, the problems it solves, and its benefits over other integration strategies. An ESB facilitates integration between systems, masks differences between platforms, and improves processes like routing and monitoring. It decouples systems, scales solutions, and allows more configuration than coding during integration.
The document discusses Enterprise Service Bus (ESB) fundamentals, including what an ESB is, the problems it solves, and its benefits over other integration strategies. An ESB facilitates integration between systems, masks differences between platforms, and improves processes like routing and monitoring. It decouples systems, scales solutions, and allows more configuration than coding. Key ESB features include service orchestration, message transformation, transport and routing, mediation, monitoring and reporting, and supporting non-functional requirements and workflows.
The document discusses web security in Neuron ESB. It covers security models, using certificates with service endpoints, and using OAuth. Security models like transport and message are used to secure communication between endpoints. Transport secures the channel, while message secures individual messages. Certificates can be used for transport security by associating a certificate credential with an endpoint. OAuth is used to authenticate REST calls, by creating OAuth providers in Neuron ESB and associating them with service connectors. Custom OAuth providers can also be created and used.
it describes the bony anatomy including the femoral head , acetabulum, labrum . also discusses the capsule , ligaments . muscle that act on the hip joint and the range of motion are outlined. factors affecting hip joint stability and weight transmission through the joint are summarized.
How to Manage Your Lost Opportunities in Odoo 17 CRMCeline George
Odoo 17 CRM allows us to track why we lose sales opportunities with "Lost Reasons." This helps analyze our sales process and identify areas for improvement. Here's how to configure lost reasons in Odoo 17 CRM
Strategies for Effective Upskilling is a presentation by Chinwendu Peace in a Your Skill Boost Masterclass organisation by the Excellence Foundation for South Sudan on 08th and 09th June 2024 from 1 PM to 3 PM on each day.
ISO/IEC 27001, ISO/IEC 42001, and GDPR: Best Practices for Implementation and...PECB
Denis is a dynamic and results-driven Chief Information Officer (CIO) with a distinguished career spanning information systems analysis and technical project management. With a proven track record of spearheading the design and delivery of cutting-edge Information Management solutions, he has consistently elevated business operations, streamlined reporting functions, and maximized process efficiency.
Certified as an ISO/IEC 27001: Information Security Management Systems (ISMS) Lead Implementer, Data Protection Officer, and Cyber Risks Analyst, Denis brings a heightened focus on data security, privacy, and cyber resilience to every endeavor.
His expertise extends across a diverse spectrum of reporting, database, and web development applications, underpinned by an exceptional grasp of data storage and virtualization technologies. His proficiency in application testing, database administration, and data cleansing ensures seamless execution of complex projects.
What sets Denis apart is his comprehensive understanding of Business and Systems Analysis technologies, honed through involvement in all phases of the Software Development Lifecycle (SDLC). From meticulous requirements gathering to precise analysis, innovative design, rigorous development, thorough testing, and successful implementation, he has consistently delivered exceptional results.
Throughout his career, he has taken on multifaceted roles, from leading technical project management teams to owning solutions that drive operational excellence. His conscientious and proactive approach is unwavering, whether he is working independently or collaboratively within a team. His ability to connect with colleagues on a personal level underscores his commitment to fostering a harmonious and productive workplace environment.
Date: May 29, 2024
Tags: Information Security, ISO/IEC 27001, ISO/IEC 42001, Artificial Intelligence, GDPR
-------------------------------------------------------------------------------
Find out more about ISO training and certification services
Training: ISO/IEC 27001 Information Security Management System - EN | PECB
ISO/IEC 42001 Artificial Intelligence Management System - EN | PECB
General Data Protection Regulation (GDPR) - Training Courses - EN | PECB
Webinars: https://pecb.com/webinars
Article: https://pecb.com/article
-------------------------------------------------------------------------------
For more information about PECB:
Website: https://pecb.com/
LinkedIn: https://www.linkedin.com/company/pecb/
Facebook: https://www.facebook.com/PECBInternational/
Slideshare: http://www.slideshare.net/PECBCERTIFICATION
Exploiting Artificial Intelligence for Empowering Researchers and Faculty, In...Dr. Vinod Kumar Kanvaria
Exploiting Artificial Intelligence for Empowering Researchers and Faculty,
International FDP on Fundamentals of Research in Social Sciences
at Integral University, Lucknow, 06.06.2024
By Dr. Vinod Kumar Kanvaria
Main Java[All of the Base Concepts}.docxadhitya5119
This is part 1 of my Java Learning Journey. This Contains Custom methods, classes, constructors, packages, multithreading , try- catch block, finally block and more.
The simplified electron and muon model, Oscillating Spacetime: The Foundation...RitikBhardwaj56
Discover the Simplified Electron and Muon Model: A New Wave-Based Approach to Understanding Particles delves into a groundbreaking theory that presents electrons and muons as rotating soliton waves within oscillating spacetime. Geared towards students, researchers, and science buffs, this book breaks down complex ideas into simple explanations. It covers topics such as electron waves, temporal dynamics, and the implications of this model on particle physics. With clear illustrations and easy-to-follow explanations, readers will gain a new outlook on the universe's fundamental nature.
2. Monitoring Neuron ESB
• Learn how, when and where to use Auditing
• Understand Message History and Failed Message Reporting
• Using Activity Sessions to monitor remote Endpoints
• Understand the capabilities of Endpoint Health Monitoring
• Learn to use Neuron ESB WMI Events and Performance Counters
• Understand the Neuron ESB REST API and how it can be used
Goals
3. Monitoring Neuron ESB
• Auditing
• Topic Level Auditing
• Topic Level Auditing vs Process Level Auditing
• Audited Messages
• Message History / Failed Messages
• Message Viewer
• Republishing Strategies
• Active Session Reporting
• Endpoint Health
• WMI
• Neuron ESB REST API
Lesson Plan
4. Monitoring Neuron ESB
Topic Level Auditing
• Topic level auditing can be configured
through the Auditing tab
• A Neuron ESB database must be created and
associated with the deployment group to use
topic-level auditing
• Enabling topic-level auditing will instruct
Neuron ESB to audit messages on both send
and receive
5. Monitoring Neuron ESB
Topic Level Auditing
• Audit Custom Message Properties
• If unchecked custom properties associated with
messages will not be stored in the Neuron ESB
database
• Audit Message Body
• If unchecked the body of the Neuron message will
not be stored in the Neuron ESB database
• Audit messages before publish process executes
• If checked messages will be stored to the Neuron ESB
database prior to the execution of business Processes
associated with the publisher
• Audit messages after receive process executes
• If checked messages will be stored to the Neuron ESB
database after they are processed by any business
processes associated with the subscriber
6. Monitoring Neuron ESB
Topic Level Auditing
• Audit published messages when there are no
recipients
• If checked messages will be stored in the Neuron
ESB database even if no subscribers are listening to
the topic
• Use verbose detail when auditing message failures
• If checked failed messages stored in the Neuron
ESB database will have verbose detail included in
the message being stored (Affects the Audit
Business Process Step)
• Audit messages asynchronously
• If unchecked messages will be audited
synchronously, and will wait for the previous audit
to complete before it is allowed to be audited
(Affects the Audit Business Process Step)
7. Developing and Hosting REST APIs
Topic Level Auditing
• Captures every message sent or received by parties
on a topic
• Used primarily in debugging scenarios
• Not ideal for production use as it clutters the database
with unnecessary messages
• Selective auditing of messages under specific scenarios
as determined by the business process
• Used for production situations where the auditing of
messages should be controlled based on business logic
Topic Level Auditing vs Process Level Auditing
Process Level Auditing
8. Topic Level Auditing : Demo
Purpose:
To familiarize users with topic level auditing in the Neuron ESB Explorer
Objectives:
To acquaint users with the following:
• Enabling topic level auditing
• Auditing before or after publish and receive business process events
• Understanding the difference between verbose detail in a failed message and non-verbose detail in a failed message
9. Monitoring Neuron ESB
Message History
• Messages can be viewed via the message history
tab
• Message history can be filtered
• Topic
• Date
• Maximum Number of Records
• Filter Dialog
• Right clicking a message allows you to:
• View the message
• Save the message to disk
• View related messages
• Delete a message from the Neuron ESB database
10. Monitoring Neuron ESB
Failed Messages
• Failed messages can be
viewed via the failed messages history tab
• Failed message history can
be filtered
• Topic
• Date
• Maximum Number of Records
• Filter Dialog
• Right clicking a message will allow you to
• View the message
• Save the message to disk
• View related messages
• Delete a message from the Neuron ESB database
11. Monitoring Neuron ESB
Filter Dialog
The filter dialog allows you to filter messages based
on specific criteria
• Supports basic operands
• Supports filtering on custom properties
• Supports AND / OR
12. Monitoring Neuron ESB
Message Viewer
The message viewer provides you with a
snapshot the audited message
• Message Body
• Neuron Properties
• Custom Properties
The message viewer also provides you the
ability to republish the message, or save it to
disk.
13. Monitoring Neuron ESB
Message Viewer
Failed messages are shown in the Failed Message
Viewer, which has all the same functionality of the
Message Viewer, but additionally provides
• The date the message failed
• The type of exception that was thrown
• The message associated with that
exception
Failed Messages can be generated when
• A policy is configured to send the message to
the failed database, after retries are exhausted
• When the neuron runtime catches an
unhandled exception in any endpoint or
process provided there is a source message to
capture
• When the Audit Step’s action property is set to
Failure.
14. Monitoring Neuron ESB
Message Viewer
• Messages can be republished as a selected
party to a specific topic that party has access
to
• Messages can be republished to a topic or
directly to an endpoint
15. Monitoring Neuron ESB
“Republishing failed” messages to the same topic may not always be the best option. Especially if the
message was audited after a business process has already been run on the message.
• Republish to a new topic that does not have an attached business process
• Republish to an Error topic that Routes the message to the correct Topic based on the Neuron Topic Property
• Republish directly to an endpoint that is the original recipient of the message
• If the business process audits the original message, and not the message as it looks after processing, you can publish
back to the original topic
Strategies for Republishing Messages
16. Message History and Viewing : Demo
Purpose:
To familiarize users with the Message Viewer and Failed Message Viewer in the Neuron ESB Explorer
Objectives:
To acquaint users with the following:
• View audited messages
• View failed messages
• Inspect message properties
• Republish messages
17. Monitoring Neuron ESB
Active Session Reporting
• Displays information per party about activity
performed by that party
• Displays multiple instances of the party, if the
party has subscriptions to multiple topics
• Displays information about applications
remotely connected to the bus via the
Neuron Client API
18. Active Session Reporting : Demo
Purpose:
To familiarize users with active session reporting in the Neuron ESB Explorer
Objectives:
To acquaint users with the following:
• Active session report screen
• Running active session reports
19. Monitoring Neuron ESB
Endpoint Health
• Displays information about endpoints
registered with Neuron ESB
• Endpoints can be stopped or restarted
• If an endpoint is configured for multiple
machines, it can be stopped or restarted on
the current machine, or on all machines that
it is configured to run on
• Endpoint hosts can be started and stopped
in the same way as other endpoints
20. Endpoint Health : Demo
Purpose:
To familiarize users with Endpoint Health in the Neuron ESB Explorer
Objectives:
To acquaint users with the following:
• Monitoring endpoint health
• Stopping a running service
• Starting a stopped service
21. Monitoring Neuron ESB
Windows Management Instrumentation (WMI)
• WMI is a set of specifications from Microsoft for
consolidating the management of devices and
applications in a network from Windows
computing systems.
• It provides users with information about status of
local or remote computer systems through events
and performance counters.
• Neuron ESB uses WMI to expose performance
metrics, which can be consumed by third-party
tools, for reporting and monitoring purposes
• Zones, in the Deployment section of the Neuron
ESB Explorer, has two settings for performance
counters
22. Monitoring Neuron ESB
Windows Management Instrumentation (WMI)
• Neuron ESB also uses WMI events to allow
for monitoring of Neuron ESB using tools
that subscribe to these WMI events
• Failed Message events
• Failed message events receive a
copy of the failed message
• Endpoint status change events
• An application which monitors WMI events
can be used to subscribe to events raised by
Neuron ESB
23. Monitoring Neuron ESB
Windows Management Instrumentation (WMI)
• In order to use WMI events and performance
counters in Neuron ESB, you must have
installed the ESB service Management
Objects when initially installing Neuron ESB
• If you did not install the ESB Service
Management Objects during the initial
installation of Neuron ESB, you can use the
Powershell scripts provided by Neuron ESB
to do so
24. Windows Management Instrumentation : Demo
Purpose:
To familiarize users with WMI performance counters and events in relation to Neuron ESB.
Objectives:
To acquaint users with the following:
• Configuring Party and Topic / Endpoint performance counters
• View WMI performance counters
25. Monitoring Neuron ESB
REST API
Provides a REST API for information regarding
the Neuron instance
• API functions are broken up into 5 categories
• Activity
• Configuration
• Deployment
• Endpoint Health
• Runtime
• Allows users to perform actions without needing
access to the Neuron ESB Explorer
• Provides the ability to make minor modifications to
the configuration for a given instance of Neuron
ESB.
26. Monitoring Neuron ESB : Lab
Purpose:
To acquaint users with topic level auditing, as well as how to view audited messages in the Message History report
Objectives:
• Enable topic level Auditing
• Send a message on the topic
• View the audited message in the Message History report
27. Monitoring Neuron ESB
Review
• Topic level auditing can be used to capture all messages sent across a topic, both on publish and
on receive.
• “Use verbose details when auditing message failures” and “Audit messages asynchronously” affect
the audit process step in business processes.
• Active Session Reporting provides information on all endpoints connected to the Neuron ESB
instance.
• Endpoint Health can be monitored via the Neuron ESB Explorer and the Neuron ESB REST API and
provides a detailed view of the current state of the Neuron ESB endpoints.
• Message can be republished via the Message History and Failed Messages Report
• Messages can be republished to Topics or directly to an Endpoint
Editor's Notes
In this course you will learn more about auditing in Neuron ESB as well a how to monitor your Neuron ESB installation. We will take a look at topic level auditing and compare it to process level auditing as a means to capture messages. We will go over the message history and failed messages report, where audited messages can be found in the Neuron ESB explorer, and learn how to use them to view and republish messages that have been captured by Neuron ESB. We will take a look at how to monitor your Neuron ESB installation, from connected applications to the various endpoints that are in your Neuron ESB solution, through Active Sessions reporting and the Endpoint Health monitor, and discuss the differences between these two forms of monitoring. You will learn how to use Neuron ESB WMI events and performance counters, and finally we will take a look at the Neuron ESB REST API and how it can be used to manage and monitor certain aspects of your Neuron ESB solution and installation.
To facilitate our goals, this lesson has been broken down into six sections to help organize the information that is being presented. Those sections are Auditing, where we will take a look at topic level auditing and compare it to process level auditing. Audited Messages, where we will look at the Message History and Failed Messages reports, the message viewer and republishing strategies for messages that need to be replayed via Neuron ESB. Active Sessions reporting, where we will take a look at the Active Sessions report and understand what information it provides to the user. Endpoint Health, where we learn how to monitor and manage endpoints inside Neuron ESB. WMI, where we will take a look at how to use the WMI events in Neuron ESB as well as the performance counters that Neuron ESB exposes. Neuron ESB REST API, where we will look at the REST API that Neuron ESB provides and learn what functionality it allows users to manage or monitor.
Topic level auditing instructs Neuron ESB to audit all messages that are sent or received on a specific topic. With topic level auditing turned on, any message sent across that topic will be audited both when it is sent by the publisher and when it is received by the subscriber. This means that one message flowing across the bus will result in two messages being audited. Topic level auditing is configured via the auditing tab on a topic, and requires that a Neuron ESB database in configured for use.
As topic level auditing captures every message sent or received by parties on a topic, it is primarily used in debug scenarios where one might need to retain a copy of every message in a transaction. It is not a recommended auditing strategy for production use, as it results in numerous unnecessary messages being audited to the Neuron ESB database.
Process level auditing on the other hand is perfect for production as it allows Neuron ESB only to capture messages in accordance with business logic, making all audited messages pertinent to some business flow. Whether those be messages that have had an error while being processed, or messages where a confirmation of send or receive need to be captured, this form of auditing provides only messages that the company has deemed valuable and in need of capture.
Message history provides users with all messages audited in Neuron ESB that were not marked as failures during the audit process. Here users can see messages that were sent or received with out errors, either captured by topic level auditing or process level auditing, and filter through those messages based on a variety of criteria such as Topic, Data, Maximum Number of records and many more using the filter dialog. Right clicking on a message record allows the users to view the message using the message viewer which will discuss later in this presentation, save the message to disk, view any related messages or delete the message from the Neuron ESB database.
Failed Messages provides users with the same functionality as Message History. However, the messages contained in this report are only those that were marked as failures when they were audited to the Neuron ESB database. Like Message History users can filter through those messages based on a variety of criteria such as Topic, Data, Maximum Number of records and many more using the filter dialog. And Right clicking on a message record allows the users to view the message using the message viewer, save the message to disk, view any related messages or delete the message from the Neuron ESB database.
The filter dialog, for both the Message History and Failed Messages reports, allows users to filter messages on a variety of criteria. Users can filter messages on Neuron specific properties such as Topic, Semantic or Instance, as well as custom properties that were attached to the message. The filter dialog supports And / Or, to allow users to find the exact messages they want by combining different filtering critera.
The message viewer provides users with a snapshot of the audited message. It provides users access to the message body, the Neuron properties for the message and even the custom properties that were attached to the message. From here users can view every aspect of the message as well as republish the message, should it need to be replayed, or save it to disk.
Back in the Repository lesson we talked about how saving messages into the Repository to use in testing was a good practice to get into. The ability to copy the message, or save it to disk, from the message viewer can help facilitate that. For example:
A message is sent via CRM to Neuron ESB, where it then must proceed through a business process before being passed on to the proper recipients of that message. In order to test the business process during design time you will need a copy of the message that was sent by CRM. Using topic level auditing we can capture the message as it comes into Neuron ESB via the publisher. Once we locate the message in the Message History report, we can then open the message viewer to look at he message. Does the message contain custom properties? If not then we can just copy the message and paste it into the Repository for storage and then use that when we need to test the business process. If it does, we can save the message to disk instead, and then load the message from disk when testing the business process in order to retain the custom properties.
The message viewer for messages captured in the Failed Messages report is very similar to the one for messages captured in the Message History report. The main difference is that for messages captured in the Failed Messages report, the error associated with the message is also displayed. The date of the error, the type of error that was thrown, and the error message are all captured by Neuron ESB and displayed in this viewer for users to see. This can tell a user why a particular message failed without the need to go to the log files, or debug through a process in order to determine what the cause was.
Remember a failed message can be generated not just by a business process, but also when a policy is set to send messages to the database after retries are exhausted, or when the Neuron runtime catches an unhandled exception in any endpoint or process.
From the message viewer, both the one associated with successful messages and the on associated with failed messages, users can republish a message to Neuron ESB. Messages can be republished to a specific topic as a specific party. Going back to our example from earlier, if CRM is sending a message to Neuron ESB and I have captured that message and used it to develop a business process, I may want to test that business process at runtime, rather than design time, but not have to reissue it from CRM. I can use the republish aspect of the message viewer to achieve this by sending the message on the original topic, and telling Neuron to do so as the party that CRM is associated with.
Messages can also be delivered to specific endpoint directly. For example, if a message has been transformed via a business process and was unable to be delivered to a service endpoint because it was down, once the endpoint came back up there would be no point republishing it to the topic as a party. The message is now in a different format than what is expected by the business process, and going through the business process again would be superfluous. Sending the message directly to the endpoint would complete the intended transaction.
Knowing what the republishing strategy is for your company is important as that will play a large role in determining the auditing strategy for your Neuron ESB solution. Messages can be republished a variety of ways, to ensure that they get to the correct destination.
If a message has already been through a business process it can be republished to a topic that does not have a business process attached, but uses the same publishers and subscribers. This would not be the most ideal scenario, as it would require your solution to have a two topics for every business flow, one with a process and one without, effectively doubling the size of your solution.
Having an error topic to republish to, which uses the Neuron Topic property to send messages back to their original topic, is another strategy for republishing. This will allow you to send all messages to a single topic which will dynamically route them to the correct topic, no need for the user to know where it was supposed to go. However, this has it draw backs as well, since a message that has already been transformed by a business process cannot go back through that business process as second time.
Republishing a message directly to and endpoint is a good strategy for messages that have been through a business process and are already in the format that the endpoint requires. Normally this situation occurs when the endpoint was down and needed to be brought back up for the message to be delivered.
Having the business process audit the original form of the message, rather than the transformed form, is usually the best option. This can then be used in conjunction with re-publishing directly to an endpoint to form a complete re-publishing strategy. If the message cannot be handed directly to the endpoint you can republish it to the original topic as the original party, and it will go through the business process as if it was just delivered. If the message is done processing and just needs to be delivered to the endpoint then you can hand it off directly. Using these two strategies together provides you full coverage and set plan as to how, when and to where you are going to republish, and a proper audit strategy can be formed with that in mind.
Active session reporting provides you an overview of every party that is currently connected to the Neuron ESB instance. This includes not only parties being hosted by Neuron ESB endpoints such as service and adapter endpoints, but also remotely connected parties such as .NET applications using the Neuron Client API. Active session reporting shows a unique instance of a party for every endpoint using it and connected to the Neuron ESB instance. This means that if there are 6 instances of a service endpoint running, all with the same party, there will be 6 records of that party shown in active session reporting.
Endpoint health provides you a detailed overview of every endpoint hosted by Neuron ESB in a Neuron ESB endpoint host. This means that service endpoints, adapter endpoints and workflow endpoints will all appear in endpoint health. However, applications using the Neuron Client API will not appear here as they are not Neuron managed endpoints hosted by Neuron ESB’s endpoint hosts.
Endpoint health provides information about the topics in your solution, such as the rate of messages being published or received by the endpoint. How many messages the topic has processed since the last time the instance was recycled. How many errors or warnings have occurred on the topic since the last time it was recycled.
Endpoints on the other hand provide a bit more information, such as how many messages are actively being processed by the endpoint, how many messages are pending on the endpoint or have been completed by the endpoint. Are there any messages that have been aborted due to errors or suspended because of a fault? As well as how many warnings or errors have occurred on the endpoint since last it was recycled.
Not only does endpoint health provide you with information about the status of the endpoint over a period of time, but it also enables you to manage the endpoints. You can stop or restart an endpoint, either on the current machine or on all machines in which your solution is running. You can clear out the errors and warnings for the solution, using the Clear Panel button, to reset the counts back to zero, if you are looking to get current metrics and you can even change how often endpoint health refreshes the information that it is providing (by default it refreshes every 10 seconds) through the Tools -> Options menu selections.
WMI is a set of specifications from Microsoft for consolidating the management of devices and application in a network on Windows computing systems. Neuron ESB makes use of WMI by providing information about the status of local or remote system through the use of events and performance counters.
WMI supports properties, events and methods on top of classes of objects provided by other systems such as Simple Management Network Protocol (SNMP) as well as a more powerful query language which makes it more powerful and able to provide a better picture of the state of the systems operating within the enterprise.
Control of WMI performance counters can be found on the Server tab of the Zones option under the Deployment tab of the Neuron ESB Explorer. From here you can choose to use counter for Neuron ESB parties as well as topics and endpoints.
(https://docs.microsoft.com/en-us/windows/desktop/wmisdk/about-wmi)
Neuron exposes a number of performance counters via WMI, such as errors and warnings, message rates, failed messages (with a copy of the Neuron ESB Message that failed), status changes in endpoints of the Neuron ESB solution running on the Neuron ESB instance.
These performance counters can be monitored by any application capable of monitoring WMI events, such as Performance Monitor in Windows.
In order to make use of WMI in Neuron ESB you must ensure that the ESB Service Management Objects were installed when installing Neuron ESB on a system. While this option is selected by default it is possible, though highly discouraged, to unselect it at the time of install. If you are not sure whether or not the ESB Service Management Objects were installed on the system, you can use the PowerShell scripts provided by Neuron ESB to install them. These scripts are located in <Neuron ESB Root install location>/Neuron ESB v3/PowerShell. Run the CreateManagementObjects script followed by the RegisterwmiEvents script to ensure that WMI events are installed properly on your system.
The Neuron ESB REST API provides information on the Neuron ESB instance as well as the ability to make changes or manage the functionality of the Neuron ESB instance. The REST API, which we will look at in depth in the next demo, breaks API functions into 5 categories (Activity, Configuration, Deployment, Endpoint Health and Runtime) with each section providing functionality specific to that particular category. This REST API makes it possible for employees such as Dev Ops to manage and work with the Neuron ESB solution and Instance without giving them full access to the Neuron ESB Explorer.