1. 2016 ICM
Problem F
Modeling Refugee Immigration Policies
With hundreds of thousands of refugees moving across Europe and more arriving each day, considerable
attention has been given to refugee integration policies and practices in many countries and regions.
History has shown us that mass fleeing of populations occur as a result of major political and social unrest
and warfare. These crises bring a set of unique challenges that must be managed carefully through
effective policies. Events in the Middle East have caused a massive surge of refugees emigrating from the
Middle East into safe haven countries in Europe and parts of Asia, often moving through the
Mediterranean and into countries such as Turkey, Hungary, Germany, France, and UK. By the end of
October 2015, European countries had received over 715,000 asylum applications from refugees.
Hungary topped the charts with nearly 1,450 applications per 100,000 inhabitants, but with only a small
percentage of those requests granted (32% in 2014), leaving close to a thousand refugees homeless per
every 100K residents of the country. Europe has established a quota system where each country has
agreed to take in a particular number of refugees, with the majority of the resettlement burden lying with
France and Germany.
The refugees travel multiple routes – from the Middle East through (1) West Mediterranean, (2) Central
Mediterranean, (3) Eastern Mediterranean, (4) West Balkans, (5) Eastern Borders, and (6) Albania to
Greece (See these routes mapped out in http://www.bbc.com/news/world-europe-34131911). Each route
has different levels of safety and accessibility, with the most popular route being Eastern Mediterranean
and the most dangerous, Central Mediterranean. Countries that have been burdened the most are
concerned about their capacity to provide resources for the refugees such as food, water, shelter, and
healthcare. There are numerous factors that determine how the refugees decide to move through the
region. Transportation availability, safety of routes and access to basic needs at destination are considered
by each individual or family in this enormous migration.
The UN has asked your team, the ICM-RUN (RefUgee aNalytics) to help develop a better understanding
of the factors involved with facilitating the movement of refugees from their countries of origin into safe-
haven countries.
Your Specific Tasks:
1. Metrics of refugee crises. Determine the specific factors which can either enable or inhibit the
safe and efficient movement of refugees. There are attributes of the individuals themselves, the
routes they must take, the types of transportation, the countries’ capacity, including number of
entry points and resources available to refugee population. This first task requires ICM-RUN to
develop a set of measures and parameters and justify why they should be included in the analysis
of this crisis.
2. Flow of refugees. Create a model of optimal refugee movement that would incorporate projected
flows of refugees across the six travel routes mentioned in the problem, with consideration of
transportation routes/accessibility, safety of route and countries’ resource capacities. You can
include different routes, different entry points, single or multiple entry points, and even different
countries. Use the metrics that you established in Task 1 to determine the number of refugees, as
well as the rate and point of entry necessary to accommodate their movement. Be sure to justify
2. any new elements you have added to the migration and explain the sensitivities of your model to
these dynamics.
3. Dynamics of the crisis. Refugee conditions can change rapidly. Refugees seek basic necessities
for themselves and their families in the midst of continuously changing political and cultural
landscapes. In addition, the capacity to house, protect, and feed this moving population is
dynamic in that the most desired destinations will reach maximum capacity the quickest, creating
a cascade effect altering the parameters for the patterns of movement. Identify the environmental
factors that change over time; and show how capacity can be incorporated into the model to
account for these dynamic elements. What resources can be prepositioned and how should they
be allocated in light of these dynamics? What resources need priority and how do you incorporate
resource availability and flow in your model? Consider the role and resources of both government
and non-government agencies (NGOs). How does the inclusion of NGO’s change your model and
strategy? Also consider the inclusion of other refugee destinations such as Canada, China, and
the United States. Does your model work for these regions as well?
4. Policy to support refugee model. Now that you have a working model, ICM-RUN has been
asked to attend a policy strategy meeting where your team is asked to write a report on your
model and propose a set of policies that will support the optimal set of conditions ensuring the
optimal migration pattern. Your UN commission has asked you to consider and prioritize the
health and safety of refugees and of the local populations. You can include as many parameters
and considerations as you see fit to help to inform the strategic policy plan, keeping in mind the
laws and cultural constraints of the effected countries. Consider also the role and actions of non-
governmental organizations (NGOs).
5. Exogenous events. In addition to endogenous systemic dynamics, exogenous events are also
highly likely to occur and alter the situation parameters in these volatile environments, For
example, a major terrorist attack in Paris, France has been linked to the Syrian refuge crisis, and
has resulted in substantial shifts in the attitudes and policies of many European countries with
respect to refugees. The event has also raised concerns among local populations. For example,
Brussels, Belgium was placed in a lockdown after the Paris raids in attempts to capture possible
terrorists.
a) What parameters of the model would likely shift or change completely in a major exogenous
event?
b) What would be the cascading effects on the movement of refugees in neighboring countries?
c) How will the immigration policies that you recommend be designed to be resilient to these
types of events?
6. Scalability. Using your model, expand the crisis to a larger scale – by a factor of 10. Are there
features of your model that are not scalable to larger populations? What parameters in your model
change or become irrelevant when the scope of the crisis increases dramatically? Do new
parameters need to be added? How does this increase the time required to resolve refugee
placement? If resolution of the refugee integration is significantly prolonged, what new issues
might arise in maintaining the health and safety of the refugee and local populations? What is the
threshold of time where these new considerations are in play? For example, what policies need to
be in place to manage issues such as disease control, childbirth, and education?
3. The Report: The UN Commission on Refugees has asked your ICM-RUN team to provide them a 20-
page report that considers the factors given in your tasks. Each team should also write a 1 page policy
recommendation letter which will be read by the UN Secretary General and the Chief of Migration.
Your ICM submission should consist of a 1 page Summary Sheet, a 1 page letter to the UN,
and your solution (not to exceed 20 pages) for a maximum of 22 pages. Note: The appendix
and references do not count toward the 22 page limit.
The Commission has also provided you with some on-line references that may be helpful:
http://www.bbc.com/news/world-europe-34131911
http://www.iom.int/
http://iussp2009.princeton.edu/papers/90854
http://www.unhcr.org/pages/49c3646c4d6.html
http://www.nytimes.com/2015/08/28/world/migrants-refugees-europe-syria.html?_r=0
http://www.who.int/features/qa/88/en/
http://www.euro.who.int/en/health-topics/health-determinants/migration-and-health/migrant-health-in-
the-european-region/migration-and-health-key-issues
https://www.icrc.org/en/war-and-law/protected-persons/refugees-displaced-persons
4. For office use only
T1 ________________
T2 ________________
T3 ________________
T4 ________________
Team Control Number
54049
Problem Chosen
F
For office use only
F1 ________________
F2 ________________
F3 ________________
F4 ________________
2016
MCM/ICM
Summary Sheet
(Your team's summary should be included as the first page of your electronic submission.)
Type a summary of your results on this page. Do not include the name of your school, advisor, or team members on this page.
In this paper we aim to analyze and contextualize key aspects of the refugee crisis, one of the most
prominent and complex problems ever to face the European Union. The vast scale of this
humanitarian disaster combined with its complex economic and logistical challenges has changed the
political landscape within Europe and has sent vibrations throughout the world. Dividing opinions
across Europe and pushing international relations to breaking point, threatening the future of the
European Union itself. That is not to mention the incomprehensible level of human suffering that has
become synonymous with the refugee crisis, for this reason alone we must be diligent in finding the
most appropriate solution that puts the health and wellbeing of both refugees and residents as the
uppermost priority. With more than one million migrants and refugees crossing into Europe in 2015,
and more than 3,695 migrants reported to have died this year alone, this crisis has encapsulated the
very zeitgeist of modern day Europe and will continue to do so for many years to come.
In this paper we employ a number of theoretical approaches to determine what factors are
significant in the safe and efficient movement of refugees and to develop a number of models for
refugee movement throughout Europe. With over 715,000 asylum applications to countries within
Europe by the end of October 2015, few of which having actually been granted and no official quota
system yet in place, we have made the best effort to make reasonable assumptions based on the most
recent data. Though this is a dynamic problem with a magnitude of factors to consider. Which has
only arisen in recent times and therefore only limited data is available.
One of the most prominent considerations of this problem is that of the fair allocation of
refugees throughout European countries, our approach seeks to minimize the total distance travelled
by refugees while also considering the capacity of a country by virtue of its resources per capita and
its level of hostility towards the refugee population. Our approach draws heavily from the field of
statistics and network theory. To find the expected population of a European country and thus
determine the capacity of a country, we have utilized a general linear model with response variable
population and factors that proved to be significant such as; GDP, Hospital Beds, etc. The
assumptions of the general linear model are also seems to be justified in this case. To determine the
hostility of a country we similarly defined the response variable as the number of hate crimes and the
significant factors where determined as the population of a country and the number of votes for right
wing nationalist parties in the last general election.
To determine the most efficient method of solving the logistical problem we utilized a
standard flow network on a directed graph with capacities on the arcs defined as the projected flow of
refugees across the six predetermined starting routes and the capacities of the countries. Then
defining the costs of the arcs spanning from the vertex representing the initial routes and the
countries as the shortest distance. We were able to use Berge’s superior path method to determine the
total flow in the network. Of course one should consider the use of flow augmenting chains in the
model which is one of the limitations of our approach. Minimizing the total cost will in theory result
in the total distance refugees are required to travel to reach their destination country.
In conclusion we have found the optimal model for refugee movement according to our
assumptions and the fairest allocation of refugees based on a countries resources. With considerations
towards the hostility of a country as to ensure the safety of refugees in their host countries during
integration. We have also modelled the cascade effect of real refugee movement to the most desired
countries of residence. We conclude that the model is theoretically scalable up to 25 times the
predicted flow though in reality this would change the parameter estimates.
5. United Nations
Palais des Nations,
1211 Genève, Switzerland
01/02/2016
Dear Mr Ban Ki-moon and Mr Peter Sutherland,
I hope you are both well,
I am writing to you to offer the conclusions from research conducted by my team and I regarding the
current refugee crisis. Before I go into detailed results I would like to discuss the assumptions we
made to develop our models.
One of the more prominent assumptions of our model is that no legislation is to be passed
to discriminate against any particular demographic. We would expect policy makers from each
country to accept the new quota system and would recommend you consider this as an option.
Research would suggest migrants enter European territory via one of six predetermined routes, we
will advise these remain open. Though some routes are more hazardous than others, limited data
exists on the movement of refugees moving between these routes and hence we will only consider
the movement of refugees within Europe itself. To reduce the scale of the logistics problem we
would expect all intermediate countries to operate an open borders policy to allow the free
movement of refugees and for refugees to enter the closest of three predetermined entry points to
the destination country. Please be aware we considered 20 countries chosen at random to base our
research upon.
With consideration of exogenous events we determined for example that the number of
terrorist attacks was a significant factor in quantifying the hostility of a country, the hostility of a
country we define as the number of hate crimes committed. We also linked the number of votes for
nationalist (right wing) organisations in the latest general election to the hostility of a country. To
ensure the safe integration of refugees into a multicultural community we would advise against
housing refugees in host countries that fit these criteria.
Our research also identified a number of countries that have considerably more resources
per capita than others member countries within the European Union. For the countries classified not
to be hostile that fit this criteria we conclude they would be eligible to house refugees. Countries
that are classified as hostile but have an abundance of resources should expect to contribute to
hosting countries.
With regards to the cascade effect we used the total number of asylum applications per
country in 2015 to determine which country was considered as the most popular and considering
the lowest cost route representing the least distance and hence the initial arriving refugees. It is
believed that this model better describes the actual movement of refugees. We have included
simulations of both the optimum model and the cascade model to view at your leisure.
I hope this gives you both some insight into this terrible crisis and aids your future policy
making decisions. Thank you very much for your time it is most appreciated.
Kindest regards,
6. #54049 Page 1 of 33
Modelling Refugee Immigration Policies
February 6, 2016
Part I
Introduction
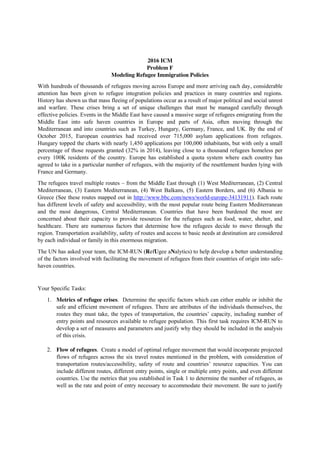
As the biggest effect from Syrian Civil War 2011, huge amount of refugees has attracted attention
from the world. Most of the refugees choose to immigrate to Europe because of the geographic
reasons, welfare system, develop level, etc. The safe movement of refugees became an issue as
thousands of deaths occurred on the way. With consideration of the routes taken by refugees, we
have the initial routes specified in the question. They are as follows; (1) West Mediterranean, (2)
Central Mediterranean, (3) Eastern Mediterranean, (4) West Balkans, (5) Eastern Borders, and (6)
Albania to Greece (Figure 1). These routes are undoubtedly a major factor in the safe movement
of refugees, according to the research we know for example the route from Libya to Italy is the
most hazardous (Central Mediterranean). Facing such situation, government might want to seek
for refugee movement plans to minimize the cost, not only for destination countries, but also for
refugees.
Figure 1: Refugee Movements Tendency
7. #54049 Page 2 of 33
Part II
System for optimal refugee movement
1 Mechanism
Our system consists of a number of key components. The first component in the model refers to
the safety of refugees within the host country by considering the hostility of the residence towards
refugees since we see safety as the most important consideration for refugees. We model the hostility
of a country by general linear model with response variable corresponding to the number of Hate
Crimes (2013), which means the criminal conducts motivated by bias or prejudice towards particular
groups of people. The factors of the model are defined as the population and number of votes in a
general election for right wing national parties in the latest general election. We can then determine
which countries can be considered as hostile towards the new refugee population and use this as a
constraint to determine which countries are too hostile to accept refugees. We found the expected
number of Hate Crime for each country considering the population and votes and calculate the
difference between the actual one and the expected one. We take the 75% quantile as the criteria.
If the difference for a country is below the 75% quantile line, it means that the country’s residents
are not hostile to some extent. Then we pick such countries as the destinations for refugees. For
the countries that are hostile, considering safety, we will not let refugees go there, but some of them
with ample resources need to provide resources for countries that are not hostile and do not have
enough resources to help the refugees.
The second component is devising the capacity of a country, which corresponds to the amount
of resources. To do this we utilise a general linear model relating the response variable of population
to the factors aforementioned. (GDP, Hospital Beds, Population, Education, Land Area, Welfare
Budget, Transportation.) In this pursuit we aim to determine the expected population for each
country given their amount of resources. Then using the residual plot to determine which countries
are below the expected value which would indicate they have ample resources compare to their
population. The residual can be used to determine the proportion of refugees should be allocated
to that particular country.
Using a max flow minimum cost networking algorithm, the final component of the model is to
consider the optimal allocation of refugees between chosen countries that is countries that we have
been able to allocate a capacity. The capacity corresponds to the proportion of the total refugees
that a country has the ability to grant asylum. The flow will be defined as the number of refugees
predicted to arrive from each of the six predetermined routes. We have limited data on the number
of refugees arriving from each of the six locations, hence to predict the flow for the model we will
take an average of the previous flow data.
8. #54049 Page 3 of 33
2 Assumption
After much deliberation on such a complex problem, we have identified the following factors that
enable or inhibit the safe movement of refugees and as such have based our assumptions for our
model with consideration of these factors. One factor proposed in the question was the attributes of
the refugees themselves. For example we should consider factors for race, age, gender, nationality,
spoken languages, literacy rate and religion. It is commonly known that certain demographics are
likely to be discriminated against by certain governments and residents within some host countries.
The successful integration of refugees into said host countries should considered carefully. Although
there has been evidence of policy makers acting against the interest of refugees in the past, it would
be too difficult to speculate as to which countries will create such policies in the future. Therefore
In our model we make the assumption that no certain demographic will be discriminated against
by any specific country. Which includes an assumption that no new legislation will be passed and
each selected country will cooperate with a quota system.
Within our model however we have not considered the possibility of effecting the entry points
of refugees to the European territories themselves. We have to make the assumption that the
refugees will continue to arrive at similar rates to which they have done in the past, so we will make
projections of flows according to the data on the number of people arriving. We must also reduce the
problem of allocation to within Europe itself. If we have to consider the movement of refugees from
the prescribed routes into Europe we would also have to take into consideration the risks involved
with transporting large quantities of people through countries with limited infrastructure. As there
is little data on the movement of refugees between each route we will assume the optimal solution
will be reduced to movements from the initial European country they enter to the country they will
eventually take up residence. We must also therefore make the assumption that refugees are equally
likely to die within each European country. We must define therefore the initial countries for each of
the routes, they are as follows; Spain (West Mediterranean), Italy (Central Mediterranean), Greece
(Albania to Greece), Border between Serbia Bosnia Herzegovina and Croatia (West Balkans), Greece
(East Mediterranean), border between Slovakia, Hungary and Ukraine (East Borders). We will make
the assumption that all the refugees will enter Europe via these starting countries dependent on
which route initially they take.
Another major factor in determining the most efficient and safe way to allocate refugees is
the transportation networks between countries. As for transportation we will choose to include
Transport Services (Percentage of service imports BoP) into the model. This will give an indication
as to the amount of money spent on transport infrastructure and hence should be included in the
model. As we should expect countries with improved infrastructure will have greater capacity. This
will give a general indication as to the formal modes of transportation e.g (Railways, Roads) but
will not account for people travelling by foot. This is perhaps an unrealistic assumption but due to
the large numbers of people we should expect to utilise formal modes of transportation to ensure
the wellbeing of the refugees. We must also make a further assumption that the travelling refugees
passing from intermediate countries do not exhaust the resources of that particular country. Again if
the refugees are assumed to be taking formal modes of transport, transit times should be negligible
and hence our assumption seems reasonable.
9. #54049 Page 4 of 33
For the number of entry points into a country, we will refer to the EU’s open boarder policy
which allows the free movement of people with little or no restrictions. For this reason we would
assume the best model would be for any part of the border to be referred to as an entry point.
However in our model we will assume the destination country will have three entrance points, chosen
arbitrarily with regards to their proximity to major transport networks, proximity to surrounding
cities and likely refugee movement. We will be defining the distances between countries as the
minimal distance between the start point (the point at which the refugee enters a starting country)
and the closest entrance point of the destination country. We will also be making the assumption
that refugees can travel freely through any country without any restrictions geographical or otherwise
(including neglecting entry points to intermediate countries) to reach their destination country. The
optimal model would be to use a shortest path algorithm to determine the shortest path from
the starting country through the entry/exit points of intermediate countries and hence by using
Dijkstra’s algorithm we could determine the least distance route.
For the assumptions of the general linear model, it is reasonable to assume that the responses
are independent as the population of a certain country does not depend on the population of another.
To verify the assumption of normality of residuals we can use a Q-Q plot.
There are four kinds of countries now.
A := {Countries that are not hostile and have enough resources}
B := {Countries that are not hostile and do not have enough resources}
C := {Countries that are hostile and have ample resources}
D := {Countries that are hostile and do not have enough resources}
Countries in A need to accept the refugees using their own resources. Countries in B will
accept refugees using other countries resources. Countries in C need to provide such exceeding
resources to those who are not hostile and do not have enough resources. Countries in D will be
ignored. We calculated the capacity according to the residual between the expected population and
the real one. For the countries in A, their own residuals will be their capacities. For countries in
B, their capacities will be the mean of residuals for countries in C. Countries in C and D will not
accept refugees in their own countries.
3 Data
To model the capacity of a country we must consider the factors relating to resources of that partic-
ular country. After significance testing we found the most reasonable factors to be included in the
model are; GDP, Hospital Beds, Population, Education, Land Area, Welfare Budget, Transporta-
tion. So we can conclude these factors are appropriate for determining the capacity of a country
as they are measures of the number of resources a country possesses relative to their population.
Within our model we interoperated the values according to the data available. GDP 2014 was
defined as market prices (current US$), Hospital beds 2011 (per 1,000 people), Population 2015,
Education staff compensation 2011, total (% of total expenditure in public institutions), Land Area
2014 (sq. km), Welfare (Health expenditure 2013, % of GDP), Transportation (Transport services
2014, % of service imports, BoP).
We choose geographic coordinates to display and calculate the distance, which relates to
10. #54049 Page 5 of 33
the “cost” in networking algorithm. We select 3 entrance on the country border for each of the 20
countries we randomly choose in EU. Together with 6 starting vertexes on the border of Europe,
there are 66 vertexes in our system (20 country with 3 entrances for each plus 6 starting points).
(Figure 2 with coordinates data see Appendix 6)
Figure 2: Multiple Entrances Display
4 Refugee Capacity Model
4.1 Brief Introduction
Introduction about General Linear Model:
General Linear Model is in the form of:
Y = B. ⇤ X + e, e ⇠ N(0, 2
⇤ In)
Where Y is the n*1 vector, X is an n*p matrix, B is a p*1 vector of parameters which are
unknown and e is the error vector whose elements follow normal distribution (Gary 1978). Hence,
when using this model, we need to check the independence and normality of residual.
4.2 Application
Due to the large number of countries in Europe, we just choose 20 countries to apply the model
and the choices are made randomly, and we label the countries according to its name by alphabet.
11. #54049 Page 6 of 33
First, we found out the level of hostility of each country. The detailed data related to hostility for
each country can be seen in Appendix 1.
The general linear model for hostility is as below:
Expected Hate Crime= - 482.275 - 0.002 * VoteForRightWingParty
Parameter Estimates
Dependent Value: HateCrime
Parameter B Std. Error t Sig.
95% Confidence Interval
Lower Bond
Upper
Bond
Intercept -482.275 3032.415 -0.159 0.876 -6880.111 5915.562
Population 0 9.41E-05 2.54 0.021 4.05E-05 0
VoteForRightWingParty -0.002 0.001 -1.517 0.148 -0.004 0.001
Since there points are reasonably close to the straight line in the Q-Q plot below (Figure 3),
the normality of residual could be justified. The result of hostility was shown in Figure 4 below and
the line in the plot is the 75% quantile line, below which are the non-hostile countries.
Figure 3 Figure 4
Second, we need to find out the capacity of each country that is not hostile. The table
containing the responses (population) and 5 covariates, the residual between the expected population
and the actual and also the capacity for each country is shown in Appendix 2.
The model for capacity is:
ExpectedPopulation = 7731236.415 + 2.155 ⇤ 10 5
⇤GDP + 272623.022 * Education + 16.8 *
LandArea - 3653249.811 * WelfareBudget + 865221.987 * HospitalBeds + 190010.105 *
Transportation
12. #54049 Page 7 of 33
Parameter Estimates
Dependent Value: HateCrime
Parameter B Std. Error t Sig.
95% Confidence Interval
Lower Bond Upper Bond
Intercept
7731236.415
18017637.92 0.429 0.675 -31193503.82 46655976.65
GDP 2.16E-05 1.91E-06 11.28 0 1.74E-05 2.57E-05
Education 272623.022 233742.983 1.166 0.264 -232347.992 777594.035
LandArea 16.8 12.419 1.353 0.199 -10.029 43.63
WelfareBudget
-
3653249.811
1027896.411 -3.554 0.004 -5873884.998 -1432614.623
HospitalBeds 865221.987 963984.573 0.898 0.386 -1217340.069 2947784.043
Transportation 190010.105 160778.246 1.182 0.258 -157330.178 537350.389
The Q-Q plot is shown below (Figure 5). Since points are reasonably close to the straight
line, we can consider them as normally distributed. R Squared = .955 (Adjusted R Squared = .934),
which is very close to 1. This suggests that the model fits the data well.
Then we can get the residual between the Expected Population and the real one. The plot of
residuals for each country is shown as below (Figure 6) and the line in the plot is the mean expected
population for all 20 countries.
Figure 5 Figure 6
The country below the line has less population compared to its resources. Considering both
hostility and population, we can divide the countries into 4 types and allocate the proportion of
capacity as mentioned before. The capacity for each non-hostile country is shown in Figure 7. Since
countries which are hostile will not accept refugees in their own country, their capacity will be zero.
13. #54049 Page 8 of 33
Figure 7
5 Refugee Flow Networks
We take distance between two points as the “cost” on each path in this Network. In this case, points
are displayed as the geographic coordinates and allocated on the surface of Earth, so we need to
consider radius of the sphere, which is 6371km for Earth. (Figure 8)
Figure 8: Distance on surface
We will quantify the problem as a standard flow network (Directed) with incorporated costs
for each arc. Intermediate vertex corresponding to the six initial paths taken by refugees and the
countries they will eventually take up residence. We would have to include of course the source and
the sink, which are theoretical manifestations. The capacity of the arcs from the source to each of
the initial six paths correspond to the projected flow of refugees. We will assume that the cost of
these path will be zero. We make this assumption because of the logistic problem in transferring
14. #54049 Page 9 of 33
refugees between starting locations, this assumption we have mentioned previously. In our initial
comprehension of the problem we considered adding fixed costs to prioritise refugees coming from
more hazardous routes. Using a standard minimal cost max flow algorithm we may have considered
these routes as the lowest cost routes and hence refugees that are more likely to die initially will
travel the shortest distance to their host country. To interpret this scenario however could be seen
as incentivising travel along these more hazardous routes. For that reason we have decided in this
model to make these fixed costs negligible. The capacity of the arcs from starting point to host
country will be infinite and the cost will be representative of the distance travelled from the starting
country to their destination country. Under the assumption that a refugee is as likely to die in any
European country we do not consider this factor in the cost of these arcs. The costs will simply
represent the shortest distance from the starting country to the destination country. The capacity
of the arcs from the destination country and the sink will represent the country’s capacity (The
amount of refugees the countries will take dependant on our previous model) and the cost will be
zero. This model reduces the total distance the refugees will have to move to their destination
countries and hence will be the optimal method of transporting refugees throughout Europe. Using
a max flow minimum cost algorithm such as Berge’s superior path method we will not consider
the maximum flow in the network as we have not considered flow augmenting chains but it will
be a good approximation to the maximum flow in the network at least cost but will not be the
minimum possible cost. For a more powerful algorithm as previously stated the introduction of
flow augmenting chains would improve the model. For the calculation of shortest distance we could
consider a country with entry points on ever border and consider using Dijkstra’s algorithm as
previously mentioned.
6 Results
Three main columns in the second table shows the flow data from one starting vertex to one des-
tination vertex, with three different scenarios: optimal model, optimal model with Cascade effect,
optimal model with exogenous events. Figure 9 shows the vertex and flow for each paths.
Figure 9: Optimal Model flows
16. #54049 Page 11 of 33
Part III
Discussion
7 Cascade Effect
7.1 Non-government Organizations
In the Cascade Effect scenario, only the parameters in Refugee Capacity Model will change, which
will effect the allocations for each country, the algorithm of Refugee Flow Networks do not change.
For cascade effect, we utilise the number of application for asylum to measure the level of
desired destination for each country. Taking safety as the most important consideration for refugees,
the hostile countries will not accept refugees no matter the desire to come for them. The detailed
rank data can be seen in Appendix 3. Once we have the ranks, we will consider the least cost arcs
from each initial route to the most desirable country. From this we will determine the maximum
possible flow in the least cost path.
Once the available capacity in the most desirable country is zero we then consider the second
most desirable country. We repeat this process until there is no available flow in the system. This
model is based on the assumption that the time to arrive from any of the predetermined starting
locations is proportion to the cost of the arc (The shortest distance from the starting point to the
closest of three entry points to the host country.) Hence the refugees that start at the shortest dis-
tance from their host country will arrive first and each of the countries will reach maximum capacity
in the order of their desirability. This is believed to be a more realistic model in comparison to that
of the model developed with Berge’s superior path method, however as neither of the models take
into consideration the time in transit the difference in result is merely a difference in allocation.
The general linear model including NGOs is shown as:
ExpectedPopulation =6048214.632+2.084*10 5
*GDP+194380.246*Education+16.784*LandArea-
2948670.347*WelfareBudget+718344.611*HospitalBeds+215499.685*Transportation+1469.765*NGOs
17. #54049 Page 12 of 33
Parameter Estimates
Dependent Value: HateCrime
Parameter B Std. Error t Sig.
95% Confidence Interval
Lower Bond
Upper
Bond
Intercept
6048214.632
16841697.85 0.359 0.726 -30646692.71
42743121.97
GDP 2.08E-05 1.83E-06 11.39 0 1.69E-05 2.48E-05
Education 194380.246 222853.538 0.872 0.4 -291175.901 679936.393
LandArea 16.784 11.589 1.448 0.173 -8.465 42.034
WelfareBudget
-
2948670.347
1043771.191 -2.825 0.015 -5222852.41
-
674488.284
HospitalBeds 718344.611 903615.812 0.795 0.442 -1250465.114
2687154.336
Transportation 215499.685 150765.816 1.429 0.178 -112990.808 543990.178
NGOs 1469.765 858.694 1.712 0.113 -401.169 3340.699
The points on the Q-Q plots (Figure 10) are reasonably close the straight line, which indicate
the justification of assumption of normal distribution. R Squared = .964 (Adjusted R Squared =
.943), which is close to 1. This suggests that the model fits the data well. The residual for each
country is plotted in Figure 11 and the horizontal line is the mean of expected population for all 20
countries. The points below the line are the countries have resources to hold more population.
Figure 10 Figure 11
After we classify the countries into 4 different groups, the methods to calculate the capacity
are the same as before. The capacity considering NGOs for each country is shown in Figure 12.
Figure 13 shows the vertex and flow for each paths.
18. #54049 Page 13 of 33
Figure 12
Figure 13: Cascade Model flows with NGOs
7.2 Exogenous Events
• Taking a terrorist attack as an example for the exogenous event, the parameters that will
shift after an attack could be GDP, Vote for Right-Wing Party, hostility and the number of
terrorist attack. The reason for the change of last parameter is obvious. GDP will decrease,
since shops will close for a while after a terrorist attack and tourism for the certain country
will be negatively affected. Vote for Right-Wing Party may increase since they are people who
are xenophobia and discriminate the minors and local residents usually blame terrorist attacks
19. #54049 Page 14 of 33
on foreigners. The hostility for each country will change after a major exogenous event. Since
we cannot predict the change for GDP and Vote, to see the change, we build a new general
linear model just including number of terrorist attacks as a factor to evaluate the hostility.
The detailed data about hostility can be seen in Appendix 4.
The general linear model including number of terrorist attack is shown as below:
ExpectedHateCrime=519.394-4.501 ⇤ 10 5
*Population+1006.419*TerroristAttack-
8.624 ⇤ 10 5
*VoteForRightWingParty-9.88 ⇤ 10 6
*Population*TeorristAttack
+1.452 ⇤ 10 10
*Population*VoteForRIghtWingParty-
0.003*TerroristAttack*VoteForRightWingParty+2.877 ⇤
10 11
*Population*TerroristAttack*VoteForRightWingParty
Parameter Estimates
Dependent Value: HateCrime
Parameter B Std. Error t Sig.
95% Confidence Interval
Lower Bond
Upper
Bond
Intercept 519.394 768.517 0.676 0.512 -1155.062 2193.849
Population -4.50E-05 3.34E-05 -1.346 0.203 0 2.78E-05
TerroristAttack 1006.419 352.732 2.853 0.015 237.882 1774.955
VoteForRightWing-
Party
-8.62E-05 0.001 -0.075 0.942 -0.003 0.002
Population *
TerroristAttack
-9.88E-06 5.25E-06 -1.881 0.085 -2.13E-05 1.57E-06
Population * VoteFor-
RightWingParty
1.45E-10 5.93E-11 2.447 0.031 1.59E-11 2.74E-10
TerroristAttack *
VoteForRightWing-
Party
-0.003 0.001 -3.079 0.01 -0.005 -0.001
Population *
TerroristAttack *
VoteForRightWingParty
2.88E-11 9.64E-12 2.986 0.011 7.78E-12 4.98E-11
Figure 14 illustrates that the assumption of normal distribution for residual, since the points
in the Q-Q plot are reasonably close to the straight line. The R squared parameter equals
0.990 (Adjusted R Squared = .985) and it is close to 1, which means that the model fits the
data well. Figure 15 shows the hostility for each country and the horizontal line in the plot is
the 75%-quantile line, countries below which can be considered not hostile.
20. #54049 Page 15 of 33
Figure 14 Figure 15
After taking Terrorist Attack into account, the result of hostility for each country has some
changes. For example, UK was thought of as hostile before, but considering Terrorist Attack,
it is not. It means that since UK has relative fewer Hate Crime compared to the large amount
of Terrorist Attack happened there, it is reasonable to say the residents there are not hostile.
Then we utilize the same general linear model of population without NGOs and find the
countries in A, B, C and D. Finally, the capacity proportion for each country can be computed
by the same methods, which is shown as below. (Figure 16) Figure 17 shows the vertex and
flow for each paths.
Figure 16
• For the cascade effect, we just change the countries that are considered not hostile through
the new constraints with Terrorist Attack. The cascading effect on the neighbouring countries
21. #54049 Page 16 of 33
could cause the number of refugees in these countries to increase and then decrease. It is
because people will move to the neighbouring countries after a certain country had a terrorist
attack, which leads to the increase of refugees in the neighbouring countries. After some time,
the number will decrease since the influence of the terrorist attack has fallen.
• The recommendation for the immigration policies to be resilient to the exogenous event will be
as follows. For the country where a terrorist attack happened, the government should have a
more slack immigration policy since people would want to leave the country where a terrorist
attack happened. While for the neighbouring countries, the government should have a more
rigorous immigration policy.
Figure 17: Cascade Model flows with Exogenous Events
8 Scalability
According to the general linear model for population, the absolute value of sum of total negative
residual is around 37794966. It means that if we set the mean expected population of 20 countries
as the limit for the whole population (original population plus the number of refugees) for each
country, the possible number of refugees that total 20 countries can accept is 37794966, which is
about 25 times of the current number of refugees arriving Europe per year. In this case, the model
could work even the crisis is expanded to a larger scale with a factor of 10.
However, in reality, this may not be true. Since the parameters we assumed unchanged in
the model may not be stable when a dramatic number of refugees have come. In fact, GDP, level of
medical treatment, education, transportation and welfare budget are very likely to change when the
population has changed to a large degree. Moreover, with a dramatic number of the new population,
hostility as a constraint will be irrelevant since population itself was a factor to influence hostility;
22. #54049 Page 17 of 33
consequently, we need to delete the factor: population and use a parameter other than hate crime
as the measurement of hostility.
For the influence of time needed to resolve the replacement, we assume the capacity for
transportation will be at the same level in the beginning and hence, the rate for refugees to come
into Europe will remain stable. As time goes by, the infrastructure in the camps and transportation
capacity would be improved; as a result, the rate for people to move will increase. Overall, the time
for refugees of 10 times to be replaced will be less than 10 years.
New issues should be considered when the time of replacement has increased. The integration
of these refugees as new residents covers many fields, such as the workplaces, childbirth, disease
control, education for children, stability of the society, police force and infrastructure for a larger
population.
For the threshold of time, it is assumed that some long-term issues do not need consideration
when the population has not reached a dramatically high level. However, some short-term and more
risky issues like disease control and police force to keep the society in safe should be considered
before refugees have come. For the long-term issues like childbirth, education, they should be paid
more attention after some years when a certain number of refugees need to face these issues. A more
specific model will be needed to generate the threshold time for such issues.
Different issues need different policies to deal with. The most important one could be related
to employment, since problems needed to be solved regarding the large population are also faced by
small population. If comparable enough people work in their position to make the society operate
in its usual way, then the replacement of refugees can be considered solved smoothly. Hence, the
policies should be focused on employment to make refugees workforce to keep the society operate
in its usual way. A possible policy could suggest the companies to provide suitable positions for
refugees and encourage the refugees to work to make money.
9 Others
Natural environment change and outbreak of disease could be the examples to illustrate social
and environmental dynamic factors, which might affect the refugee allocation plan for each of the
involving countries. For natural environment change, it could be measured by the difference of the
weather situation now and the usual one. For instance, if the winter this year is dramatically cold,
then refugee flow to Norway, Sweden and Finland might shrink. For disease, once the outbreak
happens, then the safety rate of this country will decrease, which will affect the refugees’ preference
on the destination.
In order to update the original Refugee Capacity Model with these potential environmental
factors, we can consider them as the one whole element or second condition by general linear model,
and combined it with main model and hostility level, so that the refugee amount for each country
will be reallocated. In other words, once one of the environmental factors been triggered, such as
bad weather condition or outbreak of disease, then the new environmental living level will be added
to the system as the second condition. The system will measure the hostility of a country first,
environmental living standard second, and finally is if the resources are enough.
For the preparation of resources, food and clothes will be the priority when meet bad weather,
23. #54049 Page 18 of 33
then professionals and medical resource will be priority when face disease problem, no matter this
country is self-supporting or hostile-country-supporting. Once the problems out, government needs
to maintain the social stability, hold the connections with other countries, and put more budgets
on goods and medical expenditure. Non-government organizations need to support the govern-
ment’s polices and actions first, and appeal for donation, volunteering. When Canada, China and
United State are added as the destination, our system will work in principal, but the economy and
applicability should be doubt as the distance is the cost in the net works.
Part IV
Recommendation
The optimal model provides different quota of refugees that each country should accept. Some
countries which are comparably hostile need to give their resources to other mild countries to
support refugees, which is under the consideration of safety for refugees. To meet the requirement
about quota, following policies may be conducted.
• All the countries should obey the quota of refugees allocated or quota of resources to provide.
• The affected countries need to control illegal border crossing by cooperation to avoid the
cascade effect.
For the policy to support the optimal models, we also need to look at the parameters that
the model is based on, which need to remain unchanged even when the refugees have come.
This is because if the parameters get changed, the model will become inappropriate for the
estimation of capacity for each country. The valuable policies could be like follows.
• Countries should try to control their GDP not affected by the arrival of refugees.
• Countries should keep basic infrastructure such as medical treatment, education, transporta-
tion and welfare budget in the same level compared to the new population. For example, the
hospital beds per 1000 people should remain the same.
Considering the integration of refugees, there are some important issues which need attention
to accelerate the pace of integration. Some relative policies should be conducted.
• Countries need to advertise the local law, since most refugees from outside the country may
not be familiar with it.
• The government and non-governmental organization should make their attempt to publicize
the idea that local people and refugees should respect each other’s culture.
• Government need to increase the police force to reduce hate crimes and avoid terrorist attacks.
24. #54049 Page 19 of 33
Part V
Conclusion
In conclusion we have found the optimal model for refugee movement according to our model and the
fairest allocation of refugees based on a countries resources and modelled the hostility of a country
as to ensure the safety of refugees in their host countries during integration. With consideration of
exogenous events we determined for example that the number of terrorist attacks was a significant
factor in quantifying the hostility of a country, the hostility of a country we define as the number of
hate crimes committed. We also linked the number of votes for nationalist (right wing) organisations
in the latest general election to the hostility of a country. Our research also identified a number of
countries that have considerably more resources per capita than others member countries within the
European Union. For the countries classified not to be hostile that fit this criteria we conclude they
would be eligible to house refugees. Countries that are classified as hostile but have an abundance
of resources should expect to contribute to hosting countries. We have modelled the cascade effect
of real refugee movement to the most desired countries of residence. We conclude that the model
is theoretically scalable up to 25 times the predicted flow though in reality this would affect the
parameter estimates.
25. #54049 Page 20 of 33
References
[1] All education staff compensation, total (% of total expenditure in public institutions), The
World Bank, n.d. Available from: <http://data.worldbank.org/indicator/SE.XPD.
MTOT.ZS>. [1 February 2016].
[2] Asylum and new asylum applicants - annual aggregated data, Eurostat, 2014. Available
from: <http://ec.europa.eu/eurostat/tgm/table.do?tab=table&init=1&language=
en&pcode=tps00191&plugin=1>. [1 February 2016].
[3] GDP at market prices (current US$), The World Bank, n.d. Available from: <http://data.
worldbank.org/indicator/NY.GDP.MKTP.CD>. [1 February 2016].
[4] Hate Crime Reporting, OSCE ODIHR, 2013. Available from: <http://hatecrime.osce.
org/>. [1 February 2016].
[5] Health expenditure, total (% of GDP), The World Bank, n.d. Available from: <http://data.
worldbank.org/indicator/SH.XPD.TOTL.ZS>. [1 February 2016].
[6] Hospital beds (per 1,000 people), The World Bank, n.d. Available from: <http://data.
worldbank.org/indicator/SH.MED.BEDS.ZS>. [1 February 2016].
[7] Land area (sq. km), The World Bank, n.d. Available from: <http://data.worldbank.org/
indicator/AG.LND.TOTL.K2>. [1 February 2016].
[8] List of active nationalist parties in Europe, Wikipedia, n.d. Available from: <https://en.
wikipedia.org/wiki/List_of_active_nationalist_parties_in_Europe>. [1 February
2016].
[9] List of European countries by Population, Statistical Times, 2015. Available from: <http:
//statisticstimes.com/population/european-countries-by-population.php>. [1
February 2016].
[10] Migrant crisis: Migration to Europe explained in graphics, BBC News, 2016. Available from:
<http://www.bbc.co.uk/news/world-europe-34131911>. [1 February 2016].
[11] Terrorist Attack, Global Terrorism Database, 2013. Available from: <http://www.start.
umd.edu/gtd/search/?back=1&casualties_type=&casualties_max=®ion=9>. [1
February 2016].
[12] Transport services (% of service imports, BoP), The World Bank, n.d. Available from: <http:
//data.worldbank.org/indicator/BM.GSR.TRAN.ZS>. [1 February 2016].
[13] Worldwide NGOs Directory, WANGO, n.d. Available from: <http://www.wango.org/
resources.aspx?section=ngodir&sub=list®ionID=0>. [1 February 2016].
[14] Zerbe, G 1978, ‘On Fieller’s Theorem and the General Linear Model’, The American Statisti-
cian, Vol. 32, No. 3 pp. 103-105. Available from: JSTOR. [1 February 2016].
26. #54049 Page 21 of 33
Appendix
Appendix 1
Countries Population
Votes for the
main
Right-Wing
Party in the
latest election
Hate Crime
recorded by
police
Residual for
hostility
Austria 8,557,761 962,313 110 278.59
Belgium 11,183,411 1,366,397 375 642.27
Bulgaria 7,112,641 258,481 651 -116.
Czech Republic 10,777,060 42,906 41 -1917.94
Denmark 5,661,723 741,746 110 580.51
Finland 5,460,592 524,054 904 1030.65
France 64,982,894 6,421,426 1765 -1992.3
Germany 82,562,004 635,135 4647 -13153
Greece 11,125,833 379,581 109 -1295.54
Hungary 9,911,396 985,029 43 -40.62
Italy 61,142,221 666,035 472 -12414.99
Netherlands 16,844,195 950,263 3614 1770.17
Norway 5,142,842 463,560 238 330.96
Poland 38,221,584 151,837 757 -7689.66
Portugal 10,610,014 17,548 21 -1930.35
Romania 21,579,201 108,911 25 -4034.87
Slovenia 2,079,085 19,786 45 66.02
Spain 47,199,069 7,215,752 1168 3445.86
Sweden 9,693,883 801,178 3943 3530.47
UK 63,843,856 1,667 47986 32909.88
Sources
Statistical
Times (2015)
Wikipedia
OSCE ODIHR
Hate Crime
Reporting (2013)
27. #54049 Page 22 of 33
Appendix 2
Country
Capac-
ity
Residualfor
Population
Popula-
tion
GDP(inUS$)
Hospi-
tal
Beds
Educa-
tion
Land
Area
Wel-
fare
budget
Trans-
porta-
tion
Austria3.70%-1397158.438,608,000436,887,543,4677.669.782,531.001132
Belgium5.44%19394.1811,259,000531,546,586,1796.584.530,280.0011.220
Bulgaria12.75%-4819777.657,185,00056,717,054,6746.470.7108,560.007.622
Czech
Republic
0.96%-362642.6410,535,000205,269,709,7436.849.577,230.007.223
Denmark8.83%-3337097.855,673,000342,362,478,7683.571.142,430.0010.650
Finland0.00%-3872058.575,460,592272,216,575,5025.559.5303,890.009.421
France5.44%1421003.8466,417,0002,829,192,039,1726.473.8547,557.0011.722
Germany13.73%-5187967.9181,276,0003,868,291,231,8248.270.9348,540.0011.323
Greece5.44%356168.710,769,000235,574,074,9984.867.3128,900.009.846
Hungary2.00%-756905.559,835,000138,346,669,9157.262.390,530.00823
Italy5.44%7986598.5360,963,0002,141,161,325,3673.473.7294,140.009.123
Nether-
lands
0.00%10948975.7716,933,000879,319,321,4954.769.533,670.0012.915
Norway23.15%-8751283.395,142,842499,817,138,3233.369365,245.009.614
Poland5.44%11642998.5638,494,000544,966,555,7146.562.7306,210.006.721
Portugal5.44%83169.810,311,000230,116,912,5143.48591,600.009.728
Romania0.97%-367024.8919,822,000199,043,652,2156.155.6230,030.005.317
Slovenia1.25%-473776.392,079,08549,491,440,6204.669.920,140.009.221
Spain0.00%5336656.8247,199,0691,381,342,101,7363.171.6500,210.008.933
Sweden0.00%-3529503.029,816,666571,090,480,1712.763.4407,340.009.712
UK0.00%-4939769.9165,081,2762,988,893,283,5652.976.8241,930.009.119
28. #54049 Page 23 of 33
Appendix 3
Countries Austria Belgium Bulgaria
Czech
Republic
Denmark
Rank 7 9 12 18 10
Countries Finland France Germany Greece Hungary
Rank 16 4 1 13 5
Countries Italy
Nether-
lands
Norway Poland Portugal
Rank 3 8 11 14 19
Countries Romania Slovenia Spain Sweden UK
Rank 17 20 15 2 6
35. #54049 Page 30 of 33
Capacity Flow:
1 % 29/01/2016 Refugee Flow
2 %http://www.bbc.co.uk/news/world-europe-34131911
3 %Predicted number of refugees arriving in europe is over 1.5million
4 %{
5 INPUT
6 Percentage_Capacity
7 %}
8 %Flow estimated from 2015 data in each starting point
9 Flow = [15498 139478 686787 644372 5709 8157];
10 Capacity = zeros(1,20);
11 Total_Flow = sum(Flow);
12 Capacity= Total_Flow*Percentage_Capacity ;
36. #54049 Page 31 of 33
Plot:
1 %Plot Digraph Including zero flows
2 %Competition2
3 Cascadem
4 [m,n] = size(Record);
5 Sort_Record = zeros(m,n);
6 s = zeros(1,m);
7 t =zeros(1,m);
8 weights =zeros(1,m);
9 count=1;
10 %Sort the Record by grouping the start points in increasing order
11 for k=1:6
12 for i=1:m
13 if Record(i,2) == k
14 Sort_Record(count,1)= Record(i,1);
15 Sort_Record(count,2)= Record(i,2);
16 Sort_Record(count,3)= Record(i,3);
17 count =count+1;
18 end
19 end
20 end
21
22
23
24
25 for j=1:m
26 s(j) = Sort_Record(j,2);
27 t(j) = Sort_Record(j,3)+6;
28 weights(j) = Sort_Record(j,1);
29 end
30
31
32
33
34 names = {’St1’ ’St2’ ’St3’ ’St4’ ’St5’ ’St6’ ’Austria’ ’Belgium’ ’Bulgaria’ ’Czech.R’ ’
Denmark’ ’Finland’ ’France’ ’Germany’ ’Greece’ ’Hungary’ ’Italy’ ’Netherlands’ ’Norway’ ’
Poland’ ’Portugal’ ’Romania’ ’Slovenia’ ’Spain’ ’Sweden’ ’UK’};
35
36
37 G = digraph(s,t,weights,names);
38 plot(G,’Layout’,’force’,’EdgeLabel’,G.Edges.Weight)
37. #54049 Page 32 of 33
Berge’s algorithm Standard network with cost:
1 % 29/01/2016
2 % berge’s algorithm Standard network with cost
3 % Refugee Sort ****NO AUGMENTATION CHAINS****
4
5 Capacity_Flow
6 distance_code
7 Record = zeros(1,3);
8 R = numel(Flow);
9 n = numel(Capacity);
10 counter =0;
11 b=[0 0 0] ;
12 x = max(Flow);
13 y = max(Capacity);
14 Total_Cost= 0;
15
16
17
18 while x~=0 && y~=0
19
20 %Minimum Distance
21 [M,I] = min(Distance_Matrix(:));
22 [I_row, I_col] = ind2sub(size(Distance_Matrix),I);
23 M = min(min(Distance_Matrix));
24 %Available capacity
25 Possible_Flow =0;
26 j = Capacity(I_col);
27 k = Flow (I_row);
28 if j >= k
29 Possible_Flow =k;
30
31 else
32 Possible_Flow = j;
33
34 end
35
36 %Recording Flow
37 if counter~=0
38 Record=[Record;b];
39 end
40 counter = counter +1;
41 Record(counter,1) = Possible_Flow;
42 Record(counter,2) = I_row;
43 Record(counter,3) = I_col;
44 Total_Cost= M*Possible_Flow + Total_Cost;
45
46 % Amend Capacity and Flow
47 Capacity(I_col) = Capacity(I_col) - Possible_Flow ;
48 Flow(I_row) = Flow(I_row) - Possible_Flow ;
49 % set infinite distances from the matrix which have no available flow / capacity.
38. #54049 Page 33 of 33
50
51 if Capacity(I_col) == 0
52
53 for t=1:R
54 Distance_Matrix(t,I_col) = inf;
55 end
56 end
57
58 if Flow(I_row) == 0
59
60 for t=1:n
61
62 Distance_Matrix(I_row,t) = inf;
63
64 end
65 end
66 y = max(Capacity);
67 x = max(Flow);
68 end