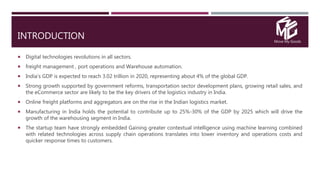
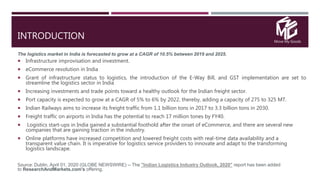
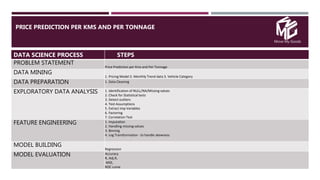
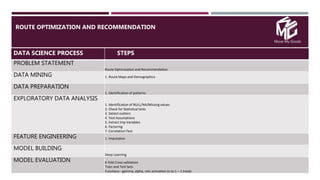
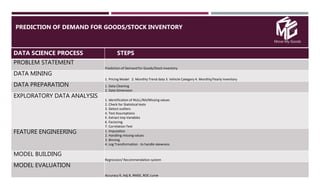
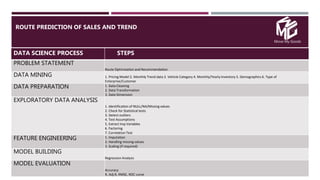
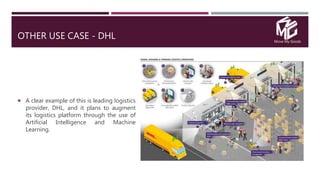
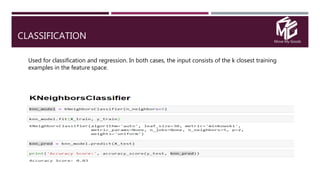
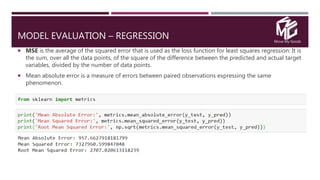
TRENDS IN DATA SCIENCE-
APPLICATION OF DATA SCIENCE IN LOGISTICS
JNN COLLEGE OF ENGINEERING, SHIMOGA
Move My
Goods
Digital Logistics
Platform
Move My Goods
AGENDA
 Introduction
 Fundamentals of Logistics
 Motivation
 How data science is applied in Transport and Logistics.
 Transformation in logistics
 Job Opportunities.
 Research
 Conclusion
Move My Goods
INTRODUCTION
 Digital technologies revolutions in all sectors.
 freight management , port operations and Warehouse automation.
 India's GDP is expected to reach 3.02 trillion in 2020, representing about 4% of the global GDP.
 Strong growth supported by government reforms, transportation sector development plans, growing retail sales, and
the eCommerce sector are likely to be the key drivers of the logistics industry in India.
 Online freight platforms and aggregators are on the rise in the Indian logistics market.
 Manufacturing in India holds the potential to contribute up to 25%-30% of the GDP by 2025 which will drive the
growth of the warehousing segment in India.
 The startup team have strongly embedded Gaining greater contextual intelligence using machine learning combined
with related technologies across supply chain operations translates into lower inventory and operations costs and
quicker response times to customers.
Move My Goods
INTRODUCTION
The logistics market in India is forecasted to grow at a CAGR of 10.5% between 2019 and 2025.
 Infrastructure improvisation and investment.
 eCommerce revolution in India
 Grant of infrastructure status to logistics, the introduction of the E-Way Bill, and GST implementation are set to
streamline the logistics sector in India
 Increasing investments and trade points toward a healthy outlook for the Indian freight sector.
 Port capacity is expected to grow at a CAGR of 5% to 6% by 2022, thereby, adding a capacity of 275 to 325 MT.
 Indian Railways aims to increase its freight traffic from 1.1 billion tons in 2017 to 3.3 billion tons in 2030.
 Freight traffic on airports in India has the potential to reach 17 million tones by FY40.
 Logistics start-ups in India gained a substantial foothold after the onset of eCommerce, and there are several new
companies that are gaining traction in the industry.
 Online platforms have increased competition and lowered freight costs with real-time data availability and a
transparent value chain. It is imperative for logistics service providers to innovate and adapt to the transforming
logistics landscape.
Source: Dublin, April 01, 2020 (GLOBE NEWSWIRE) -- The "Indian Logistics Industry Outlook, 2020" report has been added
to ResearchAndMarkets.com's offering.
Move My Goods
FUNDAMENTALS OF LOGISTICS
Move My Goods
LOGISTICS
 The term logistics comes from the late 19th century from French word “Logistique”
 Supply Chain management – Transforming a raw material into products and getting in to customers
 The term logistics comes from the late 19th century from French word “Logistique”
 Logistics is movement of materials in whole supply chain.
 “Logistics is about getting the right product, to the right customer, in the right quantity, in the right
condition, at the right place, at the right time, and at the right cost (the seven Rs of Logistics)”
 Transportation Just part of movement of goods in logistics
Move My Goods
LOGISTIC ACTIVITIES
Move My Goods
LOGISTIC ACTIVITIES
Move My Goods
LOGISTIC GOALS
Move My Goods
LOGISTIC COMPONENTS
• Inbound transportation
• Outbound transportation
• Fleet management
• Warehousing
• Materials handling
• Order fulfillment
• Inventory management
• Demand planning
• Marine Insurance
Move My Goods
WHY DATA SCIENCE IN LOGISTICS ?
Move My Goods
CHALLENGES IN LOGISTICS INDUSTRY
 High Order Intensity Ratio
 Transportation Roadblocks
 Rail Tariffs
 Port And Shipping Problems
 Lack Of Skilled And Specialist Personnel
 Slow Transition Into Newer Technologies
 Warehousing And Taxation Discrepancies
 Competition With Global Giants
 Customer’s Mindset
 Ever Increasing Fuel Costs
 Government Policies And Bottlenecks
 Shortage Of Drivers And Delivery Staff
Move My Goods
DATA-SCIENCE IN LOGISTICS
 Enable enhanced insights, decision making and process automation
 Reducing freight costs through delivery path optimization
 Dynamic price matching of supply to demand
 Warehouse optimization
 Forecasting demand
 Helps Supply Chain Industry drive costs and increase the velocity of turnover
 Improves visibility, quality and growth potential
 Boosts Operational efficiencies
 Raises profit margin
 Vehicle Traffic management and availability
Move My Goods
DATA SCIENCE PROCESS ?
Move My Goods
DATA SCIENCE
 Making data work for you.
 Use data to better describe the present or better predict the future.
 Data science / AI / Machine Learning /Deep Learning
 Data analytics has come a long way and we are now living in the age of Analytics 4.0 involving the use
of machine learning algorithms along with data analytics
Move My Goods
PROCESS
 The flow illustrates the steps involved in the process of building a data model
Move My Goods
IDENTIFY AVAILABILITY OF APPROPRIATE CATEGORY OF VEHICLE ON DEMAND

DATA SCIENCE PROCESS STEPS
PROBLEM STATEMENT
Identify Availability of Appropriate Category of Vehicle on Demand
DATA MINING
1. Get data of vehicles 2. Fleet data 3. Demographics 4. Goods Demand or Present transactional data
DATA PREPARATION 1. Data Cleaning
2. Data Scaling if required
3. Data Transformation
EXPLORATORY DATA ANALYSIS 1. Identification of NULL/NA/Missing values
2. Check for Statistical tests
3. PCA
4. Detect outliers
5. Test Assumptions
6. Extract Imp Variables
7. Factoring
8. Correlation Test
FEATURE ENGINEERING 1. Imputation
2. Handling missing values
3. Binning
4. Log Transformation - to handle skewness
5. One-hot encoding
6. Scaling
MODEL BUILDING
Classification/clustering
MODEL EVALUATION Confusion Matrix
Accuracy
Precision
Recall
Move My Goods
ROUTE MAPPING WITH MINIMUM COST REDUCE FUEL COST

DATA SCIENCE PROCESS STEPS
PROBLEM STATEMENT
Route mapping with minimum cost reduce fuel cost
DATA MINING
1. Transaction Data of fleet movement 2. Trip cost and fuel expense data
DATA PREPARATION 1. Data Cleaning
2. Data Scaling if required
3. Data Transformation
EXPLORATORY DATA ANALYSIS 1. Identification of NULL/NA/Missing values
2. Check for Statistical tests
3. PCA
4. Detect outliers
5. Test Assumptions
6. Extract Imp Variables
7. Factoring
8. Correlation Test
FEATURE ENGINEERING 1. Imputation
2. Handling missing values
3. Binning
4. Log Transformation - to handle skewness
5. One-hot encoding
6. Scaling
MODEL BUILDING
Regression
MODEL EVALUATION R Square/Adjusted R Square 0 (Not good) TO 1 (Good)
Mean Square Error(MSE) and Root Mean Square Error( RMSE) -
Mean Absolute Error
Train and Test Sets
Move My Goods
CLASSIFICATION OF FLEET DENSITY ACROSS PAN INDIA

DATA SCIENCE PROCESS STEPS
PROBLEM STATEMENT
Classification of fleet Density across PAN India
DATA MINING
1. Traffic data of fleet management 2. Total operating Branches 3. Per day transactions of demand/trip load
DATA PREPARATION 1. Data Cleaning
2. Data Scaling if required
3. Data Transformation
EXPLORATORY DATA ANALYSIS 1. Identification of NULL/NA/Missing values
2. Check for Statistical tests
3. PCA
4. Detect outliers
5. Test Assumptions
6. Extract Imp Variables
7. Factoring
8. Correlation Test
FEATURE ENGINEERING 1. Imputation
2. Handle Missing Values
3. Binning
4. Scaling
5. PCA
MODEL BUILDING
Classification/ Clustering
MODEL EVALUATION Confusion Matrix
Accuracy (30% good)
Precision (0 to 1)
Recall (0 to 1)
Move My Goods
ONLINE AGGREGATOR TO IDENTIFY CUSTOMER PULSE THROUGH FEEDBACK STUDY /
REVIEW

sr no DATA SCIENCE PROCESS
PROBLEM STATEMENT
Online Aggregator to identify customer pulse through feedback study / review
DATA MINING
1. Survey data 2. Customer Data 3. Sentiment Analysis 4. Feedback data
DATA PREPARATION 1. Data Cleaning
2. Data Scaling if required
3. Data Transformation
EXPLORATORY DATA ANALYSIS 1. Identification of NULL/NA/Missing values
2. Check for Statistical tests
3. PCA
4. Detect outliers
5. Test Assumptions
6. Extract Imp Variables
7. Factoring
8. Correlation Test
FEATURE ENGINEERING 1. Imputation
2. Handle Missing Values
3. Binning
4. Scaling
5. PCA
MODEL BUILDING
Classification/ Clustering
MODEL EVALUATION Confusion Matrix
Accuracy
Precision
Recall
Move My Goods
PREDICT ONLINE BOOKING PERCENTAGE WITH RESPECT DEMAND & SUPPLY

DATA SCIENCE PROCESS STEPS
PROBLEM STATEMENT
Predict online booking percentage with respect Demand & Supply
DATA MINING
1. History Data of Customer Booking 2. Demographics to Identify goods type
DATA PREPARATION 1. Data Cleaning
2. Data Scaling if required
3. Data Transformation
EXPLORATORY DATA ANALYSIS 1. Identification of NULL/NA/Missing values
2. Check for Statistical tests
3. PCA
4. Detect outliers
5. Test Assumptions
6. Extract Imp Variables
7. Factoring
8. Correlation Test
FEATURE ENGINEERING 1. Imputation
2. Handle Missing Values
3. Binning
4. Scaling
5. PCA
MODEL BUILDING
Regression
MODEL EVALUATION Accuracy
R, Adj.R,
RMSE,
ROC curve
Move My Goods
PRICE PREDICTION PER KMS AND PER TONNAGE

DATA SCIENCE PROCESS STEPS
PROBLEM STATEMENT
Price Prediction per Kms and Per Tonnage
DATA MINING
1. Pricing Model 2. Monthly Trend data 3. Vehicle Category
DATA PREPARATION 1. Data Cleaning
EXPLORATORY DATA ANALYSIS 1. Identification of NULL/NA/Missing values
2. Check for Statistical tests
3. Detect outliers
4. Test Assumptions
5. Extract Imp Variables
6. Factoring
7. Correlation Test
FEATURE ENGINEERING 1. Imputation
2. Handling missing values
3. Binning
4. Log Transformation - to handle skewness
MODEL BUILDING
Regression
MODEL EVALUATION Accuracy
R, Adj.R,
MSE,
ROC curve
Move My Goods
ROUTE OPTIMIZATION AND RECOMMENDATION

DATA SCIENCE PROCESS STEPS
PROBLEM STATEMENT
Route Optimization and Recommendation
DATA MINING 1. Route Maps and Demographics
DATA PREPARATION
1. Identification of patterns
EXPLORATORY DATA ANALYSIS
1. Identification of NULL/NA/Missing values
2. Check for Statistical tests
3. Detect outliers
4. Test Assumptions
5. Extract Imp Variables
6. Factoring
7. Correlation Test
FEATURE ENGINEERING 1. Imputation
MODEL BUILDING
Deep Learning
MODEL EVALUATION K-fold Cross validation
Train and Test Sets
Functions - gamma, alpha, relu activation (o to 1 – 1 treat)
Move My Goods
PREDICTION OF DEMAND FOR GOODS/STOCK INVENTORY

DATA SCIENCE PROCESS STEPS
PROBLEM STATEMENT
Prediction of Demand for Goods/Stock inventory
DATA MINING
1. Pricing Model 2. Monthly Trend data 3. Vehicle Category 4. Monthly/Yearly Inventory
DATA PREPARATION 1. Data Cleaning
2. Date Dimension
EXPLORATORY DATA ANALYSIS
1. Identification of NULL/NA/Missing values
2. Check for Statistical tests
3. Detect outliers
4. Test Assumptions
5. Extract Imp Variables
6. Factoring
7. Correlation Test
FEATURE ENGINEERING 1. Imputation
2. Handling missing values
3. Binning
4. Log Transformation - to handle skewness
MODEL BUILDING
Regression/ Recommendation system
MODEL EVALUATION
Accuracy R, Adj.R, RMSE, ROC curve
Move My Goods
ROUTE PREDICTION OF SALES AND TREND

DATA SCIENCE PROCESS STEPS
PROBLEM STATEMENT
Route Optimization and Recommendation
DATA MINING 1. Pricing Model 2. Monthly Trend data 3. Vehicle Category 4. Monthly/Yearly Inventory 5. Demographics 6. Type of
Enterprise/Customer
DATA PREPARATION 1. Data Cleaning
2. Data Transformation
3. Date Dimension
EXPLORATORY DATA ANALYSIS
1. Identification of NULL/NA/Missing values
2. Check for Statistical tests
3. Detect outliers
4. Test Assumptions
5. Extract Imp Variables
6. Factoring
7. Correlation Test
FEATURE ENGINEERING 1. Imputation
2. Handling missing values
3. Scaling (if required)
MODEL BUILDING
Regression Analysis
MODEL EVALUATION
Accuracy
R, Adj.R, RMSE, ROC curve
Move My Goods
EXTERNAL PARAMETERS AFFECTING LOGISTICS (WEATHER, VEHICLE CONDITION, TIME
TAKEN TO DELIVERY AND ETC.)

DATA SCIENCE PROCESS STEPS
PROBLEM STATEMENT
External Parameters affecting logistics (weather, vehicle condition, time taken to delivery and etc.)
DATA MINING 1. History Data of Vehicle movement and tracking 2. History of vehicle breakdown 3. ETA of delivery
4. Responses from Organization - ET of Respone 5. Weather condition
DATA PREPARATION 1. Data Cleaning
2. Data Transformation
3. Date Dimension
EXPLORATORY DATA ANALYSIS
1. Identification of NULL/NA/Missing values
2. Check for Statistical tests
3. Detect outliers
4. Test Assumptions
5. Extract Imp Variables
6. Factoring
7. Correlation Test
FEATURE ENGINEERING 1. Imputation
2. Handling missing values
3. PCA
MODEL BUILDING
Classification/ Clustering
MODEL EVALUATION Confusion Matrix
Accuracy
Precision
Recall
Move My Goods
OPTIMIZATION OF DELIVERY TIME

DATA SCIENCE PROCESS STEPS
PROBLEM STATEMENT 1. Route Maps and Demographics
DATA MINING
1. Identification of patterns
DATA PREPARATION 1. Data Cleaning
2. Data Transformation
3. Date Dimension
EXPLORATORY DATA ANALYSIS
1. Identification of NULL/NA/Missing values
2. Check for Statistical tests
3. Detect outliers
4. Test Assumptions
5. Extract Imp Variables
6. Factoring
7. Correlation Test
FEATURE ENGINEERING 1. Imputation
MODEL BUILDING
Deep Learning
MODEL EVALUATION K-fold Cross validation
Train and Test Sets
Functions - gamma, alpha, relu activation
Confusion Matrix
Move My Goods
WAREHOUSE OPTIMIZATION

DATA SCIENCE PROCESS STEPS
PROBLEM STATEMENT
Warehouse Optimization
DATA MINING 1. Warehouse demographics 2. Inventory Items data 3. Total no of Vehicle movements 4. Daily/Monthly Demand
5. Truck/Goods halting time
DATA PREPARATION 1. Data Cleaning
2. Identifying Patterns
EXPLORATORY DATA ANALYSIS
1. Identification of NULL/NA/Missing values
2. Check for Statistical tests
3. Detect outliers
4. Test Assumptions
5. Extract Imp Variables
6. Factoring
7. Correlation Test
FEATURE ENGINEERING 1. Imputation
2. Handling missing values
3. PCA
MODEL BUILDING
AI & Deep Learning
MODEL EVALUATION K-fold Cross validation
Train and Test Sets
Functions - gamma, alpha, relu activation
Confusion Matrix
Move My Goods
PERCENTAGE OF PREDICTION OF SCHEDULED, NORMAL, FREQUENT, ADOC AND
ENTERPRISE BOOKINGS

DATA SCIENCE PROCESS STEPS
PROBLEM STATEMENT
1. Customer data 2. Trends in bookings
DATA MINING 1. Warehouse demographics 2. Inventory Items data 3. Total no of Vehicle movements 4. Daily/Monthly Demand
5. Truck/Goods halting time
DATA PREPARATION 1. Data Cleaning
EXPLORATORY DATA ANALYSIS
1. Identification of NULL/NA/Missing values
2. Check for Statistical tests
3. Detect outliers
4. Test Assumptions
5. Extract Imp Variables
6. Factoring
7. Correlation Test
FEATURE ENGINEERING 1. Imputation
2. Handling missing values
3. PCA
MODEL BUILDING
Classification/ Clustering
MODEL EVALUATION Confusion Matrix
Accuracy
Precision
Recall
Move My Goods
VARIATION OF PRICE TREND ACROSS CITIES

DATA SCIENCE PROCESS STEPS
PROBLEM STATEMENT
Warehouse Optimization
DATA MINING 1. Pricing Model 2. Monthly Trend data 3. Vehicle Category 4. Monthly/Yearly Inventory 5. Demographics
6. Type of Enterprise/Customer
DATA PREPARATION 1. Data Cleaning
2. Data Transformation
3. Date Dimension
EXPLORATORY DATA ANALYSIS
1. Identification of NULL/NA/Missing values
2. Check for Statistical tests
3. Detect outliers
4. Test Assumptions
5. Extract Imp Variables
6. Factoring
7. Correlation Test
FEATURE ENGINEERING 1. Imputation
2. Handling missing values
MODEL BUILDING
Regression
MODEL EVALUATION
Accuracy
R, Adj.R, RMSE, ROC curve
Move My Goods
PACKAGING FOR EFFECTIVE DELIVERY

DATA SCIENCE PROCESS STEPS
PROBLEM STATEMENT
Packaging for Effective Delivery
DATA MINING
1. Shipping data 2. Type of goods 3. Type of Vehicles 4. Demographics 5. Pricing
DATA PREPARATION 1. Data Cleaning
2. Data Transformation
EXPLORATORY DATA ANALYSIS
1. Identification of NULL/NA/Missing values
2. Check for Statistical tests
3. Detect outliers
4. Test Assumptions
5. Extract Imp Variables
6. Factoring
7. Correlation Test
FEATURE ENGINEERING 1. Imputation
2. Handling missing values
3. Scaling (if required)
MODEL BUILDING
AI and Deep Learning
MODEL EVALUATION K-fold Cross validation
Train and Test Sets
Functions - gamma, alpha, relu activation
Move My Goods
OTHER USE CASE - DHL
 A clear example of this is leading logistics
provider, DHL, and it plans to augment
its logistics platform through the use of
Artificial Intelligence and Machine
Learning.
Move My Goods
PROBLEM DEFINITION ?
Move My Goods
PROBLEM DEFINTION
 The process of Identifying the problem we want to solve and the gain the business benefits
 Business Goals and Expectations
 Translate Business Goals to Data Analysis Goals
 Formulate Problem statement
 Success metric
 Sample example
 Total revenue prediction base truck category
 Customer Density prediction

Move My Goods
DATA MINING?
Move My Goods
WHAT IS DATA MINING?
 Data mining is also called knowledge discovery and data mining (KDD)
 Data mining is
 extraction of useful structured patterns from data sources, e.g., databases, texts, web, images.
 Patterns must be:
 valid, novel, potentially useful, understandable
 KDD is often applied interactively and iteratively.
 Data mining is used in Data Science
 As a term, “data science” often is applied more broadly than the traditional use of “data mining,” but data mining
techniques provide some of the clearest illustrations of the principles of data science.
Move My Goods
DATA MINING
 Process of Discovering Patterns in large sets of data and databases
 Data considered are structured data
 Use of algorithms to discover clear patterns in the data
 Build a reserve of actionable information
 Identify Trends and Patterns from the Past Data or Historical data
 Identify the pattern of transport demand from past data (In case we
maintained booking information of past)
Move My Goods
DATA SCRAPING FROM ONLINE SOURCES LIKE WEB
 Requests
 Requests is a Python library used for making various types of HTTP requests like GET, POST, etc. Because of its
simplicity and ease of use, it comes with the motto of HTTP for Humans.
 Beautiful Soup
 Beautiful Soup is perhaps the most widely used Python library for web scraping. It creates a parse tree for parsing
HTML and XML documents. Beautiful Soup automatically converts incoming documents to Unicode and outgoing
documents to UTF-8.
 Selenium
 we cannot easily scrape data from dynamically populated websites. It happens because sometimes the data
present on the page is loaded through JavaScript. In simple words, if the page is not static, then the Python
libraries mentioned earlier struggle to scrape the data from it.
 That’s where Selenium comes into play.
 Scrapy
 Scrapy is not just a library; it is an entire web scraping framework created by the co-founders of Scraping hub –
Pablo Hoffman and Shane Evans. It is a full-fledged web scraping solution that does all the heavy lifting for you.
Move My Goods
MMG DATA : CUSTOMER DENSITY PREDICTION
Key fields
 Company Name
 Address
 City
 State
 Zip Code
 Phone Number
 Email
 Website
 Year Est.
 Registration No.
 Type of Company
Move My Goods
DATA PREPARATIONS
Move My Goods
DATA PREPARATION
In any data analysis:
• 60% of the time in organizing and cleaning data.
• 19% of the time is spent in collecting datasets.
• 9% of the time is spent in mining the data to draw patterns.
• 3% of the time is spent in training the datasets.
• 4% of the time is spent in refining the algorithms.
• 5% of the time is spent in other tasks.
Move My Goods
DATA PREPARATION
 Data preparation is the process of gathering, combining, structuring and organizing data so it can be used in
business intelligence (BI), analytics and data visualization applications.
 The components of data preparation include data pre-processing, profiling, cleansing, validation and
transformation; it often also involves pulling together data from different internal systems and external
sources.
 For the purpose of MMG, few of the data were scraped from online sources like web. The main transactional
data was a live data which included customer, franchise, sales, vehicle information.
Move My Goods
DATA PREPARATION - DATA SCRAPING
Web scraping is a quicker process when compared to other conventional methods of collecting data from
sources like the Internet.
We extract information in any desired structured format like CSV, XML or Excel files. We can also upload it to
databases like SQL, MS Access.
Tools Used:
 Parse Hub
 Import.io
 Dexi.io
 Scraping Hub
 80legs
 Scraper
Move My Goods
EXPLORATORY DATA ANALYSIS
Exploratory data analysis (EDA) is an approach to analysing data sets to summarize their main
characteristics, often with visual methods.
A statistical model can be used or not, but primarily EDA is for seeing what the data can tell us
beyond the formal modelling or hypothesis testing task.
EDA is different from initial data analysis (IDA) which focuses more narrowly on checking
assumptions required for model fitting and hypothesis testing, and handling missing values and
making transformations of variables as needed. EDA encompasses IDA.
Move My Goods
EXPLORATORY DATA ANALYSIS
 Example:
 The insights of MMG transactional data illustrated
 Identified Categorical Variables, Distribution of data.
 Relationship between the data variables.
 Identification of predictor variables
 Identify the Missing Values
 Dimension Reduction
 Check Multi Collinearity and Correlation
EXPLORATORY DATA ANALYSIS
 summary of statistics pertaining to the
DataFrame columns. This function gives the
mean, std and IQR values. And, function excludes
the character columns and given summary about
numeric columns.
EXPLORATORY DATA ANALYSIS
 Finding the outlayers
 Method for graphically depicting groups of
numerical data through their quartiles
EXPLORATORY DATA ANALYSIS
 Finding the corelation between target and
feature
EXPLORATORY DATA ANALYSIS
 To find the magnitude of the data
Move My Goods
FEATURE ENGINEERING
 Why we need the engineering? Basically, all machine learning algorithms use some input data to create
outputs. This input data comprise features, which are usually in the form of structured columns.
 Algorithms require features with some specific characteristic to work properly.
Feature engineering efforts mainly have two goals:
 Preparing the proper input dataset, compatible with the machine learning algorithm requirements.
 Improving the performance of machine learning models.
Move My Goods
FEATURE ENGINEERING - TECHNIQUES
 Imputation
 Handling Outliers
 One-Hot Encoding
 Feature Split
Move My Goods
FEATURE ENGINEERING : TECHNIQUES
 Imputation – also increases BIAS in the data. For all
observations that are non-missing, calculate the
mean, median or mode of the observed values for
that variable, and fill in the missing values with
it. We use this approach only if <3%.
 Fig.1 shows the data of users logged in for MMG
application.
 Fig.2 shows the Missing Values in the variables
FEATURE ENGINEERING - HANDLING OUTLAYERS
 To identify the outlayers
 Most of the data falling 0 to 20k region
FEATURE ENGINEERING : ONE-HOT ENCODING
 To convert the categorical data to
numerical data
FEATURE ENGINEERING : FEATURE SPLIT
 Spliting the data to test and train
Move My Goods
MODEL BUILDING
 Data modelling (data modelling) is the process of creating a data model for the data to be stored in a Database. It is a
conceptual representation of Data objects, the associations between different data objects and the rules
Tools
 Anaconda
 Power BI
 Nltk (Naïve Bayes Classifier – for sentiment analysis)
 Scikit-learn
Languages
 Python
 R
Move My Goods
REGRESSION
 Regression analysis is a set of statistical processes for estimating the relationships between a dependent
variable and one or more independent variables.
Move My Goods
REGRESSION
A random regression forest is an ensemble of randomized regression trees. Denote the predicted value at point by the
-th tree, where are independent random variables, distributed as a generic random variable , independent of the sample
.
Move My Goods
CLASSIFICATION
Classification is a supervised learning concept which basically categorizes a set of data into classes. The
most common classification problems are – speech recognition, face detection, handwriting recognition,
document classification, etc.
Move My Goods
CLASSIFICATION
A decision tree is a flowchart-like structure in which each internal node represents a “test” on an attribute
(e.g. whether a coin flip comes up heads or tails), each branch represents the outcome of the test, and
each leaf node represents a class label (decision taken after computing all attributes).
Move My Goods
CLASSIFICATION
Used for classification and regression. In both cases, the input consists of the k closest training
examples in the feature space.
Move My Goods
MODEL EVALUATION – CLASSIFICATION
 In the field of machine learning and specifically the problem of statistical classification, a confusion
matrix, also known as an error matrix, is a specific table layout that allows visualization of the
performance of an algorithm
Move My Goods
MODEL EVALUATION – CLASSIFICATION
 In pattern recognition, information retrieval and classification, precision is the fraction of relevant
instances among the retrieved instances, while recall is the fraction of the total amount of relevant
instances that were actually retrieved.
Move My Goods
MODEL EVALUATION – REGRESSION
 MSE is the average of the squared error that is used as the loss function for least squares regression: It is
the sum, over all the data points, of the square of the difference between the predicted and actual target
variables, divided by the number of data points.
 Mean absolute error is a measure of errors between paired observations expressing the same
phenomenon.
Move My Goods
VISUALIZATION
Data visualization is the graphical representation of information and data. By using visual elements like
charts, graphs, and maps, data visualization tools provide an accessible way to see and understand trends,
outliers, and patterns in data.
 Bar chart
 Pie chart
 Donate chart
 Line cart
Move My Goods
DASHBOARD
Move My Goods
DASHBOARD
Move My Goods
MMG DATA : EXAMPLE
 Video 1: Total revenue prediction base truck category
 Video 2: Customer Density prediction
Move My Goods
ML & BI
 Machine learning is the study of computer algorithms that improve automatically through experience. It
is seen as a subset of artificial intelligence
 Deep learning is part of a broader family of machine learning methods based on artificial neural
networks with representation learning. Learning can be supervised, semi-supervised or unsupervised.
 Business intelligence (BI) comprises the strategies and technologies used by enterprises for the data
analysis of business information. BI technologies provide historical, current, and predictive views of
business operations.
ARTIFICIAL INTELLIGENCE
 AI refers to the simulation of human intelligence in machines that are programmed to think like humans
and mimic their actions.
 The term may also be applied to any machine that exhibits traits associated with a human mind such
as learning and problem-solving.
ARTIFICIAL INTELLIGENCE
 AI is a relatively new technology in transportation and
logistics sector. Despite this, there are plenty of
companies that have already started using AI-based
systems.
 Its efficient approach helps with asset performance,
predictive maintenance, and working on repetitive
tasks. AI in logistics has unlimited use cases.
FACT: Mckinsey Global Institute predicts that the
Transport and Logistics industry will benefit from AI with a
potential incremental value of 89 percent as compared to
the other existing analytical technologies.
ARTIFICIAL INTELLIGENCE - CHALLENGES
 Cost of Integration: The cost of integrating AI in existing systems within organizations is very high. To
work effectively, independent AI-based systems must be integrated together so that the entire
ecosystem can work as expected.
 Operational Costs: An AI system is built of independent components where each of them needs to be
replaced regularly. This is done to maintain operational integrity. The challenge here is that the
components don’t come cheap. Besides this, AI systems also need to be updated constantly and have
their batteries replaced, thus increasing the operational cost.
 Development of AI: Artificial Intelligence is a relatively new and rapidly growing technology. There is a lot
more we can do with AI, especially if we can combine it with other technologies. For this, we need to
have ongoing research and development. This means that the users would have to update to better tech
to keep up to the latest technology. This might not be possible for smaller businesses.
ARTIFICIAL INTELLIGENCE – USE CASES
 Automated warehouse facilities
 Robots
 Predictive maintenance
Examples:
 Ocado, an online grocery store in Great Britain has managed to successfully develop an automated
warehouse using computer vision
 Rolls-Royce partnered with Intel to create autonomous Ships.
 DHL Parcel and Amazon are collaborating to improve customer experience in supply chain and logistics
Move My Goods
DATA SCIENCE ROLES
 Data engineer
 Information architects
 Build data pipelines and storage solutions
 Maintain data access
 Data analyst
 Perform simpler analyses that describe data
 Create reports and dashboards to summarize
data
 Clean data for analysis
 Data scientist
 Versed in statistical methods
 Run experiments and analyses for insights
 Traditional machine learning
 Machine Learning Scientist
 Predictions and extrapolations
 Classification
 Deep learning
 Image processing
 Natural language processing
Move My Goods
RESEARCH & TRENDS
HOT TOPICS IN RESEARCH
 Analyzing supply chain complexity drivers
 Delivery service through drones.
 Port Density Distribution
 Supply chain effectiveness
 Price Prediction all kinds of Transportation
 Vehicle Distribution and Route optimization
 Distribution of Industries and forecasted Business
 Cost Reduction in Transportation
 Effective Automation process in Logistics
REFERENCES
 Dublin, April 01, 2020 (GLOBE NEWSWIRE) -- The "Indian Logistics Industry Outlook, 2020" report
has been added to ResearchAndMarkets.com's offering.
 https://www.youtube.com/watch?v=4-QU7WiVxh8
 https://www.youtube.com/watch?v=lZPO5RclZEo
 https://www.projectmanager.com/blog/logistics-management-101
 https://www.youtube.com/watch?v=Hf_ML38dSDM&t=29s
Move My Goods
THANK YOU
Let’s start digging
into science of data?

Mmg logistics edu-final

  • 1.
    TRENDS IN DATASCIENCE- APPLICATION OF DATA SCIENCE IN LOGISTICS JNN COLLEGE OF ENGINEERING, SHIMOGA Move My Goods Digital Logistics Platform
  • 2.
    Move My Goods AGENDA Introduction  Fundamentals of Logistics  Motivation  How data science is applied in Transport and Logistics.  Transformation in logistics  Job Opportunities.  Research  Conclusion
  • 3.
    Move My Goods INTRODUCTION Digital technologies revolutions in all sectors.  freight management , port operations and Warehouse automation.  India's GDP is expected to reach 3.02 trillion in 2020, representing about 4% of the global GDP.  Strong growth supported by government reforms, transportation sector development plans, growing retail sales, and the eCommerce sector are likely to be the key drivers of the logistics industry in India.  Online freight platforms and aggregators are on the rise in the Indian logistics market.  Manufacturing in India holds the potential to contribute up to 25%-30% of the GDP by 2025 which will drive the growth of the warehousing segment in India.  The startup team have strongly embedded Gaining greater contextual intelligence using machine learning combined with related technologies across supply chain operations translates into lower inventory and operations costs and quicker response times to customers.
  • 4.
    Move My Goods INTRODUCTION Thelogistics market in India is forecasted to grow at a CAGR of 10.5% between 2019 and 2025.  Infrastructure improvisation and investment.  eCommerce revolution in India  Grant of infrastructure status to logistics, the introduction of the E-Way Bill, and GST implementation are set to streamline the logistics sector in India  Increasing investments and trade points toward a healthy outlook for the Indian freight sector.  Port capacity is expected to grow at a CAGR of 5% to 6% by 2022, thereby, adding a capacity of 275 to 325 MT.  Indian Railways aims to increase its freight traffic from 1.1 billion tons in 2017 to 3.3 billion tons in 2030.  Freight traffic on airports in India has the potential to reach 17 million tones by FY40.  Logistics start-ups in India gained a substantial foothold after the onset of eCommerce, and there are several new companies that are gaining traction in the industry.  Online platforms have increased competition and lowered freight costs with real-time data availability and a transparent value chain. It is imperative for logistics service providers to innovate and adapt to the transforming logistics landscape. Source: Dublin, April 01, 2020 (GLOBE NEWSWIRE) -- The "Indian Logistics Industry Outlook, 2020" report has been added to ResearchAndMarkets.com's offering.
  • 5.
  • 6.
    Move My Goods LOGISTICS The term logistics comes from the late 19th century from French word “Logistique”  Supply Chain management – Transforming a raw material into products and getting in to customers  The term logistics comes from the late 19th century from French word “Logistique”  Logistics is movement of materials in whole supply chain.  “Logistics is about getting the right product, to the right customer, in the right quantity, in the right condition, at the right place, at the right time, and at the right cost (the seven Rs of Logistics)”  Transportation Just part of movement of goods in logistics
  • 7.
  • 8.
  • 9.
  • 10.
    Move My Goods LOGISTICCOMPONENTS • Inbound transportation • Outbound transportation • Fleet management • Warehousing • Materials handling • Order fulfillment • Inventory management • Demand planning • Marine Insurance
  • 11.
    Move My Goods WHYDATA SCIENCE IN LOGISTICS ?
  • 12.
    Move My Goods CHALLENGESIN LOGISTICS INDUSTRY  High Order Intensity Ratio  Transportation Roadblocks  Rail Tariffs  Port And Shipping Problems  Lack Of Skilled And Specialist Personnel  Slow Transition Into Newer Technologies  Warehousing And Taxation Discrepancies  Competition With Global Giants  Customer’s Mindset  Ever Increasing Fuel Costs  Government Policies And Bottlenecks  Shortage Of Drivers And Delivery Staff
  • 13.
    Move My Goods DATA-SCIENCEIN LOGISTICS  Enable enhanced insights, decision making and process automation  Reducing freight costs through delivery path optimization  Dynamic price matching of supply to demand  Warehouse optimization  Forecasting demand  Helps Supply Chain Industry drive costs and increase the velocity of turnover  Improves visibility, quality and growth potential  Boosts Operational efficiencies  Raises profit margin  Vehicle Traffic management and availability
  • 14.
    Move My Goods DATASCIENCE PROCESS ?
  • 15.
    Move My Goods DATASCIENCE  Making data work for you.  Use data to better describe the present or better predict the future.  Data science / AI / Machine Learning /Deep Learning  Data analytics has come a long way and we are now living in the age of Analytics 4.0 involving the use of machine learning algorithms along with data analytics
  • 16.
    Move My Goods PROCESS The flow illustrates the steps involved in the process of building a data model
  • 17.
    Move My Goods IDENTIFYAVAILABILITY OF APPROPRIATE CATEGORY OF VEHICLE ON DEMAND  DATA SCIENCE PROCESS STEPS PROBLEM STATEMENT Identify Availability of Appropriate Category of Vehicle on Demand DATA MINING 1. Get data of vehicles 2. Fleet data 3. Demographics 4. Goods Demand or Present transactional data DATA PREPARATION 1. Data Cleaning 2. Data Scaling if required 3. Data Transformation EXPLORATORY DATA ANALYSIS 1. Identification of NULL/NA/Missing values 2. Check for Statistical tests 3. PCA 4. Detect outliers 5. Test Assumptions 6. Extract Imp Variables 7. Factoring 8. Correlation Test FEATURE ENGINEERING 1. Imputation 2. Handling missing values 3. Binning 4. Log Transformation - to handle skewness 5. One-hot encoding 6. Scaling MODEL BUILDING Classification/clustering MODEL EVALUATION Confusion Matrix Accuracy Precision Recall
  • 18.
    Move My Goods ROUTEMAPPING WITH MINIMUM COST REDUCE FUEL COST  DATA SCIENCE PROCESS STEPS PROBLEM STATEMENT Route mapping with minimum cost reduce fuel cost DATA MINING 1. Transaction Data of fleet movement 2. Trip cost and fuel expense data DATA PREPARATION 1. Data Cleaning 2. Data Scaling if required 3. Data Transformation EXPLORATORY DATA ANALYSIS 1. Identification of NULL/NA/Missing values 2. Check for Statistical tests 3. PCA 4. Detect outliers 5. Test Assumptions 6. Extract Imp Variables 7. Factoring 8. Correlation Test FEATURE ENGINEERING 1. Imputation 2. Handling missing values 3. Binning 4. Log Transformation - to handle skewness 5. One-hot encoding 6. Scaling MODEL BUILDING Regression MODEL EVALUATION R Square/Adjusted R Square 0 (Not good) TO 1 (Good) Mean Square Error(MSE) and Root Mean Square Error( RMSE) - Mean Absolute Error Train and Test Sets
  • 19.
    Move My Goods CLASSIFICATIONOF FLEET DENSITY ACROSS PAN INDIA  DATA SCIENCE PROCESS STEPS PROBLEM STATEMENT Classification of fleet Density across PAN India DATA MINING 1. Traffic data of fleet management 2. Total operating Branches 3. Per day transactions of demand/trip load DATA PREPARATION 1. Data Cleaning 2. Data Scaling if required 3. Data Transformation EXPLORATORY DATA ANALYSIS 1. Identification of NULL/NA/Missing values 2. Check for Statistical tests 3. PCA 4. Detect outliers 5. Test Assumptions 6. Extract Imp Variables 7. Factoring 8. Correlation Test FEATURE ENGINEERING 1. Imputation 2. Handle Missing Values 3. Binning 4. Scaling 5. PCA MODEL BUILDING Classification/ Clustering MODEL EVALUATION Confusion Matrix Accuracy (30% good) Precision (0 to 1) Recall (0 to 1)
  • 20.
    Move My Goods ONLINEAGGREGATOR TO IDENTIFY CUSTOMER PULSE THROUGH FEEDBACK STUDY / REVIEW  sr no DATA SCIENCE PROCESS PROBLEM STATEMENT Online Aggregator to identify customer pulse through feedback study / review DATA MINING 1. Survey data 2. Customer Data 3. Sentiment Analysis 4. Feedback data DATA PREPARATION 1. Data Cleaning 2. Data Scaling if required 3. Data Transformation EXPLORATORY DATA ANALYSIS 1. Identification of NULL/NA/Missing values 2. Check for Statistical tests 3. PCA 4. Detect outliers 5. Test Assumptions 6. Extract Imp Variables 7. Factoring 8. Correlation Test FEATURE ENGINEERING 1. Imputation 2. Handle Missing Values 3. Binning 4. Scaling 5. PCA MODEL BUILDING Classification/ Clustering MODEL EVALUATION Confusion Matrix Accuracy Precision Recall
  • 21.
    Move My Goods PREDICTONLINE BOOKING PERCENTAGE WITH RESPECT DEMAND & SUPPLY  DATA SCIENCE PROCESS STEPS PROBLEM STATEMENT Predict online booking percentage with respect Demand & Supply DATA MINING 1. History Data of Customer Booking 2. Demographics to Identify goods type DATA PREPARATION 1. Data Cleaning 2. Data Scaling if required 3. Data Transformation EXPLORATORY DATA ANALYSIS 1. Identification of NULL/NA/Missing values 2. Check for Statistical tests 3. PCA 4. Detect outliers 5. Test Assumptions 6. Extract Imp Variables 7. Factoring 8. Correlation Test FEATURE ENGINEERING 1. Imputation 2. Handle Missing Values 3. Binning 4. Scaling 5. PCA MODEL BUILDING Regression MODEL EVALUATION Accuracy R, Adj.R, RMSE, ROC curve
  • 22.
    Move My Goods PRICEPREDICTION PER KMS AND PER TONNAGE  DATA SCIENCE PROCESS STEPS PROBLEM STATEMENT Price Prediction per Kms and Per Tonnage DATA MINING 1. Pricing Model 2. Monthly Trend data 3. Vehicle Category DATA PREPARATION 1. Data Cleaning EXPLORATORY DATA ANALYSIS 1. Identification of NULL/NA/Missing values 2. Check for Statistical tests 3. Detect outliers 4. Test Assumptions 5. Extract Imp Variables 6. Factoring 7. Correlation Test FEATURE ENGINEERING 1. Imputation 2. Handling missing values 3. Binning 4. Log Transformation - to handle skewness MODEL BUILDING Regression MODEL EVALUATION Accuracy R, Adj.R, MSE, ROC curve
  • 23.
    Move My Goods ROUTEOPTIMIZATION AND RECOMMENDATION  DATA SCIENCE PROCESS STEPS PROBLEM STATEMENT Route Optimization and Recommendation DATA MINING 1. Route Maps and Demographics DATA PREPARATION 1. Identification of patterns EXPLORATORY DATA ANALYSIS 1. Identification of NULL/NA/Missing values 2. Check for Statistical tests 3. Detect outliers 4. Test Assumptions 5. Extract Imp Variables 6. Factoring 7. Correlation Test FEATURE ENGINEERING 1. Imputation MODEL BUILDING Deep Learning MODEL EVALUATION K-fold Cross validation Train and Test Sets Functions - gamma, alpha, relu activation (o to 1 – 1 treat)
  • 24.
    Move My Goods PREDICTIONOF DEMAND FOR GOODS/STOCK INVENTORY  DATA SCIENCE PROCESS STEPS PROBLEM STATEMENT Prediction of Demand for Goods/Stock inventory DATA MINING 1. Pricing Model 2. Monthly Trend data 3. Vehicle Category 4. Monthly/Yearly Inventory DATA PREPARATION 1. Data Cleaning 2. Date Dimension EXPLORATORY DATA ANALYSIS 1. Identification of NULL/NA/Missing values 2. Check for Statistical tests 3. Detect outliers 4. Test Assumptions 5. Extract Imp Variables 6. Factoring 7. Correlation Test FEATURE ENGINEERING 1. Imputation 2. Handling missing values 3. Binning 4. Log Transformation - to handle skewness MODEL BUILDING Regression/ Recommendation system MODEL EVALUATION Accuracy R, Adj.R, RMSE, ROC curve
  • 25.
    Move My Goods ROUTEPREDICTION OF SALES AND TREND  DATA SCIENCE PROCESS STEPS PROBLEM STATEMENT Route Optimization and Recommendation DATA MINING 1. Pricing Model 2. Monthly Trend data 3. Vehicle Category 4. Monthly/Yearly Inventory 5. Demographics 6. Type of Enterprise/Customer DATA PREPARATION 1. Data Cleaning 2. Data Transformation 3. Date Dimension EXPLORATORY DATA ANALYSIS 1. Identification of NULL/NA/Missing values 2. Check for Statistical tests 3. Detect outliers 4. Test Assumptions 5. Extract Imp Variables 6. Factoring 7. Correlation Test FEATURE ENGINEERING 1. Imputation 2. Handling missing values 3. Scaling (if required) MODEL BUILDING Regression Analysis MODEL EVALUATION Accuracy R, Adj.R, RMSE, ROC curve
  • 26.
    Move My Goods EXTERNALPARAMETERS AFFECTING LOGISTICS (WEATHER, VEHICLE CONDITION, TIME TAKEN TO DELIVERY AND ETC.)  DATA SCIENCE PROCESS STEPS PROBLEM STATEMENT External Parameters affecting logistics (weather, vehicle condition, time taken to delivery and etc.) DATA MINING 1. History Data of Vehicle movement and tracking 2. History of vehicle breakdown 3. ETA of delivery 4. Responses from Organization - ET of Respone 5. Weather condition DATA PREPARATION 1. Data Cleaning 2. Data Transformation 3. Date Dimension EXPLORATORY DATA ANALYSIS 1. Identification of NULL/NA/Missing values 2. Check for Statistical tests 3. Detect outliers 4. Test Assumptions 5. Extract Imp Variables 6. Factoring 7. Correlation Test FEATURE ENGINEERING 1. Imputation 2. Handling missing values 3. PCA MODEL BUILDING Classification/ Clustering MODEL EVALUATION Confusion Matrix Accuracy Precision Recall
  • 27.
    Move My Goods OPTIMIZATIONOF DELIVERY TIME  DATA SCIENCE PROCESS STEPS PROBLEM STATEMENT 1. Route Maps and Demographics DATA MINING 1. Identification of patterns DATA PREPARATION 1. Data Cleaning 2. Data Transformation 3. Date Dimension EXPLORATORY DATA ANALYSIS 1. Identification of NULL/NA/Missing values 2. Check for Statistical tests 3. Detect outliers 4. Test Assumptions 5. Extract Imp Variables 6. Factoring 7. Correlation Test FEATURE ENGINEERING 1. Imputation MODEL BUILDING Deep Learning MODEL EVALUATION K-fold Cross validation Train and Test Sets Functions - gamma, alpha, relu activation Confusion Matrix
  • 28.
    Move My Goods WAREHOUSEOPTIMIZATION  DATA SCIENCE PROCESS STEPS PROBLEM STATEMENT Warehouse Optimization DATA MINING 1. Warehouse demographics 2. Inventory Items data 3. Total no of Vehicle movements 4. Daily/Monthly Demand 5. Truck/Goods halting time DATA PREPARATION 1. Data Cleaning 2. Identifying Patterns EXPLORATORY DATA ANALYSIS 1. Identification of NULL/NA/Missing values 2. Check for Statistical tests 3. Detect outliers 4. Test Assumptions 5. Extract Imp Variables 6. Factoring 7. Correlation Test FEATURE ENGINEERING 1. Imputation 2. Handling missing values 3. PCA MODEL BUILDING AI & Deep Learning MODEL EVALUATION K-fold Cross validation Train and Test Sets Functions - gamma, alpha, relu activation Confusion Matrix
  • 29.
    Move My Goods PERCENTAGEOF PREDICTION OF SCHEDULED, NORMAL, FREQUENT, ADOC AND ENTERPRISE BOOKINGS  DATA SCIENCE PROCESS STEPS PROBLEM STATEMENT 1. Customer data 2. Trends in bookings DATA MINING 1. Warehouse demographics 2. Inventory Items data 3. Total no of Vehicle movements 4. Daily/Monthly Demand 5. Truck/Goods halting time DATA PREPARATION 1. Data Cleaning EXPLORATORY DATA ANALYSIS 1. Identification of NULL/NA/Missing values 2. Check for Statistical tests 3. Detect outliers 4. Test Assumptions 5. Extract Imp Variables 6. Factoring 7. Correlation Test FEATURE ENGINEERING 1. Imputation 2. Handling missing values 3. PCA MODEL BUILDING Classification/ Clustering MODEL EVALUATION Confusion Matrix Accuracy Precision Recall
  • 30.
    Move My Goods VARIATIONOF PRICE TREND ACROSS CITIES  DATA SCIENCE PROCESS STEPS PROBLEM STATEMENT Warehouse Optimization DATA MINING 1. Pricing Model 2. Monthly Trend data 3. Vehicle Category 4. Monthly/Yearly Inventory 5. Demographics 6. Type of Enterprise/Customer DATA PREPARATION 1. Data Cleaning 2. Data Transformation 3. Date Dimension EXPLORATORY DATA ANALYSIS 1. Identification of NULL/NA/Missing values 2. Check for Statistical tests 3. Detect outliers 4. Test Assumptions 5. Extract Imp Variables 6. Factoring 7. Correlation Test FEATURE ENGINEERING 1. Imputation 2. Handling missing values MODEL BUILDING Regression MODEL EVALUATION Accuracy R, Adj.R, RMSE, ROC curve
  • 31.
    Move My Goods PACKAGINGFOR EFFECTIVE DELIVERY  DATA SCIENCE PROCESS STEPS PROBLEM STATEMENT Packaging for Effective Delivery DATA MINING 1. Shipping data 2. Type of goods 3. Type of Vehicles 4. Demographics 5. Pricing DATA PREPARATION 1. Data Cleaning 2. Data Transformation EXPLORATORY DATA ANALYSIS 1. Identification of NULL/NA/Missing values 2. Check for Statistical tests 3. Detect outliers 4. Test Assumptions 5. Extract Imp Variables 6. Factoring 7. Correlation Test FEATURE ENGINEERING 1. Imputation 2. Handling missing values 3. Scaling (if required) MODEL BUILDING AI and Deep Learning MODEL EVALUATION K-fold Cross validation Train and Test Sets Functions - gamma, alpha, relu activation
  • 32.
    Move My Goods OTHERUSE CASE - DHL  A clear example of this is leading logistics provider, DHL, and it plans to augment its logistics platform through the use of Artificial Intelligence and Machine Learning.
  • 33.
  • 34.
    Move My Goods PROBLEMDEFINTION  The process of Identifying the problem we want to solve and the gain the business benefits  Business Goals and Expectations  Translate Business Goals to Data Analysis Goals  Formulate Problem statement  Success metric  Sample example  Total revenue prediction base truck category  Customer Density prediction 
  • 35.
  • 36.
    Move My Goods WHATIS DATA MINING?  Data mining is also called knowledge discovery and data mining (KDD)  Data mining is  extraction of useful structured patterns from data sources, e.g., databases, texts, web, images.  Patterns must be:  valid, novel, potentially useful, understandable  KDD is often applied interactively and iteratively.  Data mining is used in Data Science  As a term, “data science” often is applied more broadly than the traditional use of “data mining,” but data mining techniques provide some of the clearest illustrations of the principles of data science.
  • 37.
    Move My Goods DATAMINING  Process of Discovering Patterns in large sets of data and databases  Data considered are structured data  Use of algorithms to discover clear patterns in the data  Build a reserve of actionable information  Identify Trends and Patterns from the Past Data or Historical data  Identify the pattern of transport demand from past data (In case we maintained booking information of past)
  • 38.
    Move My Goods DATASCRAPING FROM ONLINE SOURCES LIKE WEB  Requests  Requests is a Python library used for making various types of HTTP requests like GET, POST, etc. Because of its simplicity and ease of use, it comes with the motto of HTTP for Humans.  Beautiful Soup  Beautiful Soup is perhaps the most widely used Python library for web scraping. It creates a parse tree for parsing HTML and XML documents. Beautiful Soup automatically converts incoming documents to Unicode and outgoing documents to UTF-8.  Selenium  we cannot easily scrape data from dynamically populated websites. It happens because sometimes the data present on the page is loaded through JavaScript. In simple words, if the page is not static, then the Python libraries mentioned earlier struggle to scrape the data from it.  That’s where Selenium comes into play.  Scrapy  Scrapy is not just a library; it is an entire web scraping framework created by the co-founders of Scraping hub – Pablo Hoffman and Shane Evans. It is a full-fledged web scraping solution that does all the heavy lifting for you.
  • 39.
    Move My Goods MMGDATA : CUSTOMER DENSITY PREDICTION Key fields  Company Name  Address  City  State  Zip Code  Phone Number  Email  Website  Year Est.  Registration No.  Type of Company
  • 40.
    Move My Goods DATAPREPARATIONS
  • 41.
    Move My Goods DATAPREPARATION In any data analysis: • 60% of the time in organizing and cleaning data. • 19% of the time is spent in collecting datasets. • 9% of the time is spent in mining the data to draw patterns. • 3% of the time is spent in training the datasets. • 4% of the time is spent in refining the algorithms. • 5% of the time is spent in other tasks.
  • 42.
    Move My Goods DATAPREPARATION  Data preparation is the process of gathering, combining, structuring and organizing data so it can be used in business intelligence (BI), analytics and data visualization applications.  The components of data preparation include data pre-processing, profiling, cleansing, validation and transformation; it often also involves pulling together data from different internal systems and external sources.  For the purpose of MMG, few of the data were scraped from online sources like web. The main transactional data was a live data which included customer, franchise, sales, vehicle information.
  • 43.
    Move My Goods DATAPREPARATION - DATA SCRAPING Web scraping is a quicker process when compared to other conventional methods of collecting data from sources like the Internet. We extract information in any desired structured format like CSV, XML or Excel files. We can also upload it to databases like SQL, MS Access. Tools Used:  Parse Hub  Import.io  Dexi.io  Scraping Hub  80legs  Scraper
  • 44.
    Move My Goods EXPLORATORYDATA ANALYSIS Exploratory data analysis (EDA) is an approach to analysing data sets to summarize their main characteristics, often with visual methods. A statistical model can be used or not, but primarily EDA is for seeing what the data can tell us beyond the formal modelling or hypothesis testing task. EDA is different from initial data analysis (IDA) which focuses more narrowly on checking assumptions required for model fitting and hypothesis testing, and handling missing values and making transformations of variables as needed. EDA encompasses IDA.
  • 45.
    Move My Goods EXPLORATORYDATA ANALYSIS  Example:  The insights of MMG transactional data illustrated  Identified Categorical Variables, Distribution of data.  Relationship between the data variables.  Identification of predictor variables  Identify the Missing Values  Dimension Reduction  Check Multi Collinearity and Correlation
  • 46.
    EXPLORATORY DATA ANALYSIS summary of statistics pertaining to the DataFrame columns. This function gives the mean, std and IQR values. And, function excludes the character columns and given summary about numeric columns.
  • 47.
    EXPLORATORY DATA ANALYSIS Finding the outlayers  Method for graphically depicting groups of numerical data through their quartiles
  • 48.
    EXPLORATORY DATA ANALYSIS Finding the corelation between target and feature
  • 49.
    EXPLORATORY DATA ANALYSIS To find the magnitude of the data
  • 50.
    Move My Goods FEATUREENGINEERING  Why we need the engineering? Basically, all machine learning algorithms use some input data to create outputs. This input data comprise features, which are usually in the form of structured columns.  Algorithms require features with some specific characteristic to work properly. Feature engineering efforts mainly have two goals:  Preparing the proper input dataset, compatible with the machine learning algorithm requirements.  Improving the performance of machine learning models.
  • 51.
    Move My Goods FEATUREENGINEERING - TECHNIQUES  Imputation  Handling Outliers  One-Hot Encoding  Feature Split
  • 52.
    Move My Goods FEATUREENGINEERING : TECHNIQUES  Imputation – also increases BIAS in the data. For all observations that are non-missing, calculate the mean, median or mode of the observed values for that variable, and fill in the missing values with it. We use this approach only if <3%.  Fig.1 shows the data of users logged in for MMG application.  Fig.2 shows the Missing Values in the variables
  • 53.
    FEATURE ENGINEERING -HANDLING OUTLAYERS  To identify the outlayers  Most of the data falling 0 to 20k region
  • 54.
    FEATURE ENGINEERING :ONE-HOT ENCODING  To convert the categorical data to numerical data
  • 55.
    FEATURE ENGINEERING :FEATURE SPLIT  Spliting the data to test and train
  • 56.
    Move My Goods MODELBUILDING  Data modelling (data modelling) is the process of creating a data model for the data to be stored in a Database. It is a conceptual representation of Data objects, the associations between different data objects and the rules Tools  Anaconda  Power BI  Nltk (Naïve Bayes Classifier – for sentiment analysis)  Scikit-learn Languages  Python  R
  • 57.
    Move My Goods REGRESSION Regression analysis is a set of statistical processes for estimating the relationships between a dependent variable and one or more independent variables.
  • 58.
    Move My Goods REGRESSION Arandom regression forest is an ensemble of randomized regression trees. Denote the predicted value at point by the -th tree, where are independent random variables, distributed as a generic random variable , independent of the sample .
  • 59.
    Move My Goods CLASSIFICATION Classificationis a supervised learning concept which basically categorizes a set of data into classes. The most common classification problems are – speech recognition, face detection, handwriting recognition, document classification, etc.
  • 60.
    Move My Goods CLASSIFICATION Adecision tree is a flowchart-like structure in which each internal node represents a “test” on an attribute (e.g. whether a coin flip comes up heads or tails), each branch represents the outcome of the test, and each leaf node represents a class label (decision taken after computing all attributes).
  • 61.
    Move My Goods CLASSIFICATION Usedfor classification and regression. In both cases, the input consists of the k closest training examples in the feature space.
  • 62.
    Move My Goods MODELEVALUATION – CLASSIFICATION  In the field of machine learning and specifically the problem of statistical classification, a confusion matrix, also known as an error matrix, is a specific table layout that allows visualization of the performance of an algorithm
  • 63.
    Move My Goods MODELEVALUATION – CLASSIFICATION  In pattern recognition, information retrieval and classification, precision is the fraction of relevant instances among the retrieved instances, while recall is the fraction of the total amount of relevant instances that were actually retrieved.
  • 64.
    Move My Goods MODELEVALUATION – REGRESSION  MSE is the average of the squared error that is used as the loss function for least squares regression: It is the sum, over all the data points, of the square of the difference between the predicted and actual target variables, divided by the number of data points.  Mean absolute error is a measure of errors between paired observations expressing the same phenomenon.
  • 65.
    Move My Goods VISUALIZATION Datavisualization is the graphical representation of information and data. By using visual elements like charts, graphs, and maps, data visualization tools provide an accessible way to see and understand trends, outliers, and patterns in data.  Bar chart  Pie chart  Donate chart  Line cart
  • 66.
  • 67.
  • 68.
    Move My Goods MMGDATA : EXAMPLE  Video 1: Total revenue prediction base truck category  Video 2: Customer Density prediction
  • 69.
    Move My Goods ML& BI  Machine learning is the study of computer algorithms that improve automatically through experience. It is seen as a subset of artificial intelligence  Deep learning is part of a broader family of machine learning methods based on artificial neural networks with representation learning. Learning can be supervised, semi-supervised or unsupervised.  Business intelligence (BI) comprises the strategies and technologies used by enterprises for the data analysis of business information. BI technologies provide historical, current, and predictive views of business operations.
  • 70.
  • 71.
    ARTIFICIAL INTELLIGENCE  AIrefers to the simulation of human intelligence in machines that are programmed to think like humans and mimic their actions.  The term may also be applied to any machine that exhibits traits associated with a human mind such as learning and problem-solving.
  • 72.
    ARTIFICIAL INTELLIGENCE  AIis a relatively new technology in transportation and logistics sector. Despite this, there are plenty of companies that have already started using AI-based systems.  Its efficient approach helps with asset performance, predictive maintenance, and working on repetitive tasks. AI in logistics has unlimited use cases. FACT: Mckinsey Global Institute predicts that the Transport and Logistics industry will benefit from AI with a potential incremental value of 89 percent as compared to the other existing analytical technologies.
  • 73.
    ARTIFICIAL INTELLIGENCE -CHALLENGES  Cost of Integration: The cost of integrating AI in existing systems within organizations is very high. To work effectively, independent AI-based systems must be integrated together so that the entire ecosystem can work as expected.  Operational Costs: An AI system is built of independent components where each of them needs to be replaced regularly. This is done to maintain operational integrity. The challenge here is that the components don’t come cheap. Besides this, AI systems also need to be updated constantly and have their batteries replaced, thus increasing the operational cost.  Development of AI: Artificial Intelligence is a relatively new and rapidly growing technology. There is a lot more we can do with AI, especially if we can combine it with other technologies. For this, we need to have ongoing research and development. This means that the users would have to update to better tech to keep up to the latest technology. This might not be possible for smaller businesses.
  • 74.
    ARTIFICIAL INTELLIGENCE –USE CASES  Automated warehouse facilities  Robots  Predictive maintenance Examples:  Ocado, an online grocery store in Great Britain has managed to successfully develop an automated warehouse using computer vision  Rolls-Royce partnered with Intel to create autonomous Ships.  DHL Parcel and Amazon are collaborating to improve customer experience in supply chain and logistics
  • 75.
    Move My Goods DATASCIENCE ROLES  Data engineer  Information architects  Build data pipelines and storage solutions  Maintain data access  Data analyst  Perform simpler analyses that describe data  Create reports and dashboards to summarize data  Clean data for analysis  Data scientist  Versed in statistical methods  Run experiments and analyses for insights  Traditional machine learning  Machine Learning Scientist  Predictions and extrapolations  Classification  Deep learning  Image processing  Natural language processing
  • 76.
  • 77.
    HOT TOPICS INRESEARCH  Analyzing supply chain complexity drivers  Delivery service through drones.  Port Density Distribution  Supply chain effectiveness  Price Prediction all kinds of Transportation  Vehicle Distribution and Route optimization  Distribution of Industries and forecasted Business  Cost Reduction in Transportation  Effective Automation process in Logistics
  • 78.
    REFERENCES  Dublin, April01, 2020 (GLOBE NEWSWIRE) -- The "Indian Logistics Industry Outlook, 2020" report has been added to ResearchAndMarkets.com's offering.  https://www.youtube.com/watch?v=4-QU7WiVxh8  https://www.youtube.com/watch?v=lZPO5RclZEo  https://www.projectmanager.com/blog/logistics-management-101  https://www.youtube.com/watch?v=Hf_ML38dSDM&t=29s
  • 79.
    Move My Goods THANKYOU Let’s start digging into science of data?