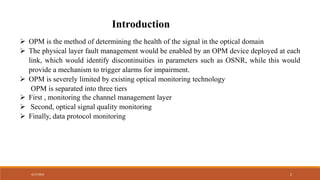
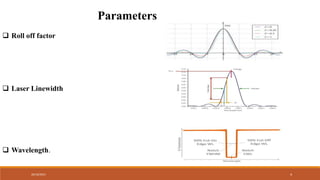
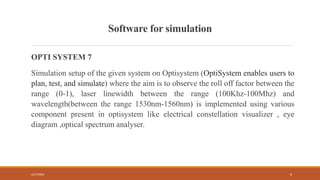
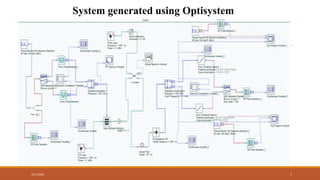
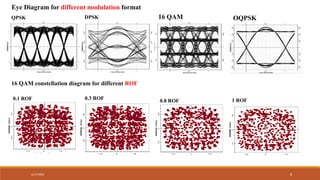
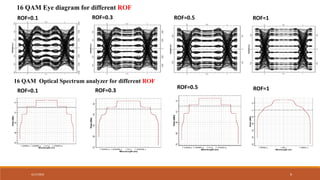
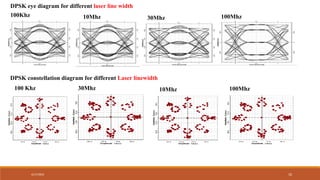
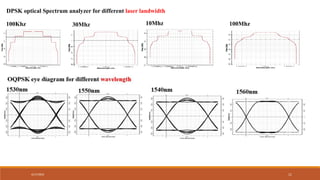
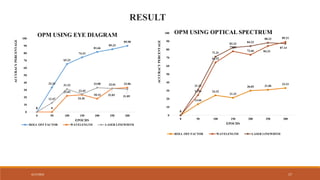
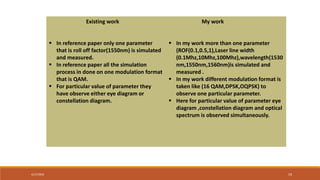
4/17/2024 1
4/17/2024 2
 OPM is the method of determining the health of the signal in the optical domain
 The physical layer fault management would be enabled by an OPM device deployed at each
link, which would identify discontinuities in parameters such as OSNR, while this would
provide a mechanism to trigger alarms for impairment.
 OPM is severely limited by existing optical monitoring technology
OPM is separated into three tiers
 First , monitoring the channel management layer
 Second, optical signal quality monitoring
 Finally, data protocol monitoring
Introduction
Motivation
Present network is reaching theoretical limits, optical performance monitoring is becoming
increasingly common to meet this requirement.
Various optical impairments are present in a log distance channel like Noise, Distortion,
Timing variations
Individual or multiple component failures
4/17/2024 3
Objective
 To measure various parameters like roll off factor, laser line width, wavelength for
effective utilization of design.
26/10/2021 4
 Roll off factor
 Laser Linewidth
 Wavelength.
Parameters
4/17/2024 5
Proposed work
Software for simulation
OPTI SYSTEM 7
Simulation setup of the given system on Optisystem (OptiSystem enables users to
plan, test, and simulate) where the aim is to observe the roll off factor between the
range (0-1), laser linewidth between the range (100Khz-100Mhz) and
wavelength(between the range 1530nm-1560nm) is implemented using various
component present in optisystem like electrical constellation visualizer , eye
diagram ,optical spectrum analyser.
4/17/2024 6
4/17/2024 7
System generated using Optisystem
4/17/2024 8
QPSK 16 QAM OQPSK
DPSK
Eye Diagram for different modulation format
16 QAM constellation diagram for different ROF
0.1 ROF 0.3 ROF 0.8 ROF 1 ROF
4/17/2024 9
16 QAM Eye diagram for different ROF
ROF=0.1 ROF=0.3 ROF=0.5 ROF=1
16 QAM Optical Spectrum analyzer for different ROF
ROF=0.1 ROF=0.3
ROF=0.5 ROF=1
4/17/2024 10
DPSK eye diagram for different laser line width
100Khz 10Mhz 100Mhz
30Mhz
DPSK constellation diagram for different Laser linewidth
100 Khz 30Mhz 10Mhz 100Mhz
4/17/2024 11
100Khz 30Mhz 10Mhz 100Mhz
DPSK optical Spectrum analyzer for different laser landwidth
4/17/2024 12
OQPSK constellation diagram for different wavelength
1530nm 1550nm 1540nm 1560nm
4/17/2024 13
Machine learning is an application of artificial intelligence that provides systems the ability to
automatically learn and improve from experience without being explicitly programmed.
Machine learning algorithms offer powerful tools to solve various problems in many areas and they are
being used in Optical communications.
 Recently, ML algorithms have been utilized to process the optical communication data and achieved
distinguished performance.
Machine learning
Convolutional Neural Network
 Convolutional Neural Network is a deep Learning algorithm which can take in an input image, assign
importance to various aspects/objects in the image and be able to differentiate one from the other.
 A convolutional neural network consists of an input layer, hidden layer and an output layer.
 Convolution Operation is to extract the high-level features such as edges, from the input image.
Conventionally, the first ConvLayer is responsible for capturing the low-level features such as edges,
color, gradient orientation, etc. With added layers, the architecture adapts to the high-level features
4/17/2024 14
Input data
Output data
Fully
connected
Proposed Convolutional Neural Network model
4/17/2024 15
ALGORITHM
4/17/2024 16
CONFUSION MATRIX FOR INPUT IMAGE CLASSIFICATION
4/17/2024 17
0
33.33
65.23
74.33
81.66
85.33
89.98
0 0
22.02 23.45
18.14
32.01 33.06
0
12.47
31.22
24.36
33.08
32.03 31.05
0
10
20
30
40
50
60
70
80
90
100
0 50 100 150 200 250 300
ACCURACY
PERCENTAGE
EPOCHS
OPM USING EYE DIAGRAM
ROLL OFF FACTOR WAVELENGTH LASER LINEWIDTH
RESULT
0
13.66
24.32
21.32
30.05 31.06
33.21
0
24.56
64.32
77.85
73.66 84.33
89.21
0
31.22
71.31
82.33
84.23
88.23
87.14
0
10
20
30
40
50
60
70
80
90
100
0 50 100 150 200 250 300
ACCURACY
PERCENTAGE
EPOCHS
OPM USING OPTICAL SPECTRUM
ROLL OFF FACTOR WAVELENGTH LASER LINEWIDTH
4/17/2024 18
0
33.33
65.23
74.33
81.66
85.33
89.98
0
24.56
64.32
77.85
73.66
84.33
89.21
0
31.22
71.31
82.33 84.23
88.23 87.14
0
10
20
30
40
50
60
70
80
90
100
0 5 0 1 0 0 1 5 0 2 0 0 2 5 0 3 0 0
PROPOSE D ME T HOD
ACCURACY
PERCENTAGE
EPOCHS
ROLL OFF FACTOR WAVELENGTH LASER LINEWIDTH
RESULT
0
23.36
42.12
53.66
75.43
78.77
81.26
0
12.33
31.22
28.66
34.51
38.51
32.66
0
19.37
28.66
31.24
33.63
30.45
34.12
0
10
20
30
40
50
60
70
80
90
100
0 50 100 150 200 250 300
ACCURACY
PERCENTAGE
EPOCHS
OPM USING CONSTELLATION
DIAGRAM
ROLL OFF FACTOR WAVELENGTH LASER LINEWIDTH
4/17/2024 19
Existing work
 In reference paper only one parameter
that is roll off factor(1550nm) is simulated
and measured.
 In reference paper all the simulation
process in done on one modulation format
that is QAM.
 For particular value of parameter they
have observe either eye diagram or
constellation diagram.
My work
 In my work more than one parameter
(ROF(0.1,0.5,1),Laser line width
(0.1Mhz,10Mhz,100Mhz),wavelength(1530
nm,1550nm,1560nm)is simulated and
measured .
 In my work different modulation format is
taken like (16 QAM,DPSK,OQPSK) to
observe one particular parameter.
 Here for particular value of parameter eye
diagram ,constellation diagram and optical
spectrum is observed simultaneously.
Future Scope
More investigations are needed to determine multi parameter to determine the accuracy of
the proposed method in the presence of linear and nonlinear optical fiber impairments.
4/17/2024 20
References
[1] D. Zibar, L. Henrique, H. D. Carvalho, M. Piels, A. Doberstein, J. Diniz, B. Nebendahl, C. Franciscangelis,
J. Estaran, H. Haisch, N. G. Gonzalez, J. C. R. F. D. Oliveira, and I. T. Monroy, “Application of Machine
Learning Techniques for Amplitude and Phase Noise Characterization,” Journal of Lightwave Technology, vol.
33, no. 7, pp. 1333–1343, 2015.
[2] C. M. Bishop, Pattern recognition and machine learning, 2006
[3] B. Szafraniec, T. S. Marshall, and B. Nebendahl, “Performance monitoring and measurement techniques
for coherent optical systems,” Journal of Lightwave Technology, vol. 31, no. 4, pp. 648–663, 2013.
[4] L. Barletta, M. Magarini, and a. Spalvieri, “The information rate transferred through the discrete-time
Wiener’s phase noise channel,” Journal of Lightwave Technology, vol. 30, no. 10, pp. 1480–1486, 2012.
4/17/2024 21

ML based multiparameter OPM for optical networks

  • 1.
  • 2.
    4/17/2024 2  OPMis the method of determining the health of the signal in the optical domain  The physical layer fault management would be enabled by an OPM device deployed at each link, which would identify discontinuities in parameters such as OSNR, while this would provide a mechanism to trigger alarms for impairment.  OPM is severely limited by existing optical monitoring technology OPM is separated into three tiers  First , monitoring the channel management layer  Second, optical signal quality monitoring  Finally, data protocol monitoring Introduction
  • 3.
    Motivation Present network isreaching theoretical limits, optical performance monitoring is becoming increasingly common to meet this requirement. Various optical impairments are present in a log distance channel like Noise, Distortion, Timing variations Individual or multiple component failures 4/17/2024 3 Objective  To measure various parameters like roll off factor, laser line width, wavelength for effective utilization of design.
  • 4.
    26/10/2021 4  Rolloff factor  Laser Linewidth  Wavelength. Parameters
  • 5.
  • 6.
    Software for simulation OPTISYSTEM 7 Simulation setup of the given system on Optisystem (OptiSystem enables users to plan, test, and simulate) where the aim is to observe the roll off factor between the range (0-1), laser linewidth between the range (100Khz-100Mhz) and wavelength(between the range 1530nm-1560nm) is implemented using various component present in optisystem like electrical constellation visualizer , eye diagram ,optical spectrum analyser. 4/17/2024 6
  • 7.
  • 8.
    4/17/2024 8 QPSK 16QAM OQPSK DPSK Eye Diagram for different modulation format 16 QAM constellation diagram for different ROF 0.1 ROF 0.3 ROF 0.8 ROF 1 ROF
  • 9.
    4/17/2024 9 16 QAMEye diagram for different ROF ROF=0.1 ROF=0.3 ROF=0.5 ROF=1 16 QAM Optical Spectrum analyzer for different ROF ROF=0.1 ROF=0.3 ROF=0.5 ROF=1
  • 10.
    4/17/2024 10 DPSK eyediagram for different laser line width 100Khz 10Mhz 100Mhz 30Mhz DPSK constellation diagram for different Laser linewidth 100 Khz 30Mhz 10Mhz 100Mhz
  • 11.
    4/17/2024 11 100Khz 30Mhz10Mhz 100Mhz DPSK optical Spectrum analyzer for different laser landwidth
  • 12.
    4/17/2024 12 OQPSK constellationdiagram for different wavelength 1530nm 1550nm 1540nm 1560nm
  • 13.
    4/17/2024 13 Machine learningis an application of artificial intelligence that provides systems the ability to automatically learn and improve from experience without being explicitly programmed. Machine learning algorithms offer powerful tools to solve various problems in many areas and they are being used in Optical communications.  Recently, ML algorithms have been utilized to process the optical communication data and achieved distinguished performance. Machine learning Convolutional Neural Network  Convolutional Neural Network is a deep Learning algorithm which can take in an input image, assign importance to various aspects/objects in the image and be able to differentiate one from the other.  A convolutional neural network consists of an input layer, hidden layer and an output layer.  Convolution Operation is to extract the high-level features such as edges, from the input image. Conventionally, the first ConvLayer is responsible for capturing the low-level features such as edges, color, gradient orientation, etc. With added layers, the architecture adapts to the high-level features
  • 14.
    4/17/2024 14 Input data Outputdata Fully connected Proposed Convolutional Neural Network model
  • 15.
  • 16.
    4/17/2024 16 CONFUSION MATRIXFOR INPUT IMAGE CLASSIFICATION
  • 17.
    4/17/2024 17 0 33.33 65.23 74.33 81.66 85.33 89.98 0 0 22.0223.45 18.14 32.01 33.06 0 12.47 31.22 24.36 33.08 32.03 31.05 0 10 20 30 40 50 60 70 80 90 100 0 50 100 150 200 250 300 ACCURACY PERCENTAGE EPOCHS OPM USING EYE DIAGRAM ROLL OFF FACTOR WAVELENGTH LASER LINEWIDTH RESULT 0 13.66 24.32 21.32 30.05 31.06 33.21 0 24.56 64.32 77.85 73.66 84.33 89.21 0 31.22 71.31 82.33 84.23 88.23 87.14 0 10 20 30 40 50 60 70 80 90 100 0 50 100 150 200 250 300 ACCURACY PERCENTAGE EPOCHS OPM USING OPTICAL SPECTRUM ROLL OFF FACTOR WAVELENGTH LASER LINEWIDTH
  • 18.
    4/17/2024 18 0 33.33 65.23 74.33 81.66 85.33 89.98 0 24.56 64.32 77.85 73.66 84.33 89.21 0 31.22 71.31 82.33 84.23 88.2387.14 0 10 20 30 40 50 60 70 80 90 100 0 5 0 1 0 0 1 5 0 2 0 0 2 5 0 3 0 0 PROPOSE D ME T HOD ACCURACY PERCENTAGE EPOCHS ROLL OFF FACTOR WAVELENGTH LASER LINEWIDTH RESULT 0 23.36 42.12 53.66 75.43 78.77 81.26 0 12.33 31.22 28.66 34.51 38.51 32.66 0 19.37 28.66 31.24 33.63 30.45 34.12 0 10 20 30 40 50 60 70 80 90 100 0 50 100 150 200 250 300 ACCURACY PERCENTAGE EPOCHS OPM USING CONSTELLATION DIAGRAM ROLL OFF FACTOR WAVELENGTH LASER LINEWIDTH
  • 19.
    4/17/2024 19 Existing work In reference paper only one parameter that is roll off factor(1550nm) is simulated and measured.  In reference paper all the simulation process in done on one modulation format that is QAM.  For particular value of parameter they have observe either eye diagram or constellation diagram. My work  In my work more than one parameter (ROF(0.1,0.5,1),Laser line width (0.1Mhz,10Mhz,100Mhz),wavelength(1530 nm,1550nm,1560nm)is simulated and measured .  In my work different modulation format is taken like (16 QAM,DPSK,OQPSK) to observe one particular parameter.  Here for particular value of parameter eye diagram ,constellation diagram and optical spectrum is observed simultaneously.
  • 20.
    Future Scope More investigationsare needed to determine multi parameter to determine the accuracy of the proposed method in the presence of linear and nonlinear optical fiber impairments. 4/17/2024 20
  • 21.
    References [1] D. Zibar,L. Henrique, H. D. Carvalho, M. Piels, A. Doberstein, J. Diniz, B. Nebendahl, C. Franciscangelis, J. Estaran, H. Haisch, N. G. Gonzalez, J. C. R. F. D. Oliveira, and I. T. Monroy, “Application of Machine Learning Techniques for Amplitude and Phase Noise Characterization,” Journal of Lightwave Technology, vol. 33, no. 7, pp. 1333–1343, 2015. [2] C. M. Bishop, Pattern recognition and machine learning, 2006 [3] B. Szafraniec, T. S. Marshall, and B. Nebendahl, “Performance monitoring and measurement techniques for coherent optical systems,” Journal of Lightwave Technology, vol. 31, no. 4, pp. 648–663, 2013. [4] L. Barletta, M. Magarini, and a. Spalvieri, “The information rate transferred through the discrete-time Wiener’s phase noise channel,” Journal of Lightwave Technology, vol. 30, no. 10, pp. 1480–1486, 2012. 4/17/2024 21