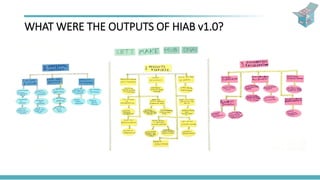
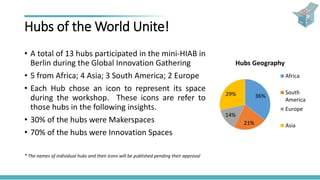
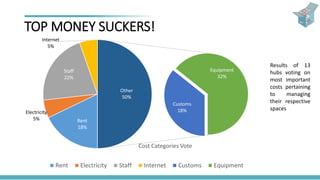
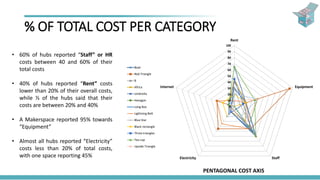
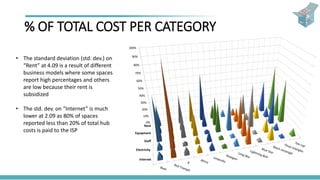
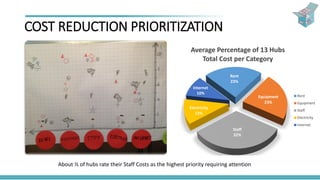
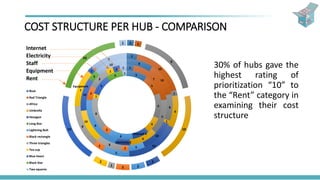
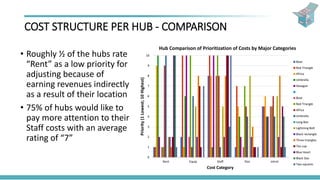
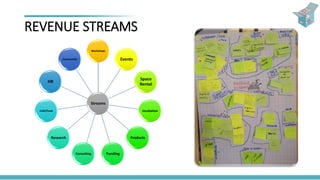
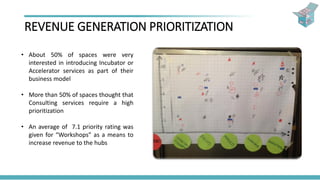
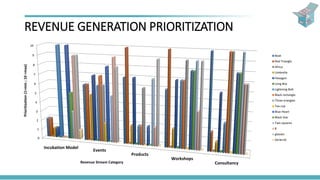
A codesigned workshop by
experienced Hub Managers
focusing on the core
aspects of managing a
financially sustainable
technology innovation hub.
WHY MINI HUB-IN-A-BOX?
May 2016. Global Innovation Gathering. Berlin, Germany
WHAT WERE THE OUTPUTS OF HIAB v1.0?
mini-HIAB PARTICIPANTS
Hubs of the World Unite!
• A total of 13 hubs participated in the mini-HIAB in
Berlin during the Global Innovation Gathering
• 5 from Africa; 4 Asia; 3 South America; 2 Europe
• Each Hub chose an icon to represent its space
during the workshop. These icons are refer to
those hubs in the following insights.
• 30% of the hubs were Makerspaces
• 70% of the hubs were Innovation Spaces
* The names of individual hubs and their icons will be published pending their approval
36%
21%
14%
29%
Hubs Geography
Africa
South
America
Europe
Asia
TOP MONEY SUCKERS!
o The participating hub representatives voted on
which different cost elements of managing a
hub was most relevant for future scrutiny.
o 50% of votes were grouped in the “Equipment”
category which saw a split between “Customs”
and “Equipment Capital & Materials”.
o The “Customs” label refers to import taxes of
parts and machines while the “Equipment”
refers to the cost of buying machines and
different materials.
TOP MONEY SUCKERS!
Rent
18%
Electricity
5%
Staff
22%
Internet
5%
Customs
18%
Equipment
32%
Other
50%
Cost Categories Vote
Rent Electricity Staff Internet Customs Equipment
Results of 13
hubs voting on
most important
costs pertaining
to managing
their respective
spaces
0
10
20
30
40
50
60
70
80
90
100
Rent
Equipment
StaffElectricity
Internet
PENTAGONAL COST AXIS
Boat
Red Triangle
8
Africa
Umbrella
Hexagon
Long Box
Lightning Bolt
Blue Star
Black rectangle
Three triangles
Tea cup
Upside Triangle
• 60% of hubs reported “Staff” or HR
costs between 40 and 60% of their
total costs
• 40% of hubs reported “Rent” costs
lower than 20% of their overall costs,
while ⅓ of the hubs said that their
costs are between 20% and 40%
• A Makerspace reported 95% towards
“Equipment”
• Almost all hubs reported “Electricity”
costs less than 20% of total costs,
with one space reporting 45%
% OF TOTAL COST PER CATEGORY
0%
10%
20%
30%
40%
50%
60%
70%
80%
90%
100%
Rent
Equipment
Staff
Electricity
Internet
• The standard deviation (std. dev.) on
“Rent” at 4.09 is a result of different
business models where some spaces
report high percentages and others
are low because their rent is
subsidized
• The std. dev. on “Internet” is much
lower at 2.09 as 80% of spaces
reported less than 20% of total hub
costs is paid to the ISP
COST REDUCTION PRIORITIZATION
Rent
23%
Equipment
23%
Staff
32%
Electricity
12%
Internet
10%
Average Percentage of 13 Hubs
Total Cost per Category
Rent
Equipment
Staff
Electricity
Internet
About ⅓ of hubs rate their Staff Costs as the highest priority requiring attention
COST STRUCTURE PER HUB - COMPARISON
5
5
6
4
Internet 4
6
2
8
1
5
4
1
1
7
5
4
Electricity 2
8
2
3
1
1 1
8
10
8
1
10
52
8
10
10
3
10
2
10
1
6
10
5
2
8
Equipment
7
1
7
1 1
9
10
2
221
2
10
10
1
Boat
Red Triangle
Africa
Umbrella
Hexagon
Long Box
Lightning Bolt
Black rectangle
Three triangles
Tea cup
Blue Heart
Black Star
Two squares
Rent
Equipment
Staff
Electricity
Internet
30% of hubs gave the
highest rating of
prioritization “10” to
the “Rent” category in
examining their cost
structure
COST STRUCTURE PER HUB - COMPARISON
• Roughly ½ of the hubs rate
“Rent” as a low priority for
adjusting because of
earning revenues indirectly
as a result of their location
• 75% of hubs would like to
pay more attention to their
Staff costs with an average
rating of “7”
0
1
2
3
4
5
6
7
8
9
10
Rent Equip Staff Elec Intrnt
Priority(1Lowest;10Highest)
Cost Category
Hub Comparison of Prioritization of Costs by Major Categories
Boat
Red Triangle
Africa
Umbrella
Hexagon
Boat
Red Triangle
Africa
Umbrella
Long Box
Lightning Bolt
Black rectangle
Three triangles
Tea cup
Blue Heart
Black Star
Two squares
REVENUE STREAMS
Streams
Workshops
Events
Space
Rental
Incubation
Products
FundingConsulting
Research
Café/Food
HR
Community
REVENUE GENERATION PRIORITIZATION
• About 50% of spaces were very
interested in introducing Incubator or
Accelerator services as part of their
business model
• More than 50% of spaces thought that
Consulting services require a high
prioritization
• An average of 7.1 priority rating was
given for “Workshops” as a means to
increase revenue to the hubs
REVENUE GENERATION PRIORITIZATION
0
1
2
3
4
5
6
7
8
9
10
Incubation Model
Events
Products
Workshops
Consultancy
Prioritization(1=min;10=max)
Revenue Stream Category
Boat
Red Triangle
Africa
Umbrella
Hexagon
Long Box
Lightning Bolt
Black rectangle
Three triangles
Tea cup
Blue Heart
Black Star
Two squares
8
glasses
Series16
BE PART OF IT!
Ahmed Bastawy
A.Bastawy@icealex.com
Muhammad Radwan
Radwan@icecairo.com

mini-HIAB - May 2016

  • 2.
    A codesigned workshopby experienced Hub Managers focusing on the core aspects of managing a financially sustainable technology innovation hub. WHY MINI HUB-IN-A-BOX? May 2016. Global Innovation Gathering. Berlin, Germany
  • 4.
    WHAT WERE THEOUTPUTS OF HIAB v1.0?
  • 5.
  • 6.
    Hubs of theWorld Unite! • A total of 13 hubs participated in the mini-HIAB in Berlin during the Global Innovation Gathering • 5 from Africa; 4 Asia; 3 South America; 2 Europe • Each Hub chose an icon to represent its space during the workshop. These icons are refer to those hubs in the following insights. • 30% of the hubs were Makerspaces • 70% of the hubs were Innovation Spaces * The names of individual hubs and their icons will be published pending their approval 36% 21% 14% 29% Hubs Geography Africa South America Europe Asia
  • 7.
    TOP MONEY SUCKERS! oThe participating hub representatives voted on which different cost elements of managing a hub was most relevant for future scrutiny. o 50% of votes were grouped in the “Equipment” category which saw a split between “Customs” and “Equipment Capital & Materials”. o The “Customs” label refers to import taxes of parts and machines while the “Equipment” refers to the cost of buying machines and different materials.
  • 8.
    TOP MONEY SUCKERS! Rent 18% Electricity 5% Staff 22% Internet 5% Customs 18% Equipment 32% Other 50% CostCategories Vote Rent Electricity Staff Internet Customs Equipment Results of 13 hubs voting on most important costs pertaining to managing their respective spaces
  • 9.
    0 10 20 30 40 50 60 70 80 90 100 Rent Equipment StaffElectricity Internet PENTAGONAL COST AXIS Boat RedTriangle 8 Africa Umbrella Hexagon Long Box Lightning Bolt Blue Star Black rectangle Three triangles Tea cup Upside Triangle • 60% of hubs reported “Staff” or HR costs between 40 and 60% of their total costs • 40% of hubs reported “Rent” costs lower than 20% of their overall costs, while ⅓ of the hubs said that their costs are between 20% and 40% • A Makerspace reported 95% towards “Equipment” • Almost all hubs reported “Electricity” costs less than 20% of total costs, with one space reporting 45% % OF TOTAL COST PER CATEGORY
  • 10.
    % OF TOTALCOST PER CATEGORY 0% 10% 20% 30% 40% 50% 60% 70% 80% 90% 100% Rent Equipment Staff Electricity Internet • The standard deviation (std. dev.) on “Rent” at 4.09 is a result of different business models where some spaces report high percentages and others are low because their rent is subsidized • The std. dev. on “Internet” is much lower at 2.09 as 80% of spaces reported less than 20% of total hub costs is paid to the ISP
  • 11.
    COST REDUCTION PRIORITIZATION Rent 23% Equipment 23% Staff 32% Electricity 12% Internet 10% AveragePercentage of 13 Hubs Total Cost per Category Rent Equipment Staff Electricity Internet About ⅓ of hubs rate their Staff Costs as the highest priority requiring attention
  • 12.
    COST STRUCTURE PERHUB - COMPARISON 5 5 6 4 Internet 4 6 2 8 1 5 4 1 1 7 5 4 Electricity 2 8 2 3 1 1 1 8 10 8 1 10 52 8 10 10 3 10 2 10 1 6 10 5 2 8 Equipment 7 1 7 1 1 9 10 2 221 2 10 10 1 Boat Red Triangle Africa Umbrella Hexagon Long Box Lightning Bolt Black rectangle Three triangles Tea cup Blue Heart Black Star Two squares Rent Equipment Staff Electricity Internet 30% of hubs gave the highest rating of prioritization “10” to the “Rent” category in examining their cost structure
  • 13.
    COST STRUCTURE PERHUB - COMPARISON • Roughly ½ of the hubs rate “Rent” as a low priority for adjusting because of earning revenues indirectly as a result of their location • 75% of hubs would like to pay more attention to their Staff costs with an average rating of “7” 0 1 2 3 4 5 6 7 8 9 10 Rent Equip Staff Elec Intrnt Priority(1Lowest;10Highest) Cost Category Hub Comparison of Prioritization of Costs by Major Categories Boat Red Triangle Africa Umbrella Hexagon Boat Red Triangle Africa Umbrella Long Box Lightning Bolt Black rectangle Three triangles Tea cup Blue Heart Black Star Two squares
  • 14.
  • 15.
    REVENUE GENERATION PRIORITIZATION •About 50% of spaces were very interested in introducing Incubator or Accelerator services as part of their business model • More than 50% of spaces thought that Consulting services require a high prioritization • An average of 7.1 priority rating was given for “Workshops” as a means to increase revenue to the hubs
  • 16.
    REVENUE GENERATION PRIORITIZATION 0 1 2 3 4 5 6 7 8 9 10 IncubationModel Events Products Workshops Consultancy Prioritization(1=min;10=max) Revenue Stream Category Boat Red Triangle Africa Umbrella Hexagon Long Box Lightning Bolt Black rectangle Three triangles Tea cup Blue Heart Black Star Two squares 8 glasses Series16
  • 18.
    BE PART OFIT! Ahmed Bastawy A.Bastawy@icealex.com Muhammad Radwan Radwan@icecairo.com