Downloaded 17 times

![Copyright © 2017, Oracle and/or its affiliates. All rights reserved. | 9
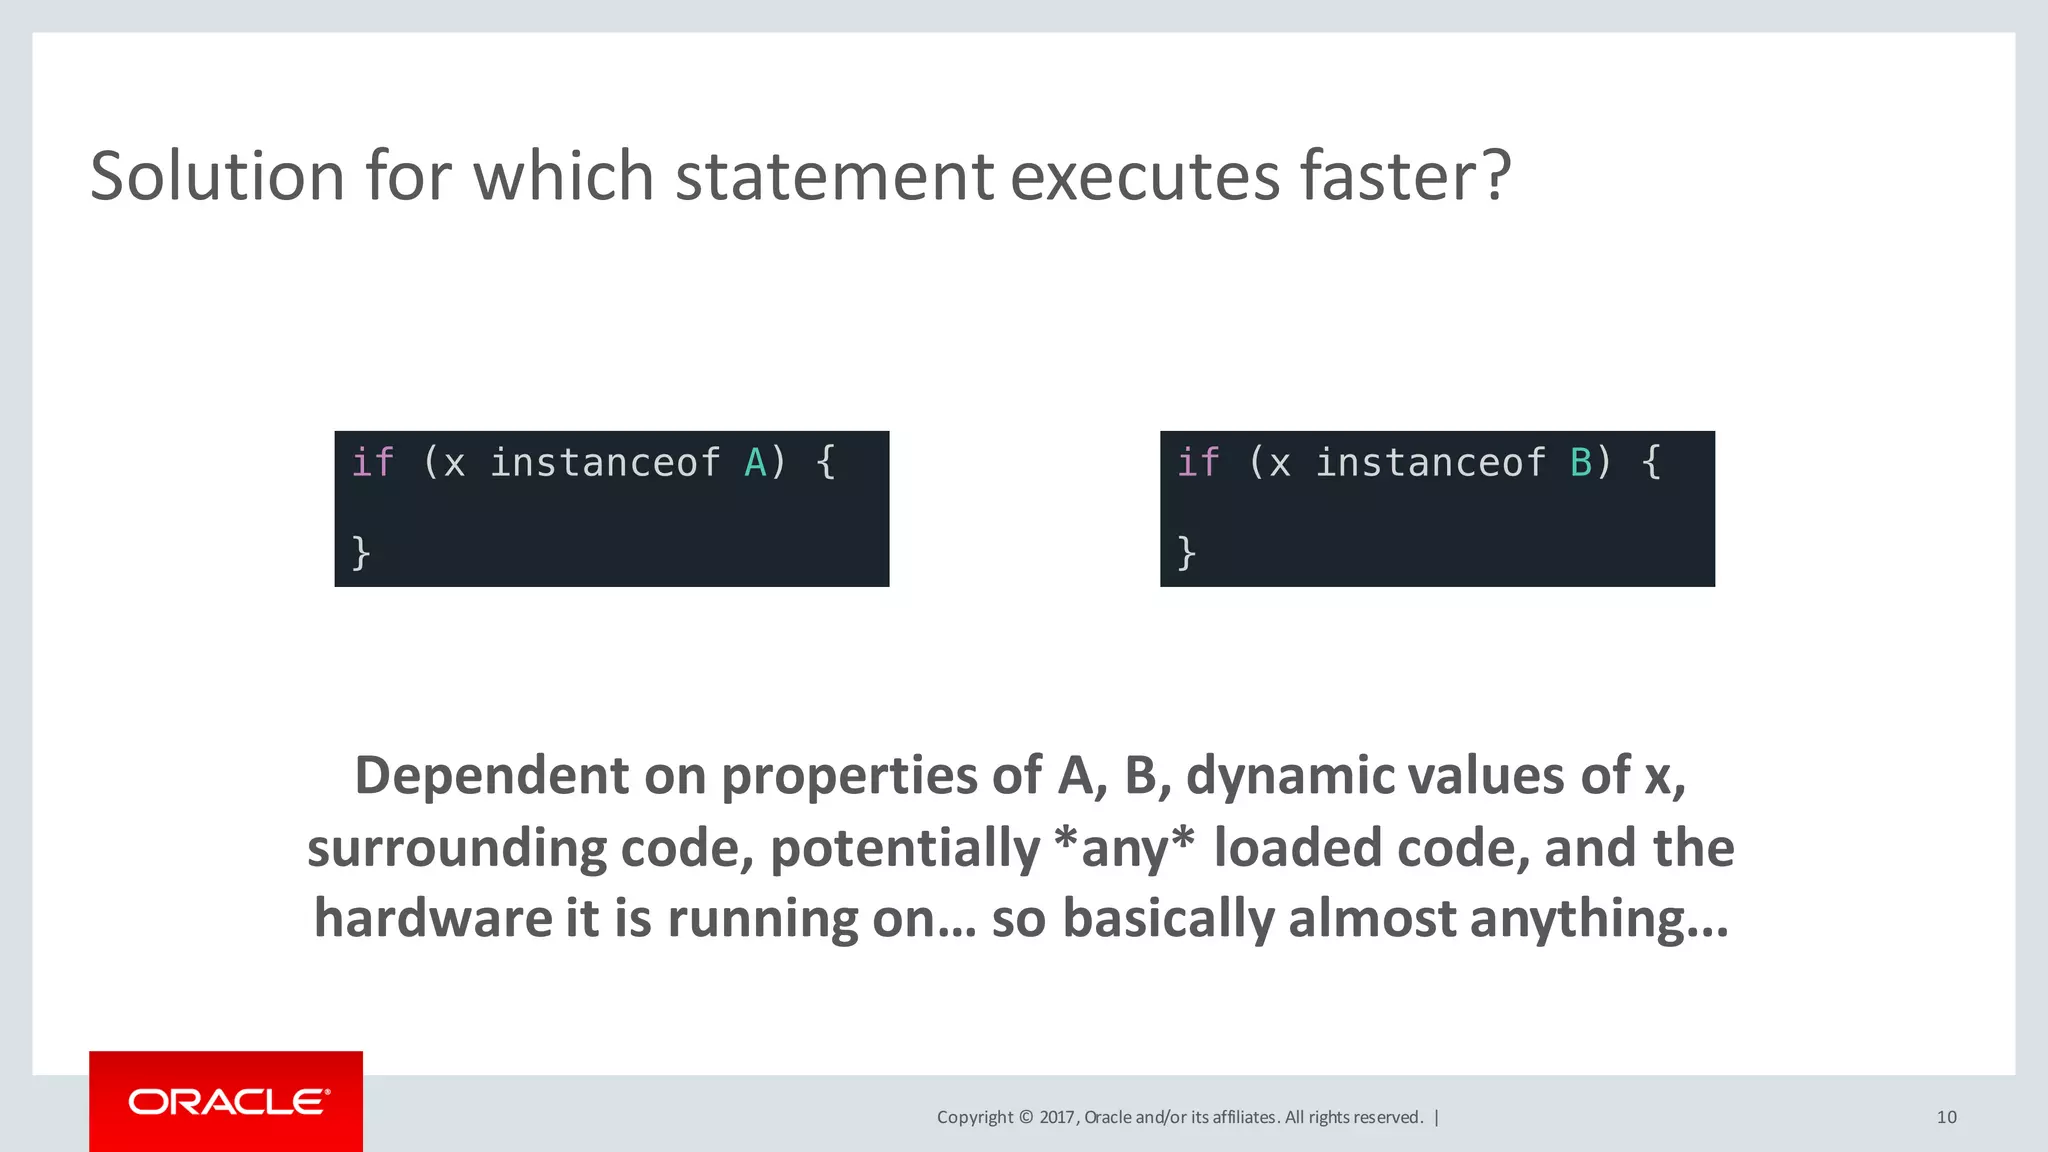
Example Assumptions in Other Languages
• JavaScript Array.prototype[100] = 42;
console.log([1, 2, 3][100]);
x <- c(1, 2)
`[<-` <- function(x, i, j, ..., value) { 42 }
x[1] <- 100
print(x)
print(length(x))
Fixnum.send :define_method, :+ do |other|
self - other
end
puts 44 + 2
• Ruby
• Let’s talk about R…](https://image.slidesharecdn.com/microbenchmarkingharmful-170502144947/75/Micro-Benchmarking-Considered-Harmful-9-2048.jpg)
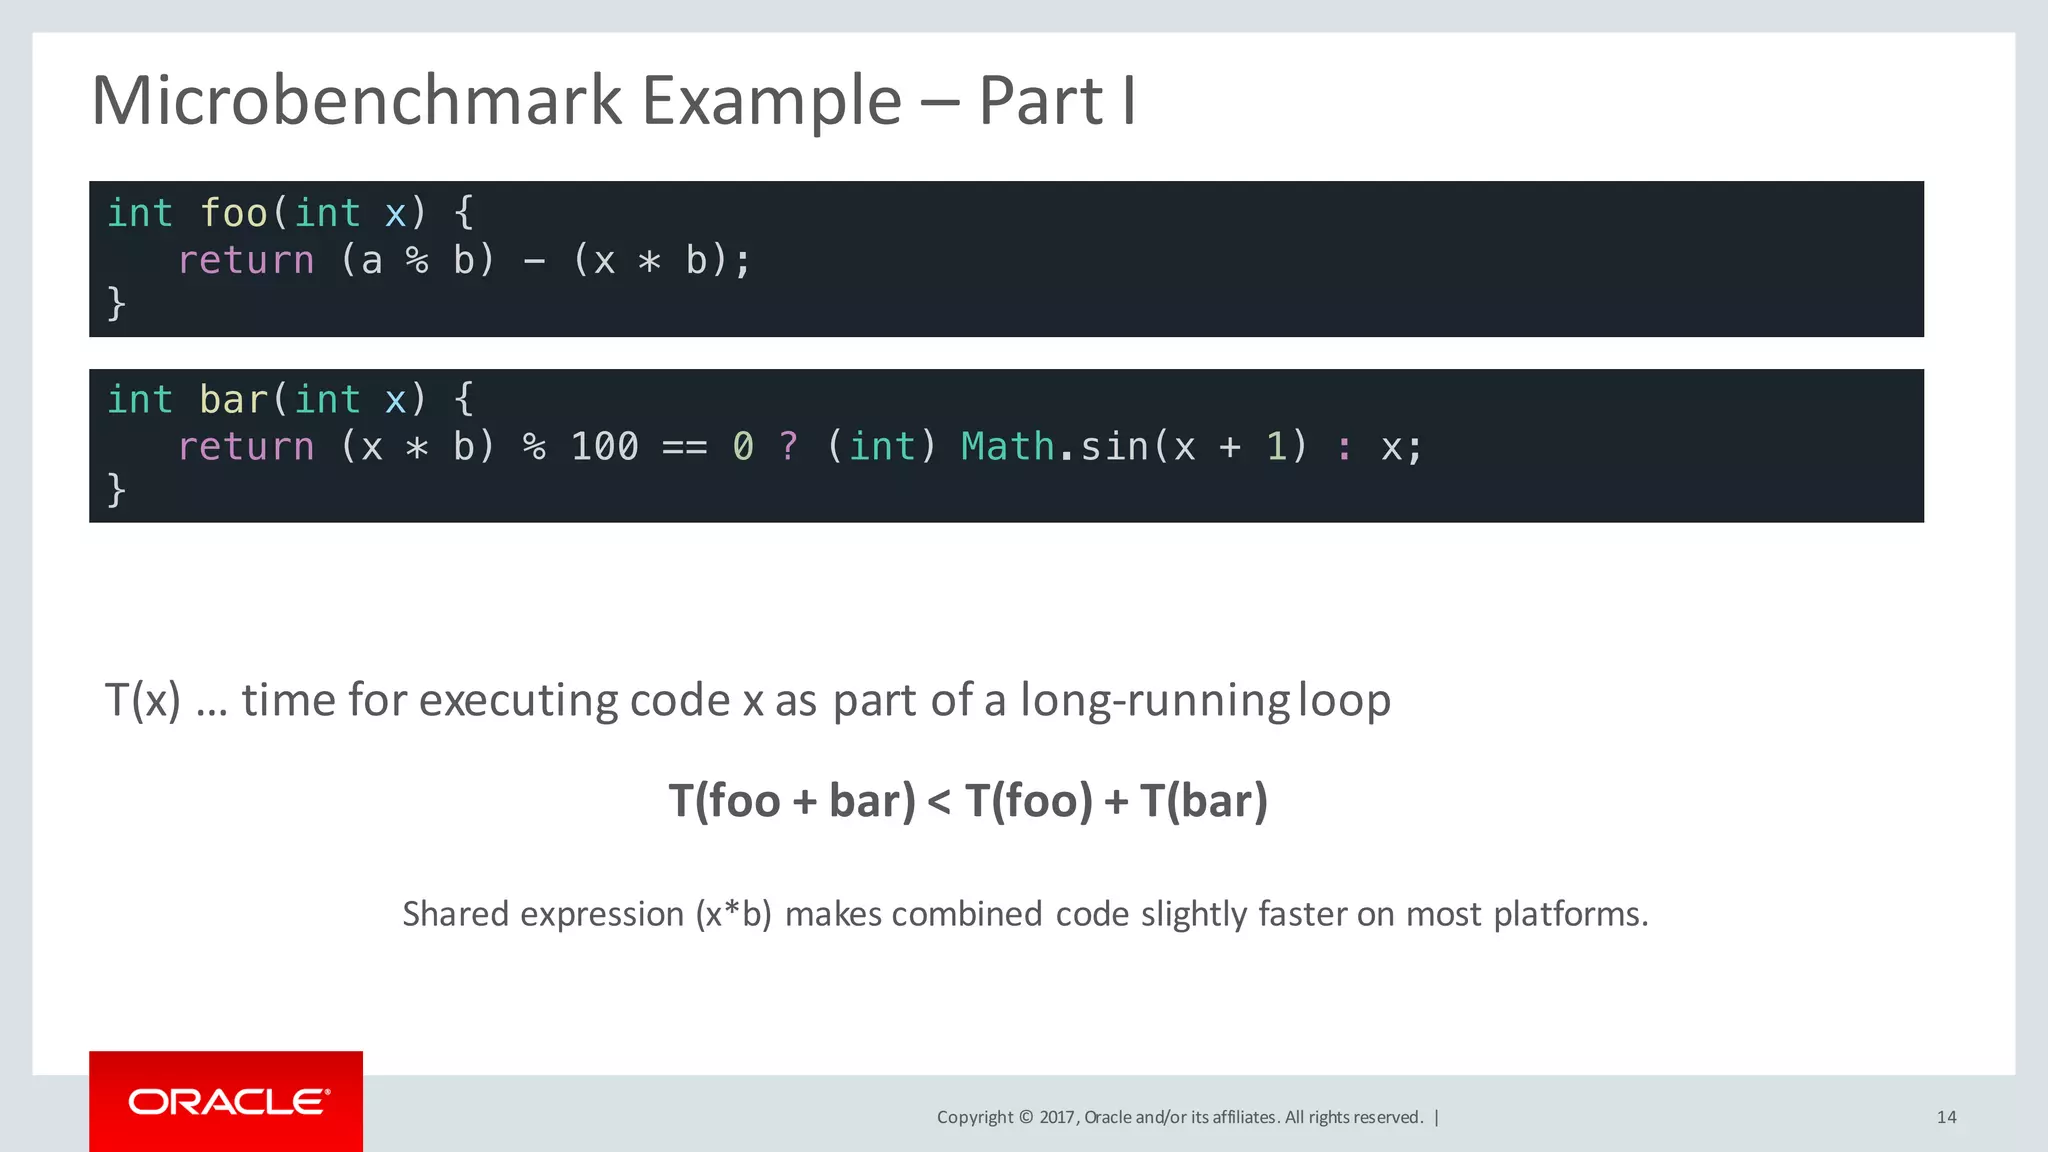


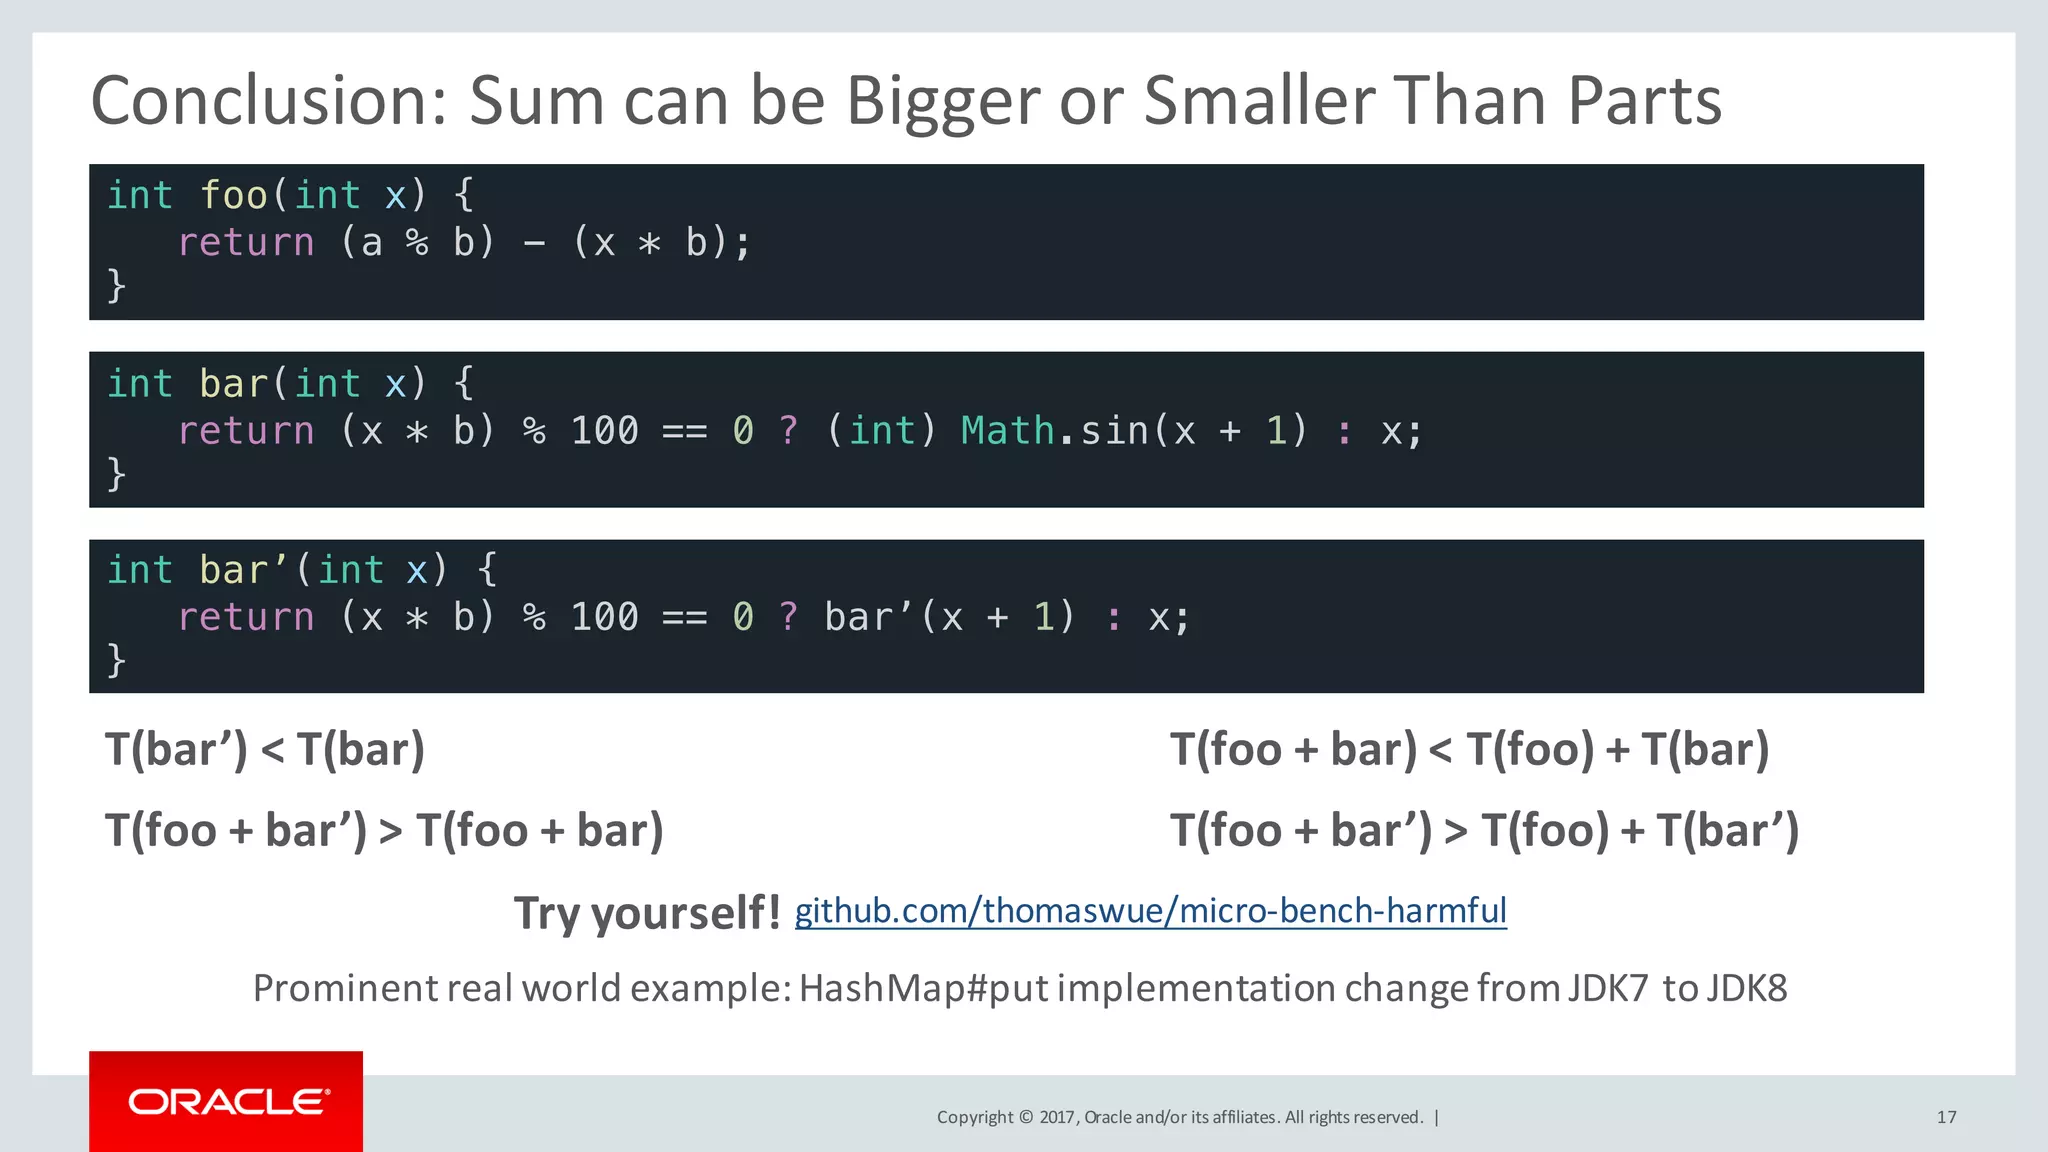
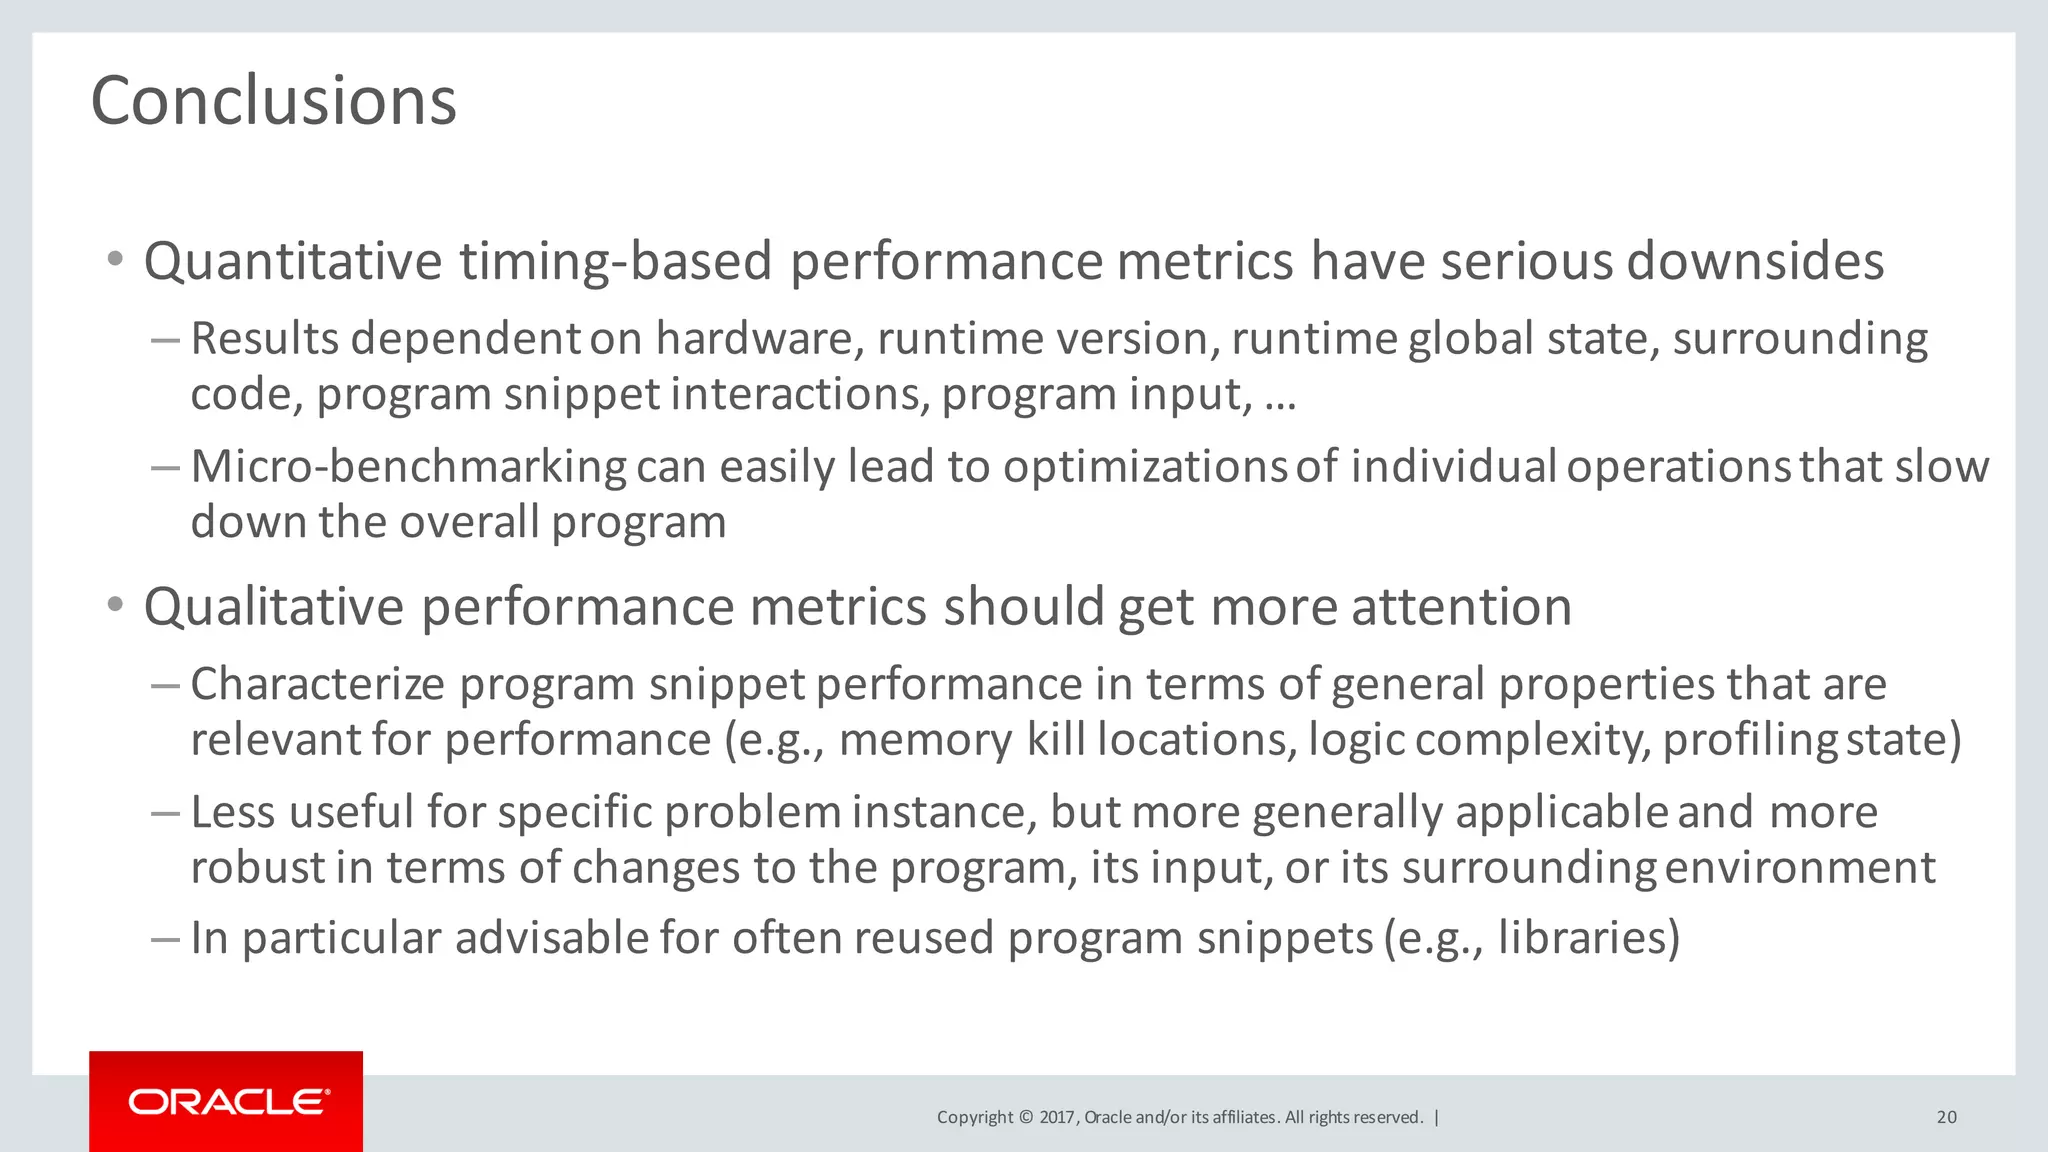

The document presents a keynote by Thomas Wuerthinger at the ACM/SPEC International Conference on Performance Engineering, discussing the complications of determining code execution speed in Java due to various dynamic factors. It argues against the reliability of micro-benchmarking for assessing performance, emphasizing that small code snippets can yield misleading results when assessed in isolation from their context. The conclusion suggests that qualitative performance metrics may be more useful than quantitative ones for characterizing performance across various programming scenarios.