The document recommends purchasing $400 million of 11.375% Senior Subordinated Notes issued by Michaels Stores, Inc. due to its belief that Michaels will weather the economic downturn better than most retailers and that the yield adequately compensates for the risks. Michaels is the largest arts and crafts retailer in North America with a history of growth and margin improvement. While near-term earnings may decline, the company is expected to maintain its market position, grow stores, generate cash flow, and reduce debt.
El documento describe los sistemas excretores en animales. Explica que la excreción es el proceso de eliminar sustancias tóxicas producidas por el metabolismo para mantener la homeostasis. En invertebrados, las sustancias nitrogenadas se eliminan por difusión o mediante protonefridios y metanefridios. En vertebrados, los riñones filtran la sangre para formar la orina, que se almacena en la vejiga y se expulsa a través de la uretra.
The document describes the TDA8947J, a 4-channel audio amplifier IC. It can operate as 4 single-ended channels, 2 bridge-tied load channels, or a combination. Key features include soft clipping protection, mute and standby modes, and thermal protection from short circuits or high temperatures. Applications include TVs, speakers, audio receivers. It provides up to 25W single-ended or 50W bridge-tied load power and has input/output pins compatible with similar Philips ICs.
This annual report summarizes Lowe's performance in 2002. Some key points:
- Sales increased 19.8% to $26.5 billion and comparable store sales increased 5.6%. 123 new stores were opened.
- Gross margin reached a record high of 30.3% due to merchandising and sourcing strategies as well as inventory and process improvements in stores.
- Net earnings increased 43.8% to $1.47 billion.
- The company plans to continue growing by opening more stores, expanding installed sales and special order businesses, and gaining market share in more product categories.
The document recommends that housing is the most attractive investment option in the United States. It advises against investing in stocks or gold, stating that after four years of falling home prices, housing is now the best asset class. The source is a 2011 article in Fortune Magazine written by Shawn Tully titled "Real estate: It’s time to buy again".
JBS S.A. is the largest global beef and lamb producer, largest global leather processor, second largest global chicken producer, and third largest pork and dairy producer in key markets. In 2011, JBS reported consolidated net revenue of R$61.8 billion, a 13% increase over 2010. EBITDA was R$3.15 billion, down 16.3% due to losses at Pilgrim's Pride. By business unit, JBS USA Beef revenue increased 25.6% to $16.5 billion with an 11.4% higher EBITDA of $739.1 million. JBS USA Pork revenue rose 17.5% to $3.5 billion and EBITDA increased 22.
- Cummins has doubled revenue over the past 5 years and achieved the highest 3-year period of net earnings as a percent of sales in over 40 years.
- The company has diversified globally and by end markets to reduce cyclicality, aggressively pursued low cost leadership, and built greater earnings stability.
- Cummins is investing in new engine platforms and technologies to capitalize on growth opportunities from evolving global emission standards.
This document summarizes an earnings conference call for Oshkosh Truck Corporation for the second quarter of fiscal year 2007. Sales increased 96.6% to $1.66 billion and operating income grew 69.1% to $134.8 million. For fiscal year 2007, the company estimates sales of $6.1-6.2 billion and operating income of $568-580 million. It also provides segment-level results and highlights for access equipment, defense, fire & emergency, and commercial.
The document provides an overview and investment thesis for an LBO of Joseph A. Banks, a men's clothing retailer. Key points include: Joseph A. Banks has shown strong top-line growth and cash flows. The management team was overhauled in 2000 and has posted consistent comp sales growth. Risks include consumer demand changes and real estate challenges, but these are mitigated by the company's track record. The valuation compares Joseph A. Banks to competitors, finding it currently undervalued. Financial projections in a downside and base case show potential returns of 11-24% IRR with a 5-year exit.
1) The document is from a presentation given by Oshkosh executives Charles Szews and David Sagehorn at the R.W. Baird Industrial Conference on November 12, 2008.
2) Oshkosh reported sales increased 13.2% to $7.1 billion in fiscal 2008, with international sales reaching $2.1 billion. However, operating income decreased 1.5% and EPS decreased 5.9% due to non-cash impairment charges.
3) Oshkosh recently secured multiple defense contracts and sees opportunities in the domestic refuse collection vehicle market, but the current market volatility and credit crisis make fiscal 2009 projections difficult given exposure to construction and municipal spending.
This annual report summarizes Ameriprise Financial's performance in 2006. Some key points:
- Revenues grew 11% to $8.1 billion and earnings grew 25% to $866 million.
- Total client assets grew 9% to $466 billion and life insurance in force grew 9% to $174 billion.
- The company strengthened its brand awareness, which grew from near zero to 50% by the end of 2006.
- Ameriprise is well positioned to serve the growing number of baby boomers entering retirement over the next two decades as the first boomers turned 60 in 2006.
This annual report summarizes Ameriprise Financial's performance in 2006. Some key points:
- Revenues grew 11% to $8.1 billion and earnings grew 25% to $866 million.
- Total client assets grew 9% to $466 billion and life insurance in force grew 9% to $174 billion.
- The company continued to invest in its brand, advisor force, products, and technology to capitalize on serving the growing mass affluent and affluent market, especially retiring baby boomers who will need financial advice and solutions.
Granite Company Overview 2013 | Nationwide Voice and Data for BusinessesShane Hoff
Granite is one of the premier telecommunications solutions providers for businesses across the United States and Canada, servicing more than 70 Fortune 100 companies. Granite offers dial-tone, infrastructure solutions, advanced data services, broadband, and security services to our customers at significant savings. Some of the key benefits of Granite’s solutions include: Consolidated billing and support, Nationwide coverage in the US and Canada, Optimized for multi-location companies
Each month, Charter One Realty publishes updates for each of the major areas in its real estate market. On the 14th of each month Hilton Head Island areas are updated. On the 28th, Bluffton-Mainland communities are updated. This is a compilation of those updates with links to each community. If you have any questions, visit our website at www.charteronerealestate.com or email us at info@charteronerealty.com. Thanks and we hope you find this report useful.
Group 1 Automotive is a leading automotive retailer in the US. In 2006:
- Group 1 owned 104 dealerships across 14 states selling 33 brands and operating 28 collision centers.
- Revenues increased 2.4% to $6.08 billion from vehicle sales and related services.
- Operating income grew 24.2% to $204.7 million and diluted earnings per share increased 25% to $3.62.
- The CEO reported solid performance improvements in 2006 from strategic initiatives that focused on operational efficiencies across the company's over 100 dealerships.
Group 1 Automotive is a leading automotive retailer that owns 104 dealerships across 14 states, selling 33 brands and 143 franchises. In 2006, Group 1 achieved record revenues of over $6 billion and sold over 197,000 retail vehicles. The company focused on streamlining operations, increasing import and luxury brand sales, acquiring additional dealerships, and improving financial metrics such as earnings per share.
The document provides an overview of Cummins Inc.'s management team and financial performance. It introduces the executive committee and lists the vice presidents of various business divisions. It then summarizes Cummins' financial targets for metrics like revenue growth, EBIT margin, capital expenditures, and debt-to-capital ratio. Several charts show how the company has delivered on these targets and improved its stock price, margins, earnings, and return on equity over time.
This document introduces Cummins' management team and provides an overview of the company's strategy and financial performance. It outlines goals such as revenue growth of 8-10% annually, an EBIT margin of 6-9%, and keeping capital expenditures below depreciation and amortization. Charts show strong growth in sales, stock price outperformance, and profitability of joint ventures. The summary emphasizes Cummins' focus on creating shareholder value through earnings growth, cash management, and reducing cyclicality in its business.
Fiserv has experienced strong growth over its 20 year history, with revenues increasing at a 24% compounded annual rate and earnings per share growing at 21%. The company focuses on organic revenue growth through expanding existing client relationships and adding new clients by providing integrated solutions and value-added services. Fiserv's transaction processing expertise positions it well to capitalize on emerging trends in financial services and health plan management. The company's integration initiative aims to tightly integrate its technology platforms to better serve clients and drive organic growth.
Smithfield Foods reported record financial performance in fiscal year 2004 with revenues exceeding $9 billion, up 30% from the previous year. Net income increased sharply to $227.1 million compared to $11.9 million in 2003, driven by higher hog and beef prices. The acquisition of Farmland Foods, which added $1.6 billion in annual sales, significantly improved earnings in both hog production and pork processing. Looking ahead, the company expects fiscal 2005 results to be positively impacted by strong consumer demand and higher hog prices.
Foot Locker's 2005 annual report summarizes the company's financial performance and growth strategies. [1] Sales increased 5.6% to $5.7 billion while pre-tax profit rose 8.3% to $405 million. [2] The company exceeded its goal of $350 in sales per average gross square foot and plans to raise the target to $400. [3] Growth strategies include opening 175 new stores in 2006, expanding direct-to-customer sales, and pursuing acquisition opportunities.
Ingram Micro is the largest global wholesale provider of technology products and services, operating in 36 countries with $30.7 billion in annual sales. In 2000, Ingram Micro focused on improving gross margins and reducing costs, leading to a 77% increase in operating profits despite challenges in sales growth. The company aims to continue enhancing its global distribution network and customer services to maintain its leadership position in the technology supply chain industry.
Weyerhaeuser Analyst Meeting DC – Day 1 (Economic Overview)finance15
This document provides an agenda and background materials for an analyst seminar being held by Weyerhaeuser Real Estate Company (WRECO) in May 2005. The agenda covers an overview of WRECO, its homebuilding operations, land and land development, construction practices and trends, and a case study. Background slides provide financial performance details on WRECO, its competitive advantages in the homebuilding industry, land pipeline, safety record, and subsidiary Weyerhaeuser Realty Investors.
Robert Bohn and David Sagehorn of Oshkosh Corporation gave a presentation at the Goldman Sachs Conference in November 2008. They discussed Oshkosh's strong financial position and actions taken to reduce costs and debt. While market conditions were volatile due to the economic downturn, Oshkosh was well positioned with backlogs in defense, fire, and refuse collection vehicles. The presentation outlined Oshkosh's segments and strategies to manage through the difficult economy.
The document provides an earnings review for 2011 that includes the following key points:
1. Financial highlights show increased gross revenue, gross profit, and EBITDA for 2011 compared to 2010, but a net loss. Q4 2011 also saw increases over Q4 2010.
2. Operational highlights include acquisitions, geographic expansion, new products from research and development, and other accomplishments like regulatory approvals.
3. Expectations for 2012 include new product releases from research and development, increased revenue opportunities from expansion, potential acquisitions, and other initiatives.
1) Oshkosh reported record second quarter fiscal year 2006 results with sales up 25.6% and operating income up 27.3% driven by strong performance in the defense segment.
2) The defense segment results nearly doubled compared to the previous year due to growth in remanufactured and new truck sales, however challenges remain in locating used vehicle carcasses for remanufacturing.
3) The fire and emergency segment saw a temporary dip in earnings as anticipated due to heavily weighted airport product sales in the second half of the year and two component issues that delayed revenue recognition.
GameStop held its 2007 Annual Meeting of Stockholders. The document provided an overview of GameStop's business including its global store base which totals over 4,800 stores across the US, Europe, Canada, and Australia. Financial information was presented showing sales growth from $1 billion in 1999 to a projected $6.4 billion in 2007, as well as income statement details such as a 57% increase in net income from 2005 to 2006. Drivers for continued growth in 2007 were identified as the expanding installed base of video game platforms and a strong lineup of new game titles.
GameStop held its 2007 Annual Meeting of Stockholders. The document provided an overview of GameStop's business including its global store base which totals over 4,800 stores across the US, Europe, Canada, and Australia. Financial information was presented showing sales growth from $1 billion in 1999 to an estimated $6.4 billion in 2007, as well as income statement details such as a 57% increase in net income from 2005 to 2006. Drivers for continued growth in the video game market in 2007 were also outlined.
Credit analyst, high yield, distressed debtRonald Rich
Ronald Rich has over 20 years of experience in credit analysis, distressed investing, and corporate restructuring. He has specialized in analyzing high yield and distressed debt across various industries. He currently works as a senior restructuring advisor where he leads negotiations to restructure troubled fixed income investments.
The document recommends purchasing Swift Transportation's $1.5 billion term loan at or below 75% of par value. Swift is a large trucking company that was taken private in a leveraged buyout in 2007. While Swift faces challenges from a downturn in the trucking industry and its high debt load, the recommendation is that Swift will restructure in bankruptcy but the term loan will likely receive post-petition interest and equity in the restructured company, offering an investment return over 20%.
- Associated Materials Inc. is a leading manufacturer and distributor of vinyl windows, vinyl siding, aluminum and steel siding, and accessories, headquartered in Cuyahoga Falls, OH. It has recently been negatively impacted by soft repair and remodeling markets, rising material costs, and slowing vinyl siding growth.
- The report initiates coverage on Associated Materials' bonds with a HOLD recommendation on the 9.75% Senior Subordinated Notes and a SELL recommendation on the 11.25% Senior Discount Notes.
- Key risks to the company include further raw material cost increases, competition from fiber-cement siding, a slowing housing market, and a recent CEO resignation.
- Tekni-Plex is a manufacturer and distributor of flexible packaging and tubing products that is highly leveraged due to acquisition and financing activities.
- The company has been negatively impacted by rising raw material costs and has struggled to pass through price increases, particularly in its garden hose business which accounts for 25% of sales.
- The report predicts that Tekni-Plex will face a liquidity crisis in the second quarter of fiscal year 2007 as interest payments and capital expenditures outpace projected adjusted EBITDA and liquidity levels, necessitating a restructuring or asset sale.
- While a turnaround is anticipated as raw material costs abate and pricing increases take effect, the risks associated
- The report initiates coverage on Ply Gem Holdings' 9% senior subordinated notes with a buy recommendation, believing the notes will outperform comparable peers due to Ply Gem's ability to mitigate risks from a slowing housing market.
- While Ply Gem relies on new home construction for 68% of sales, the report expects it can offset this exposure through acquisitions and cost savings, projecting positive free cash flow and improving liquidity.
- However, future acquisitions and debt-funded activities increase credit risks, though the company's appetite for deals may be tempered in the current housing slowdown.
- Integrated Electrical Services (IES) is a $1.1 billion electrical contracting and maintenance services provider undergoing an operational turnaround due to past issues with project management and a difficult surety bonding environment.
- IES is highly leveraged with an adjusted net leverage ratio of 21.6x due to acquisitions, raising liquidity concerns. Near-term liquidity appears sufficient but future divestitures may be difficult and less financially productive.
- Risks include reduced surety bonding capacity, declining revenues, potential covenant defaults, management turnover, and a troubled industry recovery in bankruptcy. The report initiates coverage with a SELL recommendation on IES's senior subordinated notes.
- We initiate coverage of Bally Total Fitness with a BUY recommendation on the 10.5% Senior Notes due to their yield of 11.1% and value support even in bankruptcy. We have a HOLD recommendation on the 9.875% Senior Subordinated Notes due to near-term downside risk and impairment risk in bankruptcy.
- Bally has been undermanaged but possesses substantial core value from its large footprint, brand, and membership base. A successful turnaround requires improving members' experience while lowering costs.
- Bally's membership declined 1.4% to 3.56 million in 3Q06. Cash flow is projected to be negative $41.4 million and $47.1 million
University of North Carolina at Charlotte degree offer diploma Transcripttscdzuip
办理美国UNCC毕业证书制作北卡大学夏洛特分校假文凭定制Q微168899991做UNCC留信网教留服认证海牙认证改UNCC成绩单GPA做UNCC假学位证假文凭高仿毕业证GRE代考如何申请北卡罗莱纳大学夏洛特分校University of North Carolina at Charlotte degree offer diploma Transcript
Unlock Your Potential with NCVT MIS.pptxcosmo-soil
The NCVT MIS Certificate, issued by the National Council for Vocational Training (NCVT), is a crucial credential for skill development in India. Recognized nationwide, it verifies vocational training across diverse trades, enhancing employment prospects, standardizing training quality, and promoting self-employment. This certification is integral to India's growing labor force, fostering skill development and economic growth.
OJP data from firms like Vicinity Jobs have emerged as a complement to traditional sources of labour demand data, such as the Job Vacancy and Wages Survey (JVWS). Ibrahim Abuallail, PhD Candidate, University of Ottawa, presented research relating to bias in OJPs and a proposed approach to effectively adjust OJP data to complement existing official data (such as from the JVWS) and improve the measurement of labour demand.
In a tight labour market, job-seekers gain bargaining power and leverage it into greater job quality—at least, that’s the conventional wisdom.
Michael, LMIC Economist, presented findings that reveal a weakened relationship between labour market tightness and job quality indicators following the pandemic. Labour market tightness coincided with growth in real wages for only a portion of workers: those in low-wage jobs requiring little education. Several factors—including labour market composition, worker and employer behaviour, and labour market practices—have contributed to the absence of worker benefits. These will be investigated further in future work.
A toxic combination of 15 years of low growth, and four decades of high inequality, has left Britain poorer and falling behind its peers. Productivity growth is weak and public investment is low, while wages today are no higher than they were before the financial crisis. Britain needs a new economic strategy to lift itself out of stagnation.
Scotland is in many ways a microcosm of this challenge. It has become a hub for creative industries, is home to several world-class universities and a thriving community of businesses – strengths that need to be harness and leveraged. But it also has high levels of deprivation, with homelessness reaching a record high and nearly half a million people living in very deep poverty last year. Scotland won’t be truly thriving unless it finds ways to ensure that all its inhabitants benefit from growth and investment. This is the central challenge facing policy makers both in Holyrood and Westminster.
What should a new national economic strategy for Scotland include? What would the pursuit of stronger economic growth mean for local, national and UK-wide policy makers? How will economic change affect the jobs we do, the places we live and the businesses we work for? And what are the prospects for cities like Glasgow, and nations like Scotland, in rising to these challenges?
Vicinity Jobs’ data includes more than three million 2023 OJPs and thousands of skills. Most skills appear in less than 0.02% of job postings, so most postings rely on a small subset of commonly used terms, like teamwork.
Laura Adkins-Hackett, Economist, LMIC, and Sukriti Trehan, Data Scientist, LMIC, presented their research exploring trends in the skills listed in OJPs to develop a deeper understanding of in-demand skills. This research project uses pointwise mutual information and other methods to extract more information about common skills from the relationships between skills, occupations and regions.
Falcon stands out as a top-tier P2P Invoice Discounting platform in India, bridging esteemed blue-chip companies and eager investors. Our goal is to transform the investment landscape in India by establishing a comprehensive destination for borrowers and investors with diverse profiles and needs, all while minimizing risk. What sets Falcon apart is the elimination of intermediaries such as commercial banks and depository institutions, allowing investors to enjoy higher yields.
"Does Foreign Direct Investment Negatively Affect Preservation of Culture in the Global South? Case Studies in Thailand and Cambodia."
Do elements of globalization, such as Foreign Direct Investment (FDI), negatively affect the ability of countries in the Global South to preserve their culture? This research aims to answer this question by employing a cross-sectional comparative case study analysis utilizing methods of difference. Thailand and Cambodia are compared as they are in the same region and have a similar culture. The metric of difference between Thailand and Cambodia is their ability to preserve their culture. This ability is operationalized by their respective attitudes towards FDI; Thailand imposes stringent regulations and limitations on FDI while Cambodia does not hesitate to accept most FDI and imposes fewer limitations. The evidence from this study suggests that FDI from globally influential countries with high gross domestic products (GDPs) (e.g. China, U.S.) challenges the ability of countries with lower GDPs (e.g. Cambodia) to protect their culture. Furthermore, the ability, or lack thereof, of the receiving countries to protect their culture is amplified by the existence and implementation of restrictive FDI policies imposed by their governments.
My study abroad in Bali, Indonesia, inspired this research topic as I noticed how globalization is changing the culture of its people. I learned their language and way of life which helped me understand the beauty and importance of cultural preservation. I believe we could all benefit from learning new perspectives as they could help us ideate solutions to contemporary issues and empathize with others.
Fabular Frames and the Four Ratio ProblemMajid Iqbal
Digital, interactive art showing the struggle of a society in providing for its present population while also saving planetary resources for future generations. Spread across several frames, the art is actually the rendering of real and speculative data. The stereographic projections change shape in response to prompts and provocations. Visitors interact with the model through speculative statements about how to increase savings across communities, regions, ecosystems and environments. Their fabulations combined with random noise, i.e. factors beyond control, have a dramatic effect on the societal transition. Things get better. Things get worse. The aim is to give visitors a new grasp and feel of the ongoing struggles in democracies around the world.
Stunning art in the small multiples format brings out the spatiotemporal nature of societal transitions, against backdrop issues such as energy, housing, waste, farmland and forest. In each frame we see hopeful and frightful interplays between spending and saving. Problems emerge when one of the two parts of the existential anaglyph rapidly shrinks like Arctic ice, as factors cross thresholds. Ecological wealth and intergenerational equity areFour at stake. Not enough spending could mean economic stress, social unrest and political conflict. Not enough saving and there will be climate breakdown and ‘bankruptcy’. So where does speculative design start and the gambling and betting end? Behind each fabular frame is a four ratio problem. Each ratio reflects the level of sacrifice and self-restraint a society is willing to accept, against promises of prosperity and freedom. Some values seem to stabilise a frame while others cause collapse. Get the ratios right and we can have it all. Get them wrong and things get more desperate.
Optimizing Net Interest Margin (NIM) in the Financial Sector (With Examples).pdfshruti1menon2
NIM is calculated as the difference between interest income earned and interest expenses paid, divided by interest-earning assets.
Importance: NIM serves as a critical measure of a financial institution's profitability and operational efficiency. It reflects how effectively the institution is utilizing its interest-earning assets to generate income while managing interest costs.
Tdasx: In-Depth Analysis of Cryptocurrency Giveaway Scams and Security Strate...
Michaels Stores 080414
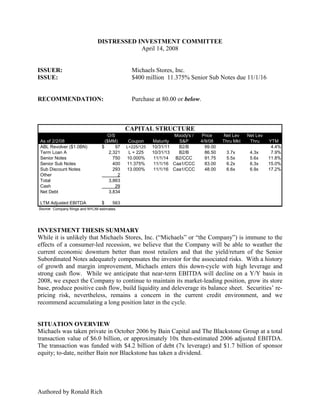
1. DISTRESSED INVESTMENT COMMITTEE
April 14, 2008
ISSUER: Michaels Stores, Inc.
ISSUE: $400 million 11.375% Senior Sub Notes due 11/1/16
RECOMMENDATION: Purchase at 80.00 or below.
CAPITAL STRUCTURE
O/S Moody's / Price Net Lev Net Lev
As of 2/2/08 ($MM) Coupon Maturity S&P 4/9/08 Thru Mkt Thru YTM
ABL Revolver ($1.0BN) $ 97 L+225/125 10/31/11 B2/B 99.00 4.4%
Term Loan A 2,321 L + 225 10/31/13 B2/B 86.50 3.7x 4.3x 7.9%
Senior Notes 750 10.000% 11/1/14 B2/CCC 91.75 5.5x 5.6x 11.8%
Senior Sub Notes 400 11.375% 11/1/16 Caa1/CCC 83.00 6.2x 6.3x 15.0%
Sub Discount Notes 293 13.000% 11/1/16 Caa1/CCC 48.00 6.6x 6.9x 17.2%
Other 2
Total 3,863
Cash 29
Net Debt 3,834
LTM Adjusted EBITDA $ 563
Source: Company filings and NYLIM estimates.
INVESTMENT THESIS SUMMARY
While it is unlikely that Michaels Stores, Inc. (“Michaels” or “the Company”) is immune to the
effects of a consumer-led recession, we believe that the Company will be able to weather the
current economic downturn better than most retailers and that the yield/return of the Senior
Subordinated Notes adequately compensates the investor for the associated risks. With a history
of growth and margin improvement, Michaels enters this down-cycle with high leverage and
strong cash flow. While we anticipate that near-term EBITDA will decline on a Y/Y basis in
2008, we expect the Company to continue to maintain its market-leading position, grow its store
base, produce positive cash flow, build liquidity and deleverage its balance sheet. Securities’ re-
pricing risk, nevertheless, remains a concern in the current credit environment, and we
recommend accumulating a long position later in the cycle.
SITUATION OVERVIEW
Michaels was taken private in October 2006 by Bain Capital and The Blackstone Group at a total
transaction value of $6.0 billion, or approximately 10x then-estimated 2006 adjusted EBITDA.
The transaction was funded with $4.2 billion of debt (7x leverage) and $1.7 billion of sponsor
equity; to-date, neither Bain nor Blackstone has taken a dividend.
Authored by Ronald Rich
2. COMPANY OVERVIEW
With fiscal 2007 (ended 2/2/08) net sales of $3.9 billion and adjusted EBITDA of $563 million,
Michaels is the largest arts and crafts specialty retailer in North America. Operating 1,129 retail
stores in the U.S. and Canada, Michaels has increased its store base by 225 stores over the past
five years and has posted a net sales and adjusted EBITDA CAGR of 6.2% and 10.0%,
respectively, over the same period. Michaels competes across many industries, including floral,
fine art, general and kids crafts, scrapbooking and paper crafting, home décor, jewelry &
beading, candles, photo frames, and custom framing.
MICHAELS STORES
1,200
600
1,100
500
1,000
400
No. Stores
Dollars
900
300
800
200
100 700
- 600
2000 2001 2002 2003 2004 2005 2006 (a) 2007
Adjusted EBITDA Total No. Stores
HISTORICAL ANNUAL FINANCIALS
$ in millions 2000 2001 2002 2003 2004 2005 2006 (a) 2007
Net Sales $ 2,249 $ 2,531 $ 2,856 $ 3,091 $ 3,393 $ 3,676 $ 3,843 $ 3,862
Cost of Sales 1,345 1,488 1,598 1,732 1,900 2,037 2,086 2,089
Occupancy Expense 150 173 206 225 244 263 278 294
Gross Profit 755 870 1,052 1,134 1,250 1,376 1,479 1,479
Adjusted EBITDA (b) $ 214 $ 257 $ 349 $ 387 $ 432 $ 511 $ 599 $ 563
Same Store Sales, Y/Y 5.0% 5.0% 4.2% 2.5% 4.7% 3.6% 0.3% -0.7%
Merchandise Margin 40.2% 41.2% 44.1% 44.0% 44.0% 44.6% 45.7% 45.9%
Gross Margin 33.6% 34.4% 36.8% 36.7% 36.8% 37.4% 38.5% 38.3%
Adjusted EBITDA Margin 9.5% 10.2% 12.2% 12.5% 12.7% 13.9% 15.6% 14.6%
(a) Fiscal 2006 contains 53 weeks.
(b) Adjusted EBITDA contains addbacks for share-based comp (FY05 forward), transaction fees, non-recurring professional fees, and sponsor fees.
Source: Company filings and NYLIM estimates.
The Company operates two principal retail formats: Michaels Stores and Aaron Brothers;
Michaels recently discontinued its Recollections and Star Decorators concepts, which had totaled
8 stores.
Michaels Stores is the leading arts and crafts retail chain in North America, with 963 locations
throughout 48 states and in Canada. Michaels offers a broad selection of arts, crafts, framing,
2
3. floral, wall decor, and seasonal merchandise, as well as on-site education and advice for the
crafter and do-it-yourself home decorator. Its merchandising strategy is to provide the broadest
selection of arts and crafts products in a convenient location with an appealing store
environment. Each store has an average of 18,500 square feet of selling space and carries, on
average, over 42,000 basic SKUs. The Company’s broad product offering, combined with
friendly and knowledgeable sales associates, educational in-store events, and project sheets and
displays, provides customers with a one-stop shopping experience that supports and encourages
their creativity. According to commissioned surveys of Michaels’ customers, the Company’s
average customer purchases an average of over 6 items per transaction, spends approximately
$22 per visit, and shops for crafts supplies at least twice a month, with approximately half of
their visits to Michaels.
Aaron Brothers is the Company’s specialty framing supplies and services retail store, offering an
extensive assortment of ready-made frames and mats for the do-it-yourselfer, quality art supplies
for the student and professional, and top-of-the-line, custom framing services. The Company
operates 166 Aaron Brothers stores located across 11 states, which is consistent with Aaron’s
store count over the past few years. Aaron Brothers stores have an average of 5,600 square feet
of selling space and carry nearly 6,500 basic SKUs.
3
4. INDUSTRY OVERVIEW
Michaels competes in the large and growing U.S. and Canadian arts and crafts industry. The arts
and crafts market broadly includes a diverse set of categories, including general crafts
(scrapbooking, beading, jewelry making, rubber stamping), needle crafts (cross stitching,
crocheting, knitting, home décor sewing), painting/ finishing (home décor painting, art and
drawing, stenciling, decorative painting) and floral crafts (floral arranging, wreath making).
Crafting is one of the leading leisure activities in the U.S., enjoying broad participation within
58% of all U.S. households, according to the Craft and Hobby Association (“CHA”). This high
level of household participation is driven by the low cost per hour of entertainment and the
lasting value that crafting projects offer relative to other entertainment alternatives.
Floral Crafts
10%
General Crafts
Painting & 41%
Finishing Crafts
24%
Needle & Sewing
Crafts
25%
There appears to be a muted correlation between arts and crafts market growth and broader
macroeconomic trends, such as GDP growth, interest rates, unemployment rates, and changes in
relative purchasing power. According to the CHA, the U.S. arts and crafts market generated
approximately $31.8 billion in sales in 2007, a 7.6% increase from 2006; since the CHA began
tracking this data, there has not been an annual decline in any year, including during the 2001
recession when the industry grew by 11.3%. This consistent market growth is driven by
population growth and household participation growth, as well as an increase in annual spending
per household. In addition to the core arts and crafts market, Michaels’ addressable market
includes the $8 billion framing market, bringing the total estimated addressable market for the
Company to $40 billion. According to Bain & Company, the overall U.S. arts and crafts industry
is forecasted to grow at a rate of 2.6% per annum between 2005 and 2011. This growth is
expected to be driven by a 1.1% increase in the number of households, a 1.5% increase in
average annual expenditure, and flat participation rates.
The arts and crafts market is composed of avid and loyal consumers, which creates a relatively
stable market dynamic. According to surveys published by CHA, the average arts and crafts
customer typically purchases 5-10 items for a given project and shops for crafts supplies at least
twice a month. The most enthusiastic customers (those who spend more than 9 hours per week
on arts and crafts) comprise 12% of crafting households and account for 25% of all craft sales.
4
5. Competition
The crafts market is
served by specialty chain
stores, mass merchants,
department stores,
discount retailers and
independent “mom and
pop” stores. Discount
stores and craft chain
stores account for the
largest share of craft
purchases, followed by
fabric & craft stores.
Discount stores have the
highest loyalty rate, a result of convenience and price. Crafters are also loyal to craft chain
stores, due primarily to the broad merchandise selection. Retail arts and crafts sales are highly
fragmented, with the top four arts and crafts retailers
comprising approximately 21% of the market
(including framing). Michaels, the industry leader,
commands 10% of the industry, with nearly twice as
much in sales as its nearest competitor. The
remaining 80+% is sold through a variety of retail
channels including smaller local chains and indirect
competitors. Of the five major arts and crafts retailers,
only four (Michaels, Jo-Ann Stores, Hobby Lobby,
and A.C. Moore) have annual sales in excess of $500
million, two of which do not have a national presence
(Hobby Lobby and A.C. Moore). In addition to
As of 2006.
Source: Craft & Hobby Association
having leading market share, Michaels also generates
considerably higher EBITDA margin, approximately
three times that of Jo-Ann Stores.
COMPETITOR METRICS
Hobby
$ in millions Michaels Jo-Ann Lobby AC Moore
No. Stores 1,129 774 389 133
Market Share 10% 5% 4% 1%
Same Store Sales Growth -0.7% 3.7% NA -10.3%
Net Sales $ 3,862 $ 1,879 NA $ 560
Adjusted EBITDA $ 563 $ 89 NA $ 20
Adjusted EBITDA Margin 14.6% 4.7% NA 3.6%
EV/Adjusted EBITDA Private 5.3x Private 7.0x
Source: Company filings and NYLIM estimates.
5
6. RECENT FINANCIAL PERFORMANCE
Financial performance for the fourth fiscal quarter ended February 2, 2008, was lower than
expected. Company sales are seasonal, with nearly 35% of annual sales occurring in the fourth
quarter due to holiday-associated sales. Quarterly same store sales declined 3.4% Y/Y in 4Q07,
driven primarily by lower sales and pricing in the Christmas décor and home accents
departments. Gross margin, which includes occupancy expense, decreased 184bps Y/Y to
40.0%, driven by a decrease in merchandise margin and associated lower overhead absorption;
merchandise margin declined 128bps Y/Y to 45.7% as a greater portion of seasonal and higher
ticket items was sold on clearance and markdown. NYLIM-calculated adjusted EBITDA for
4Q07 declined 9% Y/Y to $259 million from $284 million in 4Q06 (as adjusted from $304
million for the 53rd week in fiscal 2006 for comparability) with adjusted EBITDA margin of
19.9%, down 190bps from 21.8% in the prior year (as adjusted from 22.3% for the 53rd week).
Adjusted EBITDA for fiscal 2007 was $563 million, down $10 million from $573 million in
fiscal 2006 (as adjusted from $599 million for the 53rd week).
As of February 2, 2008, we estimate that Michaels had liquidity of $606 million, comprised of
$29 million of cash and $577 million of revolver availability; additionally, Michaels generated
$268 million of cash from operations in fiscal 2007.
QUARTERLY HISTORICAL FINANCIALS
$ in millions 1Q06 2Q06 3Q06 4Q06 (a) 1Q07 2Q07 3Q07 4Q07
Net Sales $ 832 $ 768 $ 896 $ 1,361 $ 844 $ 793 $ 940 $ 1,301
Cost of Sales 444 423 506 722 444 429 521 706
Occupancy Expense 69 70 70 70 72 73 74 75
Gross Profit 319 275 319 569 328 291 345 520
Adjusted EBITDA (b) $ 118 $ 77 $ 98 $ 304 $ 104 $ 81 $ 118 $ 259
LTM Adjusted EBITDA - - - 599 583 586 606 563
Same Store Sales, Y/Y -3.0% -0.3% 3.3% 0.8% -0.5% 0.8% 1.9% -3.4%
Merchandise Margin 46.7% 44.9% 43.5% 47.0% 47.4% 46.0% 44.6% 45.7%
Gross Margin 38.3% 35.8% 35.6% 41.8% 38.8% 36.7% 36.7% 40.0%
Adjusted EBITDA Margin 14.1% 10.0% 10.9% 22.3% 12.3% 10.2% 12.6% 19.9%
LTM Adj. EBITDA Margin - - - 15.5% 15.1% 15.0% 15.4% 14.6%
Net Leverage Ratio - - - 6.6x 6.9x 6.9x 6.8x 6.8x
Interest Coverage Ratio - - - 5.7x 2.9x 2.0x 1.6x 1.5x
Net Leverage, rent-adj. - - - 7.0x 7.3x 7.3x 7.2x 7.2x
Interest Coverage, rent-adj. - - - 3.0x 2.2x 1.8x 1.5x 1.5x
(a) 4Q06 contains 14 weeks.
(b) Adjusted EBITDA contains addbacks for share-based comp, transaction fees, non-recurring professional fees, and sponsor fees.
Source: Company filings and NYLIM estimates.
FINANCIAL PROJECTIONS
While we project that Michaels will post lower Y/Y EBITDA in fiscal 2008, driven by a
consumer-challenged environment, we expect the Company to perform relatively well through
the current economic recession. Though Company management predicts a 2H08 economic
recovery, our base case assumes that the current consumer malaise continues through the second
half of the year. As a result, we expect that same store sales will decline Y/Y, gross margins will
degrade as lower sales volumes drive lower overhead absorption, SG&A will increase on a per
6
7. store basis in-line with inflation, resulting in lower EBITDA margin; partially offsetting the
lower EBITDA margin, will be EBITDA generated by Michaels’ new store openings.
Given our key drivers, we project fiscal 2008 adjusted EBITDA of $544 million, down $19
million Y/Y, with associated cash flow from operations of $248 million; cash flow in fiscal 2008
should benefit from declining LIBOR by approximately $75 million (Michaels has not swapped
its floating rate exposure). Quarterly projections are exhibited in the Appendix.
BASE CASE FINANCIAL PROJECTIONS
$ in millions 2007A 2008 2009
KEY DRIVERS
Same Store Sales -0.7% -1.1% 0.0%
Net Sales, Y/Y (a) 2.1% 3.3% 3.9%
Merchandise Margin, bps Y/Y 20 27 50
Gross Margin, bps Y/Y (19) 9 37
Adjusted EBITDA Margin 14.6% 13.6% 13.5%
PROJECTED INCOME STATEMENT
Net Sales $ 3,862 $ 3,988 $ 4,147
Cost of Sales 2,089 2,146 2,211
Occupancy Expense 294 311 329
Gross Profit 1,479 1,531 1,607
SG&A 1,051 1,108 1,174
Related Party Expenses 17 24 25
Store Pre-Opening Costs 6 6 7
Operating Income 405 393 401
Depreciation 125 128 135
Other Addbacks 33 23 23
Adjusted EBITDA (b) $ 563 $ 544 $ 559
PROJECTED CASH FLOW
Adjusted EBITDA $ 563 $ 544 $ 559
Cash Taxes (11) (42) (55)
Cash Interest (288) (238) (218)
Change in Working Capital 52 (2) (5)
Sponsor Fees (14) (14) (14)
Other (35) - -
CASH FROM OPERATIONS 268 248 267
Capital Expenditures (100) (120) (120)
Term Loan Amortization (24) (24) (24)
Revolver Draw / (Repayment) (110) (97) -
Other (35) - -
NET CHANGE IN CASH $ (1) $ 8 $ 124
Beginning Cash Balance 30 29 37
Ending Cash Balance 29 37 161
LIQUIDITY
Cash $ 29 $ 37 $ 161
Revolver Availability 577 692 697
Total 606 730 858
CREDIT METRICS
Net Leverage 6.8x 6.9x 6.5x
Interest Coverage 1.5x 2.0x 2.1x
Net Leverage, rent-adjusted 7.2x 7.3x 7.1x
Interest Coverage, rent-adj. 1.5x 1.8x 1.8x
(a) 2007 Y/Y change has been adjusted to account for the 53rd week in fiscal 2006.
(b) Adjusted EBITDA contains addbacks for share-based comp, transaction fees,
non-recurring professional fees, and sponsor fees.
Source: Company filings and NYLIM estimates.
7
8. The sensitivity table below shows the resulting 2008 projected adjusted EBITDA given varying
levels for the change in same store sales and merchandise margin. The small box marks our base
case scenario.
2008 PROJECTED ADJUSTED EBITDA
Same Store Sales Y/Y
544 1% 0% -1% -2% -3% -4% -5%
75 600 581 563 544 525 506 487
50 590 571 553 534 515 497 478
Merchandise 25 580 561 543 524 506 487 468
Margin - 570 551 533 514 496 477 459
bps Y/Y (25) 560 541 523 504 486 468 449
(50) 549 531 513 494 476 458 440
(75) 539 521 503 485 466 448 430
(100) 529 511 493 475 457 439 420
(125) 519 501 483 465 447 429 411
Source: NYLIM estimates.
INVESTMENT THESIS
While it is unlikely that Michaels Stores is immune to the effects of a consumer-led recession,
we believe that the Company will be able to weather the current economic downturn better than
most retailers. With a history of growth and margin improvement, Michaels enters this down-
cycle with high leverage and strong cash flow. While we anticipate that near-term EBITDA will
suffer on a Y/Y basis, we expect the Company to continue to maintain its market-leading
position, grow its store base, produce positive cash flow, build liquidity and deleverage its
balance sheet.
Market Leader
Michaels Stores is the largest national arts and crafts specialty retailer within the estimated $40
billion U.S. arts and crafts and framing market, with an estimated 10% market share. Michaels’
market share is roughly twice that of its largest direct competitor, while none of its key
competitors possess the broad geographic footprint of its store base. The Company plans to open
an additional 45 Michaels Stores in the first three quarters of fiscal 2008, driving incremental
EBITDA. Additionally, Michaels EBITDA margin at 14.6% is 3.1x that of Jo-Ann Stores and
4.6x that of A.C. Moore.
Recession Resistant
Unlike most retailers, Michaels’ sales have historically been relatively unaffected by economic
downturns. During recessionary times, consumers have tended to allocate leisure spending
toward relatively inexpensive and long-lasting forms of entertainment, such as crafting. During
the two previous economic downturns, Michaels continued to report positive comparable store
sales growth, specifically 9.1% in 1990, 9.1% in 1991, 4.6% in 2001 and 4.2% in 2002. We
believe that the current cycle will be less forgiving to Michaels’ performance, given slowing
category growth, and that the Company will likely experience moderate declining same store
sales during the current downturn.
8
9. Long-Term Margin Improvement
Michaels management has targeted long-term EBITDA margin of 24%, almost 1,000 bps above
fiscal 2007 levels, and expects to achieve 25% of it over the next three to five years. This
translates to approximately 50 – 75 bps of margin improvement per year.
Product Sourcing - Michaels currently sources less than 10% of its products directly
from international manufacturers, providing the Company with the long-term opportunity
to enhance margin, decrease supply-chain costs and realize overall lower product costs.
Michaels plans to increase the percentage of its less complex products that it sources
directly from international manufacturers, thereby disintermediating the domestic
distributor. The Company has started to take steps to achieve this initiative with the
hiring of a consulting firm, the category-by-category review of its sourcing opportunities,
and the formation of a strategic sourcing team that is headed by a new senior vice
president who comes from Office Depot with over 20 years of experience in global
sourcing.
Hybrid Distribution Network - Michaels expects to improve margin by reducing costs
associated with drop-shipping products directly to store locations. Management is in the
process of shifting to a hybrid distribution model. Under this model, the Company
estimates that approximately 85% to 95% of its inventory will be shipped from the
vendor to a distribution center; Michaels currently has eight distribution centers across
the country. Management expects to complete the transition to the hybrid model in fiscal
2008.
Continued Cash Generation
We project that liquidity will improve $124 million and $128 million Y/Y to $730 million and
$858 million in fiscal 2008 and 2009, respectively, from an estimated $606 million at the end of
fiscal 2007. Net leverage is projected to increase to 6.9x in fiscal 2008 from 6.8x in the prior
year, and decline to 6.5x by the end of fiscal 2009; using S&P guidance, projected credit metrics
should not result in a ratings change.
Potential for Continued Growth
Michaels plans to continue to open new stores and remodel/relocate existing stores. The
Company has a proven track record of successful new store expansion. Consequently, Michaels’
growth capital spending has resulted in over 99% of the Company’s fully-ramped store base
having positive store-level EBIT. New stores exhibit very attractive economics with a post-tax
cash payback period of three years. The Company plans to open approximately 45 new Michaels
stores per year, with U.S. and Canadian markets estimated to be capable of supporting
approximately 1,300 stores at current ROIC hurdles (>25%).
Enterprise Value Coverage to the Notes
In reviewing Michaels Stores’ public trading range from January 2000 through October 2006, as
provided by Capital IQ, we calculate an average EV/EBITDA multiple of 8.7x. At a more
favorable point in the cycle, a leading specialty retailer such as Michaels could garner an 8x –
10x valuation multiple; in the current environment, we believe that a 7x EV/EBITDA multiple is
more appropriate.
9
10. MICHAELS STORES HISTORIC PUBLIC VALUATION MULTIPLE
13.0x
12.0x
11.0x
10.0x
9.0x
8.0x
7.0x
6.0x
5.0x
4.0x
00
00
01
01
02
02
03
03
04
04
05
05
06
06
1Q
3Q
1Q
3Q
1Q
3Q
1Q
3Q
1Q
3Q
1Q
3Q
1Q
3Q
Qtr Avg EV / EBITDA Multiple
Source: Capital IQ
PUBLIC SPECIALTY RETAIL COMPARABLES
Sally Jo-Ann
$ in millions Michaels Beauty AC Moore Stores
Ticker Private SBH ACMR JAS
EV/Adjusted EBITDA Private 9.9x 7.0x 5.3x
Net Sales $ 3,862 $ 2,540 $ 560 $ 1,879
EBITDA Margin 14.6% 12.6% 3.6% 4.7%
Net Leverage 6.8x 5.5x NM 1.8x
Interest Coverage 1.5x 2.1x 11.2x 7.0x
Source: Company filings, Capital IQ and NYLIM estimates.
Applying a 7x multiple to our projected fiscal 2008 adjusted EBITDA of $544 million, we find
the Senior Sub Notes value covered 2.1x [EV ($544MM x 7) plus cash ($39MM) less senior debt
($3.0BN) / Sr. Sub. Notes ($400MM)]. The chart below delineates sensitivities to our base case
assumptions.
2008 SENIOR SUB NOTE VALUE COVERAGE
2008 Projected Adjusted EBITDA
$ 600 $ 575 $ 550 $ 525 $ 500 $ 475 $ 450
8.0x 448% 398% 348% 298% 248% 198% 148%
7.5x 373% 326% 279% 232% 185% 139% 92%
EV/EBITDA 7.0x 298% 254% 210% 167% 123% 79% 35%
Multiple 6.5x 223% 182% 142% 101% 60% 20% -21%
6.0x 148% 110% 73% 35% -2% -40% -77%
5.5x 73% 39% 4% -30% -65% -99% -133%
5.0x -2% -33% -65% -96% -127% -158% -190%
Source: NYLIM estimates.
Covenant-Lite Credit Facility
Following an environment of low credit spreads, a covenant breach in today’s environment has
often led to a material re-pricing. While we may otherwise take comfort in a credit facility’s
10
11. maintenance covenants, we believe that investors in the Company’s unsecured debt are
beneficiaries of the covenant-lite bank facility credit agreement. Without the covenants,
Michael’s unsecured debt is not exposed to secured debt re-pricing and the commensurate value
drain from increased interest expense, as well as to a reduction in liquidity that could result from
a breach; in addition, given our view of Michaels’ near-term fundamentals, we do not believe
that this lack of credit protection will result in an impairment to the Notes’ credit quality.
Sponsor Involvement
Michaels Stores was purchased by Bain Capital and The Blackstone Group in October 2006 with
$1.7 billion of sponsor equity; to-date, neither private equity firm has taken capital out of the
Company. As for a near-term dividend recapitalization (market conditions aside), debt
incurrence is limited by a Fixed Charge Coverage (“FCC”) Ratio of 2.0x; this covenant, though,
does not apply to debt drawn under the revolver (estimated $577 million available) and excludes
certain carve-outs for foreign subsidiaries, capital leases and a Restricted Payments basket of $75
million, among others. By our projections, Michaels’ FCC ratio does not exceed 2.0x until 2009.
We find the sponsors’ current substantial equity investment and presence on the Board of
Directors comforting and we trust that they will leverage their resources to help management
execute its initiatives. Bain Capital has extensive retail experience, with acquisitions that have
included Toys “R” Us, Burger King, AMC Theatres, Staples, Burlington Coat Factory,
Brookstone and Domino's Pizza.
INVESTMENT RECOMMENDATION
We recommend the purchase of up to $15 million (par) of Michaels’ 11.375% Senior
Subordinated Notes at 80.00 or below, equivalent to 15.7% YTM or greater. Given our view of
Michael’s performance through the current down-cycle, we believe that a 15.7% yield is
adequate compensation for our perceived risks. Even in an environment that will likely lead to
declining same store sales and degrading margin, Michaels should continue to generate positive
cash flow and pay down debt; additionally, at no point during our projection period do we expect
the Notes to be value impaired. While we do not foresee a positive near-term catalyst, we would
expect accelerated principal appreciation when the consumer cycle turns, driving positive Y/Y
comps, valuation multiple expansion and spread tightening.
11.375% SENIOR SUB NOTE IRR
Base Case Sensitivity Analysis
Exit Price
100.00 90.00 80.00 70.00 60.00
Year 2009 28% 22% 15% 7% 0%
2010 23% 19% 15% 10% 6%
2011 20% 17% 15% 12% 9%
* Assumes entry price of 80.00.
Source: NYLIM estimates.
11
12. Strengths
· Market leader, category killer
· Recession resistant, historically
· Relatively strong margins with opportunity for improvement
· Opportunity for growth, highly fragmented market
· Continued cash and liquidity generation through downturn in economic cycle
· Strong sponsor oversight and involvement
· Covenant-lite credit facility provides flexibility
Weaknesses
· Consumer will be affected by recession
· Near-term financial performance will likely be down Y/Y
· Recent management changes that include the hiring of the current CEO, Brian Cornell, and the
resigning of the COO and CFO, both of whom had also held the title of Co-President.
· High leverage
· Re-pricing risk to Notes
12
14. MANAGEMENT TEAM
Brian Cornell, Chief Executive Officer. On June 4, 2007, Michaels Stores announced that
Brian Cornell was named the new Chief Executive Officer of the company. Brian Cornell
recently served as Executive Vice President and Chief Marketing Officer of Safeway, Inc., where
he was responsible for the merchandising, marketing, manufacturing, supply chain, and online
business. Prior to joining Safeway in 2004, he was President of Pepsi-Cola North America’s
Foodservice Division and SVP of Sales for Pepsi-Cola North America. He also held other
management roles at Pepsi and Tropicana Product International. He is a director of Home Depot
and was one of OfficeMax Inc.
Thomas M. Bazzone, Executive Vice President – Specialty Businesses. Mr. Bazzone was
promoted to Executive Vice President–Specialty Businesses in March 2006. Prior to his
promotion, he served as President of the Recollections and Star Decorators Wholesale businesses
since May 2004. He came to Michaels from Restoration Hardware where he was Executive Vice
President, Chief Operating Officer and Director from July 2001 to December 2003. Previously,
he was with Red Envelope, where he held the position of President and Chief Operating Officer
from July 1999 to July 2001. Mr. Bazzone also held executive positions with Williams-Sonoma
from May 1995 through January 1997.
Thomas C. DeCaro, Executive Vice President – Supply Chain. Mr. DeCaro became
Executive Vice President–Supply Chain in June 2005. Prior to this, Mr. DeCaro had served as
Senior Vice President–Inventory Management since joining the Company in August 2000. From
1998 until joining Michaels, he was Vice President–Merchandise for Disneyland Resort. Prior to
this, he held the position of Senior Vice President–Merchandise Planning and Allocation for
Kohl’s Department Stores from February 1996 to April 1998. In addition, Mr. DeCaro has held
various positions in Merchandise Planning and Allocation and Finance for The Disney Store,
The Limited Stores, May Department Stores, and Sanger Harris Department Stores.
Harvey S. Kanter, Executive Vice President – Chief Merchant. Mr. Kanter was promoted to
Executive Vice President–Chief Merchant in March 2006. Prior to his promotion, he served as
President of Aaron Brothers, a subsidiary of Michaels, since April 2003. From 1995 until joining
the Company, Mr. Kanter held various positions with Eddie Bauer, Inc. From 2002 until 2003,
he was Managing Director of the Home and Non-Apparel divisions and from 1998 until 2002, he
was Managing Director of the Home division.
Lisa Klinger, SVP and Acting CFO. Lisa K. Klinger serves as Acting Chief Financial Officer;
the former CFO and President, Jeff Boyer, resigned effective April 4, 2008. Ms. Klinger joined
the Company in June 2005 as Vice President - Treasurer, and had served as Senior Vice
President - Finance and Treasurer, a position held since February 2007. During her tenure, she
assisted in the go-private transaction and ensuing debt issuance and has led the consolidated
Finance organization including Treasury, Investor Relations, Corporate Finance, Merchandise &
Marketing Finance, Store Planning & Analysis, Supply Chain Finance and Non-Merchandise
Procurement.
14
15. BOARD OF DIRECTORS
Joshua Bekenstein. Mr. Bekenstein is a Managing Director at Bain Capital Private Equity and
Bain Capital, LLC. He co-founded the firm in 1984 and has been a Managing Director of the
firm since 1986. Prior to Bain, Mr. Bekenstein was a Consultant at Bain & Company, where he
worked on strategic consulting projects for a number of Fortune 500 clients. Mr. Bekenstein has
been a Director at Sealy Corp. since December 1997 and also serves as a Director at KB Toys
Inc. He has been a Director of Specialty Retailers Inc. since December 1988 and is a Member of
its Compensation Committee and served as its Vice Chairman and Chief Financial Officer from
May 1992 to March 1996.
Michael Chae. Mr. Chae is a Senior Managing Director at The Blackstone Group, Private
Equity Group. Since joining Blackstone in 1997, he has been involved in the execution of
Blackstone’s investments in Centennial Communications, Crowley Digital (Salmon PCS),
Extended Stay America, PaeTec Communications, iPCS, Michael’s Stores, The Nielsen
Companies (formerly VNU), and Universo Online and in acquisitions by American Axle &
Manufacturing and the reorganization of Transtar. Mr. Chae focuses on investments in the media
and communications, and retail sectors.
Todd Cook. Mr. Cook is a Principal at Bain Capital Private Equity and Bain Capital, LLC. Mr.
Cook joined the firm in 1996. Previously, he was a Consultant at Bain & Company.
Matthew Kabaker. Mr. Kabaker is a Principal at The Blackstone Group, Private Equity Group.
Since joining the firm, Mr. Kabaker has been involved in Blackstone’s investments in Republic
Technologies, Ritvik Toys, LiveWire Ventures, the London International Financial Futures &
Options Exchange (LIFFE), Aspen Insurance, Ariel Insurance, Healthmarkets, TRW
Automotive, Financial Guaranty Insurance Company (FGIC), and Sungard. He currently serves
on the board of directors of Ariel Insurance, TRW Automotive, FGIC, and Healthmarkets.
Lewis Klessel. Lewis Klessel serves as Executive Vice President, private equity portfolio
practice of Bain Capital Partners. Prior to joining Bain Capital Partners, Mr. Klessel held a
variety of operating and strategy leadership positions from 1997 to 2005 at The Home Depot,
Inc., as President of Maintenance Warehouse, a wholly-owned subsidiary that distributed
maintenance products to facility management customers in the multi-housing, lodging, health-
care and commercial sectors. Mr. Klessel has been Director of Michaels Stores Inc. since 2006.
Matthew Levin. Mr. Levin is a Managing Director at Bain Capital Private Equity and Bain
Capital, LLC. He joined the firm in 1992 and became a Managing Director in 2000. Previously,
Mr. Levin was a Consultant at Bain & Company Inc. from 1988 to 1991, where he consulted in
the consumer products and manufacturing industries. He was a Director at Nutraceutical
International Corp. since December 1996 and also from its inception to January 1995.
David McVeigh. Mr. McVeigh is an Executive Director at The Blackstone Group, Private
Equity Group since 2006. He brings additional expertise to the firm's growing portfolio
management team in monitoring and advising on strategy and operational performance of
Blackstone's increasingly high-profile and international group of portfolio companies. Prior to
15
16. joining Blackstone Mr. McVeigh was a Partner with McKinsey and Company as well as a leader
of the North American Chemicals and Northeast Energy and Materials practices.
James Quella. Mr. Quella is a Senior Managing Director and Senior Operating Partner at The
Blackstone Group, Private Equity Group. Mr. Quella is responsible for monitoring the strategy
and operational performance of Blackstone portfolio companies and providing direct assistance
in the oversight of large investments. He is also a member of the firm’s Private Equity
Investment Committee. Prior to joining Blackstone in 2004, Mr. Quella was a Managing Director
and Senior Operating Partner with DLJ Merchant Banking Partners-CSFB Private Equity since
July 2000 when CSFB merged with DLJ. In October 1992, he founded the Financial Services
Practice Group and also managed it until December 1995.
SPONSORS
Bain Capital. Established in 1984, Bain Capital is one of the world's leading private investment
firms whose affiliates manage over $50 billion in assets. The investment activities of Bain
Capital's affiliates include private equity & venture capital as well as long/short public equity,
credit products and global macro hedge funds. Since its inception in 1984, Bain Capital has
completed over 240 equity investments. Bain is an active investor in the Retail and Consumer
Products industry, having invested in over 45 companies, focusing on segments that include
traditional retailers, on-line merchandising, consumer products, food and restaurants, and
consumer services. Among others, acquisitions have included Toys “R” Us, Burger King, AMC
Theatres, Staples, Burlington Coat Factory, Brookstone and Domino's Pizza.
The Blackstone Group. Established in 1987, Blackstone is a leader in private equity investing,
having managed five general private equity funds, as well as one specialized fund focusing on
media and communications-related investments. It pursues transactions throughout the world,
including not only typical leveraged buyout acquisitions of seasoned companies but also
transactions involving start-up businesses in established industries, turnarounds, minority
investments, corporate partnerships and industry consolidations.
16