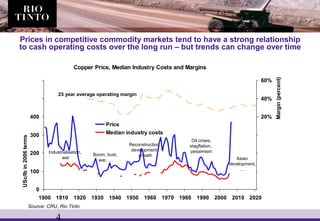
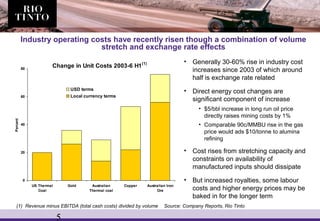
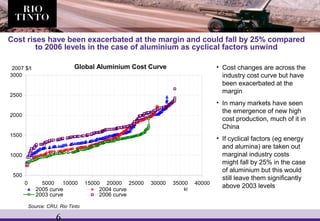
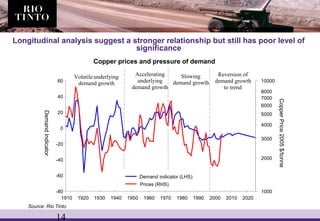
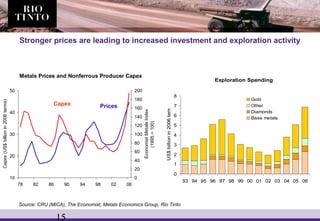
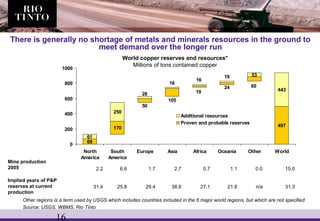
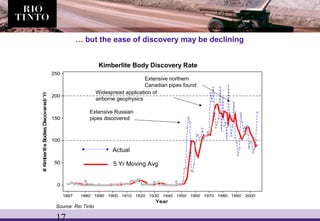
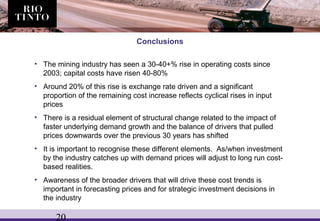
Mining Industry Costs and Prices:
A Long Run Perspective
Neal Brewster
General Manager Forecasting, Rio Tinto
MEMS, Bolder, Co
19th
April 2007
2
For the purposes of the Forward-Looking Statements Safe Harbor
provisions of the US securities laws
This presentation contains statements which constitute forward-looking statements within the meaning of the US
securities laws. Such statements include, but are not limited to, statements with regard to capacity, future production
and grades, projections for sales growth, estimated revenues and reserves, targets for cost savings, the construction
cost of new projects, projected capital expenditures, the timing of new projects, future cash flow and debt levels, the
outlook for minerals and metals prices, the outlook for economic recovery and trends in the trading environment and may
be (but are not necessarily) identified by the use of phrases such as “will”, “expect”, “anticipate”, “believe” and “envisage”.
By their nature, forward-looking statements involve risk and uncertainty because they relate to events and depend on
circumstances that will occur in the future and may be outside Rio Tinto’s control. Actual results and developments may
differ materially from those expressed or implied in such statements because of a number of factors, including levels of
demand and market prices, the ability to produce and transport products profitably, the impact of foreign currency
exchange rates on market prices and operating costs, operational problems, political uncertainty and economic
conditions in relevant areas of the world, the actions of competitors, activities by governmental authorities such as
changes in taxation or regulation and those factors set out under Risk Factors in Rio Tinto’s Annual Report on Form 20-F
for the year ended 31 December 2004 filed with the U.S. Securities and Exchange Commission.
Outline
• Recent industry cost escalation
• Long run cost and price relationships
4
Prices in competitive commodity markets tend to have a strong relationship
to cash operating costs over the long run – but trends can change over time
Copper Price, Median Industry Costs and Margins
0
100
200
300
400
500
600
1900 1910 1920 1930 1940 1950 1960 1970 1980 1990 2000 2010 2020
USc/lbin2006terms
-60%
-40%
-20%
0%
20%
40%
60%
Margin(percent)
Price
Median industry costs
25 year average operating margin
Source: CRU, Rio Tinto
Industrialisation,
war
Boom, bust,
war, …
Reconstruction,
development,
growth
Oil crises,
stagflation,
pessimism
Asian
development,
…
5
Change in Unit Costs 2003-6 H1(1)
0
20
40
60
80
US Thermal
Coal
Gold Australian
Thermal coal
Copper Australian Iron
Ore
Percent
USD terms
Local currency terms
(1) Revenue minus EBITDA (total cash costs) divided by volume Source: Company Reports, Rio Tinto
• Generally 30-60% rise in industry cost
increases since 2003 of which around
half is exchange rate related
• Direct energy cost changes are
significant component of increase
• $5/bbl increase in long run oil price
directly raises mining costs by 1%
• Comparable 90c/MMBU rise in the gas
price would ads $10/tonne to alumina
refining
• Cost rises from stretching capacity and
constraints on availability of
manufactured inputs should dissipate
• But increased royalties, some labour
costs and higher energy prices may be
baked in for the longer term
Industry operating costs have recently risen though a combination of volume
stretch and exchange rate effects
6
Cost rises have been exacerbated at the margin and could fall by 25% compared
to 2006 levels in the case of aluminium as cyclical factors unwind
• Cost changes are across the
industry cost curve but have
been exacerbated at the
margin
• In many markets have seen
the emergence of new high
cost production, much of it in
China
• If cyclical factors (eg energy
and alumina) are taken out
marginal industry costs
might fall by 25% in the case
of aluminium but this would
still leave them significantly
above 2003 levels
Source: CRU, Rio Tinto
Global cost curves
500
1000
1500
2000
2500
3000
0 5000 10000 15000 20000 25000 30000 35000 40000
2005 curve 2004 curve
2003 curve 2006 curve
2007 $/t
kt
Global Aluminium Cost Curve
7
The capital intensity of developing projects has increased by even more than
operating costs due to a combination of higher input costs and more complexity
• Capital spending by nonferrous producers in 2006 was US$45 billion, almost
double 2002 levels in real terms
• Analysis of capital cost escalation difficult as projects vary and it region specific
but generally observe a 40-80% in capex costs since 2003 due to:
– Raw material costs (concrete, steel, etc.) (+85% 2003-6)
– Labour rates (Australian “all-in” rate rose 64% between 2002-6)
– Capital equipment (+50% for certain types over 2 years)
– Exchange rates (20-30%)
– Project delays
• Shift to more complex greenfield projects (eg Pilbara iron ore expansions now
require increased port, rail and other infrastructure upgrades)
• Some costs have scope to unwind but others are more permanent (eg a recent
Australian study estimated that the number of employees in the major Australian
mining sectors will rise from 92,000 in 2005 to 162,00 in 2015)
8
Item Normal lead time Current
(months) (months)
Grinding mills 20 44
Draglines 18 36
Barges 24 32
Locomotives 12 26
Power generators 12 24
Wagons 12 24
Rope shovels 9 24
Reclaimers 18 24
Tyres 0-6 24
Large haul trucks 0-6 24
Crushers 16 24
Ship loaders 8 22
Acute shortages are constraining the supply side and leading to supply disruptions
Source: Hatch, Rio Tinto
9
Need to think about multiple events as underpinning the development of
industry costs and thereby prices beyond short run cycles
Real Molybdenum Price
1900 1920 1940 1960 1980 2000
$/tonne(2005terms)
30
50
80
150
200
300
500
800
1500
100
1000
Strong
military use
Sub by nickel
and tungsten
Floatation
process
developed Persistent weak demand,
price affected substitution,
rising mine stocks
General inflation,
oil pipe demand,
falling by-product output
New uses,
new mines,
govt stockpiling
Rising
by-production
Fast supply growth
(Climax) matches
rising demand
Wartime price
controls
Lack of
civilian uses
Over-capacity,
industry mergers
Mine disruptions,
restricted Chinese
exports
Move from US producer pricing to traded global market
1. Capital and resource
drivers
2. Productivity and
input cost drivers
3. Technological
developments
4. Demand drivers
5. Competition and
regulation
6. Macroeconomic
relationships
Source: Rio Tinto
10
Can rationalise these cost and price drivers into their influence two
key components
• Real resource pressure
– This depends on the rate of underlying demand growth in relation to the current
availability, future discovery and ability to economically develop resources
– Can have a strong technical element
– Also depends on willingness or ability of companies to invest in new supply so can be
influenced by industry consolidation and industry barriers to entry
• (Relative) productivity
– The ability of the mining industry to achieve improvements in its operating performance
and to deliver cost savings or for costs to rise
– Relative cost issue that depends on productive efficiency of the mining sector and its
supplier markets (and the strength of conflicting drivers) and similar trends in other
sectors of the economy
11
Productivity and input cost drivers were the dominant force behind falling price
trends between 1979 and 2002
• Increased mine size and economies of scale
• Improved and lower cost inputs
• Labour flexibility and better management
• Transport costs
• Labour rates
• Work intensity (strip ratio, haul distances, etc.)
• HS&E costs
• Changing grades
• Energy costs
Share of Copper Produced by Size of Mine
(Size ranked by ore milled)
1971 1976 1981 1986 1991 1996 2001
0%
20%
40%
60%
80%
100%
0%
20%
40%
60%
80%
100%
f
under 1mtpy
1-2Mtpy
2-10Mtpy 10-30Mtpy
over 30Mtpy
Hamersley
(Costs and Lost Time (percent))
1975 1980 1985 1990 1995 2000
0
5
10
15
20
25
0
5
10
15
20
25
f
Real Aus $ cost
Lost time
Source: Rio Tinto
12
Recent focus has been on real resource pressure generated by faster
demand growth
Index of Demand (2000 = 100)
30
50
70
90
110
130
150
1970 1980 1990 2000
Aluminium
Copper
Steel
Oil
Seaborne iron ore
Trends in World Consumption (% yoy)
1990-
2000
2000-
2006
Change
Aluminium 2.8 5.9 +3.1
Copper 3.5 2.8 -0.7
Steel 1.1 5.9 +4.8
Oil 1.4 1.8 +0.5
Nickel 3.2 3.4 +0.2
Seaborne
iron ore
2.6 7.8 +5.2
Relatively poor performance of copper and nickel
reflects demand substitution (and particular effect
of dot.com recession in case of copper)
Source: WBMS, CRU, Brook Hunt, Rio Tinto
13
Cost and Price trends 1973-2005
-5.00%
-4.00%
-3.00%
-2.00%
-1.00%
0.00%
0.0% 1.0% 2.0% 3.0% 4.0% 5.0% 6.0% 7.0%
Demand trend (percent per annum)
Pricetrend(percentperannum)
Cross sectional analysis suggests a weak relationship between long run demand
and price trends
Regression has R2
of 0.23
Gold
Silver
Lead
Nickel
Steel
Seaborne iron ore
Aluminium
CopperZinc
Source: Rio Tinto Economics Department
Source: Rio Tinto
14
Copper prices and pressure of demand
1910 1920 1930 1940 1950 1960 1970 1980 1990 2000 2010 2020
DemandIndicator
-80
-60
-40
-20
0
20
40
60
CopperPrice2005$/tonne
2000
3000
4000
5000
6000
7000
8000
1000
10000
Reversion of
demand growth
to trend
Demand indicator (LHS)
Prices (RHS)
Accelerating
underlying
demand growth
Slowing
demand growth
Volatileunderlying
demand growth
Longitudinal analysis suggest a stronger relationship but still has poor level of
significance
Source: Rio Tinto
15
Exploration Spending
0
1
2
3
4
5
6
7
8
93 94 95 96 97 98 99 00 01 02 03 04 05 06
US$billionin2006terms
Gold
Other
Diamonds
Base metals
Stronger prices are leading to increased investment and exploration activity
Metals Prices and Nonferrous Producer Capex
10
20
30
40
50
78 82 86 90 94 98 02 06
Capex(US$billionin2006terms)
0
20
40
60
80
100
120
140
160
180
200
EconomistMetalsIndex
(1995=100)
Source: CRU (MICA), The Economist, Metals Economics Group, Rio Tinto
Capex Prices
16
69
170 497
61
250
53
443
6024
19
105
50
19
16
16
28
0
200
400
600
800
1000
North
America
South
America
Europe Asia Africa Oceania Other World
Additional resources
Proven and probable reserves
There is generally no shortage of metals and minerals resources in the ground to
meet demand over the longer run
World copper reserves and resources*
Millions of tons contained copper
Mine production
2005 2.2 6.6 1.7 2.7 0.7 1.1 15.00.0
Implied years of P&P
reserves at current
production
31.4 25.8 29.4 38.8 27.1 21.8 31.3n/a
Other regions is a term used by USGS which includes countries included in the 6 major world regions, but which are not specified
Source: USGS, WBMS, Rio Tinto
17
Year
#KimberliteBodiesDiscovered/Yr
20001990198019701960195019401930192019101900189018801867
250
200
150
100
50
0
… but the ease of discovery may be declining
Actual
5 Yr Moving Avg
Extensive Russian
pipes discovered
Widespread application of
airborne geophysics
Extensive northern
Canadian pipes found
Kimberlite Body Discovery Rate
Source: Rio Tinto
18
Long Term
Metals
Surplus
Long Term
Metals
Deficit
Does the need/potential for developing projects in more difficult regions
provide an opportunity or a threat?
Global metal reserves and population
Source: USGS, Rio Tinto
Note: A basket of base & ferrous metal ores, USGS reserve estimates, evaluated at 5 year historical average prices
> $60 000 per person
> $20 000 per person
> $10 000 per person
> $5 000 per person
> $2 000 per person
> $1 000 per person
Distribution of
Metals per capita
19
Possible to think of “alternative futures”
Relative productivity
Resourcepressure
Scenario 1
Resource
Shortages
Scenario 2
Persistent
price
Decline
Scenario 3
Balanced
Forces
1973-2000
1950-72
Weak relative
productivity gains
Rising effective
resource constraints
Strong relative
productivity gains
Source: Rio Tinto
Declining effective
resource constraints
20
Conclusions
• The mining industry has seen a 30-40+% rise in operating costs since
2003; capital costs have risen 40-80%
• Around 20% of this rise is exchange rate driven and a significant
proportion of the remaining cost increase reflects cyclical rises in input
prices
• There is a residual element of structural change related to the impact of
faster underlying demand growth and the balance of drivers that pulled
prices downwards over the previous 30 years has shifted
• It is important to recognise these different elements. As/when investment
by the industry catches up with demand prices will adjust to long run cost-
based realities.
• Awareness of the broader drivers that will drive these cost trends is
important in forecasting prices and for strategic investment decisions in
the industry
Mining Industry Costs and Prices:
A Long Run Perspective
Neal Brewster
General Manager Forecasting, Rio Tinto
MEMS, Bolder, Co
19th
April 2007

MEMS 200704

  • 1.
    Mining Industry Costsand Prices: A Long Run Perspective Neal Brewster General Manager Forecasting, Rio Tinto MEMS, Bolder, Co 19th April 2007
  • 2.
    2 For the purposesof the Forward-Looking Statements Safe Harbor provisions of the US securities laws This presentation contains statements which constitute forward-looking statements within the meaning of the US securities laws. Such statements include, but are not limited to, statements with regard to capacity, future production and grades, projections for sales growth, estimated revenues and reserves, targets for cost savings, the construction cost of new projects, projected capital expenditures, the timing of new projects, future cash flow and debt levels, the outlook for minerals and metals prices, the outlook for economic recovery and trends in the trading environment and may be (but are not necessarily) identified by the use of phrases such as “will”, “expect”, “anticipate”, “believe” and “envisage”. By their nature, forward-looking statements involve risk and uncertainty because they relate to events and depend on circumstances that will occur in the future and may be outside Rio Tinto’s control. Actual results and developments may differ materially from those expressed or implied in such statements because of a number of factors, including levels of demand and market prices, the ability to produce and transport products profitably, the impact of foreign currency exchange rates on market prices and operating costs, operational problems, political uncertainty and economic conditions in relevant areas of the world, the actions of competitors, activities by governmental authorities such as changes in taxation or regulation and those factors set out under Risk Factors in Rio Tinto’s Annual Report on Form 20-F for the year ended 31 December 2004 filed with the U.S. Securities and Exchange Commission.
  • 3.
    Outline • Recent industrycost escalation • Long run cost and price relationships
  • 4.
    4 Prices in competitivecommodity markets tend to have a strong relationship to cash operating costs over the long run – but trends can change over time Copper Price, Median Industry Costs and Margins 0 100 200 300 400 500 600 1900 1910 1920 1930 1940 1950 1960 1970 1980 1990 2000 2010 2020 USc/lbin2006terms -60% -40% -20% 0% 20% 40% 60% Margin(percent) Price Median industry costs 25 year average operating margin Source: CRU, Rio Tinto Industrialisation, war Boom, bust, war, … Reconstruction, development, growth Oil crises, stagflation, pessimism Asian development, …
  • 5.
    5 Change in UnitCosts 2003-6 H1(1) 0 20 40 60 80 US Thermal Coal Gold Australian Thermal coal Copper Australian Iron Ore Percent USD terms Local currency terms (1) Revenue minus EBITDA (total cash costs) divided by volume Source: Company Reports, Rio Tinto • Generally 30-60% rise in industry cost increases since 2003 of which around half is exchange rate related • Direct energy cost changes are significant component of increase • $5/bbl increase in long run oil price directly raises mining costs by 1% • Comparable 90c/MMBU rise in the gas price would ads $10/tonne to alumina refining • Cost rises from stretching capacity and constraints on availability of manufactured inputs should dissipate • But increased royalties, some labour costs and higher energy prices may be baked in for the longer term Industry operating costs have recently risen though a combination of volume stretch and exchange rate effects
  • 6.
    6 Cost rises havebeen exacerbated at the margin and could fall by 25% compared to 2006 levels in the case of aluminium as cyclical factors unwind • Cost changes are across the industry cost curve but have been exacerbated at the margin • In many markets have seen the emergence of new high cost production, much of it in China • If cyclical factors (eg energy and alumina) are taken out marginal industry costs might fall by 25% in the case of aluminium but this would still leave them significantly above 2003 levels Source: CRU, Rio Tinto Global cost curves 500 1000 1500 2000 2500 3000 0 5000 10000 15000 20000 25000 30000 35000 40000 2005 curve 2004 curve 2003 curve 2006 curve 2007 $/t kt Global Aluminium Cost Curve
  • 7.
    7 The capital intensityof developing projects has increased by even more than operating costs due to a combination of higher input costs and more complexity • Capital spending by nonferrous producers in 2006 was US$45 billion, almost double 2002 levels in real terms • Analysis of capital cost escalation difficult as projects vary and it region specific but generally observe a 40-80% in capex costs since 2003 due to: – Raw material costs (concrete, steel, etc.) (+85% 2003-6) – Labour rates (Australian “all-in” rate rose 64% between 2002-6) – Capital equipment (+50% for certain types over 2 years) – Exchange rates (20-30%) – Project delays • Shift to more complex greenfield projects (eg Pilbara iron ore expansions now require increased port, rail and other infrastructure upgrades) • Some costs have scope to unwind but others are more permanent (eg a recent Australian study estimated that the number of employees in the major Australian mining sectors will rise from 92,000 in 2005 to 162,00 in 2015)
  • 8.
    8 Item Normal leadtime Current (months) (months) Grinding mills 20 44 Draglines 18 36 Barges 24 32 Locomotives 12 26 Power generators 12 24 Wagons 12 24 Rope shovels 9 24 Reclaimers 18 24 Tyres 0-6 24 Large haul trucks 0-6 24 Crushers 16 24 Ship loaders 8 22 Acute shortages are constraining the supply side and leading to supply disruptions Source: Hatch, Rio Tinto
  • 9.
    9 Need to thinkabout multiple events as underpinning the development of industry costs and thereby prices beyond short run cycles Real Molybdenum Price 1900 1920 1940 1960 1980 2000 $/tonne(2005terms) 30 50 80 150 200 300 500 800 1500 100 1000 Strong military use Sub by nickel and tungsten Floatation process developed Persistent weak demand, price affected substitution, rising mine stocks General inflation, oil pipe demand, falling by-product output New uses, new mines, govt stockpiling Rising by-production Fast supply growth (Climax) matches rising demand Wartime price controls Lack of civilian uses Over-capacity, industry mergers Mine disruptions, restricted Chinese exports Move from US producer pricing to traded global market 1. Capital and resource drivers 2. Productivity and input cost drivers 3. Technological developments 4. Demand drivers 5. Competition and regulation 6. Macroeconomic relationships Source: Rio Tinto
  • 10.
    10 Can rationalise thesecost and price drivers into their influence two key components • Real resource pressure – This depends on the rate of underlying demand growth in relation to the current availability, future discovery and ability to economically develop resources – Can have a strong technical element – Also depends on willingness or ability of companies to invest in new supply so can be influenced by industry consolidation and industry barriers to entry • (Relative) productivity – The ability of the mining industry to achieve improvements in its operating performance and to deliver cost savings or for costs to rise – Relative cost issue that depends on productive efficiency of the mining sector and its supplier markets (and the strength of conflicting drivers) and similar trends in other sectors of the economy
  • 11.
    11 Productivity and inputcost drivers were the dominant force behind falling price trends between 1979 and 2002 • Increased mine size and economies of scale • Improved and lower cost inputs • Labour flexibility and better management • Transport costs • Labour rates • Work intensity (strip ratio, haul distances, etc.) • HS&E costs • Changing grades • Energy costs Share of Copper Produced by Size of Mine (Size ranked by ore milled) 1971 1976 1981 1986 1991 1996 2001 0% 20% 40% 60% 80% 100% 0% 20% 40% 60% 80% 100% f under 1mtpy 1-2Mtpy 2-10Mtpy 10-30Mtpy over 30Mtpy Hamersley (Costs and Lost Time (percent)) 1975 1980 1985 1990 1995 2000 0 5 10 15 20 25 0 5 10 15 20 25 f Real Aus $ cost Lost time Source: Rio Tinto
  • 12.
    12 Recent focus hasbeen on real resource pressure generated by faster demand growth Index of Demand (2000 = 100) 30 50 70 90 110 130 150 1970 1980 1990 2000 Aluminium Copper Steel Oil Seaborne iron ore Trends in World Consumption (% yoy) 1990- 2000 2000- 2006 Change Aluminium 2.8 5.9 +3.1 Copper 3.5 2.8 -0.7 Steel 1.1 5.9 +4.8 Oil 1.4 1.8 +0.5 Nickel 3.2 3.4 +0.2 Seaborne iron ore 2.6 7.8 +5.2 Relatively poor performance of copper and nickel reflects demand substitution (and particular effect of dot.com recession in case of copper) Source: WBMS, CRU, Brook Hunt, Rio Tinto
  • 13.
    13 Cost and Pricetrends 1973-2005 -5.00% -4.00% -3.00% -2.00% -1.00% 0.00% 0.0% 1.0% 2.0% 3.0% 4.0% 5.0% 6.0% 7.0% Demand trend (percent per annum) Pricetrend(percentperannum) Cross sectional analysis suggests a weak relationship between long run demand and price trends Regression has R2 of 0.23 Gold Silver Lead Nickel Steel Seaborne iron ore Aluminium CopperZinc Source: Rio Tinto Economics Department Source: Rio Tinto
  • 14.
    14 Copper prices andpressure of demand 1910 1920 1930 1940 1950 1960 1970 1980 1990 2000 2010 2020 DemandIndicator -80 -60 -40 -20 0 20 40 60 CopperPrice2005$/tonne 2000 3000 4000 5000 6000 7000 8000 1000 10000 Reversion of demand growth to trend Demand indicator (LHS) Prices (RHS) Accelerating underlying demand growth Slowing demand growth Volatileunderlying demand growth Longitudinal analysis suggest a stronger relationship but still has poor level of significance Source: Rio Tinto
  • 15.
    15 Exploration Spending 0 1 2 3 4 5 6 7 8 93 9495 96 97 98 99 00 01 02 03 04 05 06 US$billionin2006terms Gold Other Diamonds Base metals Stronger prices are leading to increased investment and exploration activity Metals Prices and Nonferrous Producer Capex 10 20 30 40 50 78 82 86 90 94 98 02 06 Capex(US$billionin2006terms) 0 20 40 60 80 100 120 140 160 180 200 EconomistMetalsIndex (1995=100) Source: CRU (MICA), The Economist, Metals Economics Group, Rio Tinto Capex Prices
  • 16.
    16 69 170 497 61 250 53 443 6024 19 105 50 19 16 16 28 0 200 400 600 800 1000 North America South America Europe AsiaAfrica Oceania Other World Additional resources Proven and probable reserves There is generally no shortage of metals and minerals resources in the ground to meet demand over the longer run World copper reserves and resources* Millions of tons contained copper Mine production 2005 2.2 6.6 1.7 2.7 0.7 1.1 15.00.0 Implied years of P&P reserves at current production 31.4 25.8 29.4 38.8 27.1 21.8 31.3n/a Other regions is a term used by USGS which includes countries included in the 6 major world regions, but which are not specified Source: USGS, WBMS, Rio Tinto
  • 17.
    17 Year #KimberliteBodiesDiscovered/Yr 20001990198019701960195019401930192019101900189018801867 250 200 150 100 50 0 … but theease of discovery may be declining Actual 5 Yr Moving Avg Extensive Russian pipes discovered Widespread application of airborne geophysics Extensive northern Canadian pipes found Kimberlite Body Discovery Rate Source: Rio Tinto
  • 18.
    18 Long Term Metals Surplus Long Term Metals Deficit Doesthe need/potential for developing projects in more difficult regions provide an opportunity or a threat? Global metal reserves and population Source: USGS, Rio Tinto Note: A basket of base & ferrous metal ores, USGS reserve estimates, evaluated at 5 year historical average prices > $60 000 per person > $20 000 per person > $10 000 per person > $5 000 per person > $2 000 per person > $1 000 per person Distribution of Metals per capita
  • 19.
    19 Possible to thinkof “alternative futures” Relative productivity Resourcepressure Scenario 1 Resource Shortages Scenario 2 Persistent price Decline Scenario 3 Balanced Forces 1973-2000 1950-72 Weak relative productivity gains Rising effective resource constraints Strong relative productivity gains Source: Rio Tinto Declining effective resource constraints
  • 20.
    20 Conclusions • The miningindustry has seen a 30-40+% rise in operating costs since 2003; capital costs have risen 40-80% • Around 20% of this rise is exchange rate driven and a significant proportion of the remaining cost increase reflects cyclical rises in input prices • There is a residual element of structural change related to the impact of faster underlying demand growth and the balance of drivers that pulled prices downwards over the previous 30 years has shifted • It is important to recognise these different elements. As/when investment by the industry catches up with demand prices will adjust to long run cost- based realities. • Awareness of the broader drivers that will drive these cost trends is important in forecasting prices and for strategic investment decisions in the industry
  • 21.
    Mining Industry Costsand Prices: A Long Run Perspective Neal Brewster General Manager Forecasting, Rio Tinto MEMS, Bolder, Co 19th April 2007

Editor's Notes

  • #6 Substantial US dollar cost inflation since 2002-2003 Both capital and operating costs Partly exchange rates Also impact of current strong markets (Input prices – Price related costs – Labour/bonuses – Royalty) How much is cyclical and much will persist? When will pressure ease?
  • #8 Analysis of capital cost escalation difficult as projects vary and it region specific Generally observe a 40-80% in capex costs since 2003. Exchange rate changes account for ~20% of this increase BHPB data for Ravensthorpe indicates that if raw materials, labour and contractor margins returned to 2003 levels then capital costs would be up to 25-40% lower (this is an upper end figure as not all costs would be expected to return to 2003 levels) Bottom-up modelling by Rio Tinto for individual projects suggests lower steel and energy prices would reduce capital costs by 15% It's difficult to separate out the effect of individual cost escalation from project specific factors, but RTIO indicated to me that that have seen something like 80% in capex costs since 2003. Exchange rate changes would only account for up to 20% of this increase. Based on some publicly available data on Ravensthorpe, analysis by Xavier indicates that if raw materials, labour and contractor margins returned to 2003 levels then capital costs would be up to 25-40% lower (depending on what you think the "current" costs are). This is an upper end figure as not all costs would be expected to return to 2003 levels. Ken indicated to us that PCS's costs have publicly increased from $1.2b in mid-05 to $1.6b (+33%) and that a 45% rise was now more likely. 25% off this higher rise would bring us back to the equivalent cost of $650/tonne of capacity - which still looked heavy in comparison to historical costs of new capacity in the industry. In local currency terms (eg excluding fx effects) industry opex costs seem to have risen by 15-30% since 2003
  • #13 Chinese metal consumption is ten times that in India and energy consumption is 3-4 times higher
  • #16 <number>
  • #17 <number> Overall there is no shortage of known copper resources in the ground. South America has roughly half of the combined resources and reserves. Africa will likely grow as additional exploration is conducted.
  • #18 <number>
  • #19 <number>