1. 0 | P a g e
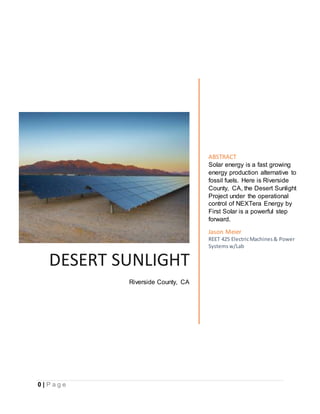
DESERT SUNLIGHT
Riverside County, CA
ABSTRACT
Solar energy is a fast growing
energy production alternative to
fossil fuels. Here is Riverside
County, CA, the Desert Sunlight
Project under the operational
control of NEXTera Energy by
First Solar is a powerful step
forward.
Jason Meier
REET 425 ElectricMachines& Power
Systemsw/Lab
2. 1 | P a g e
Contents
Abstract..........................................................................................................................................2
NextEra Energy ............................................................................................................................3
Desert Sunlight .............................................................................................................................4
Benefits of Solar Production .......................................................................................................5
Panel Physical Characteristics...................................................................................................7
Panel Electrical Characteristics .................................................................................................8
Simulation....................................................................................................................................10
Simulated System ..................................................................................................................11
Conclusion...................................................................................................................................14
Appendix A ..................................................................................................................................16
Reference Documents...........................................................................................................16
Appendix B Plant Locations......................................................................................................17
References ..................................................................................................................................18
FIGURE 1NEXTERA ENERGY RESOURCES PORTFOLIO BY TYPE..................................................................................................................3
FIGURE 2 - NEXTERA ENERGY PORTFOLIO ..............................................................................................................................................4
FIGURE 3 - DISTURBANCEACREAGEFOR THE DESERT SUNLIGHT FARMAND SCEPROJECTCOMPONENTS (FIELD SUPERVISOR,2011)........5
FIGURE 4 - PROJECT STATISTICS .............................................................................................................................................................6
FIGURE 5 - SERIES 3 VS SERIES 5 ............................................................................................................................................................8
FIGURE 6 - SERIES 3 MODULE RATINGS..................................................................................................................................................9
FIGURE 7 - SERIES 5 MODULE RATINGS................................................................................................................................................10
FIGURE 8 - DESERT SUNLIGHT ASSUMED CONFIGURATION AS TRANSFORMERLESS GRID-CONNECTED PV ARRAY ....................................11
FIGURE 9 –IRRADIANCE (W/M2),VDC MEAN (V), PDC MEAN (W).......................................................................................................12
FIGURE 10 - GRID VOLTAGEAND CURRENT ..........................................................................................................................................13
FIGURE 11 –IG (LEAKAGE CURRENT)....................................................................................................................................................13
FIGURE 12 - PLANT LOCATION MAP.....................................................................................................................................................17
3. 2 | P a g e
Abstract
Alternative energy is not a new concept as many may believe. The idea of finding
alternative sources of energy was around in the 1800’s and potentially before then. In
1800 though, a Frenchman by the name of Auguste Mouchout, a mathematics instructor
at the Lyce de Tours. Mouchout began his solar work in 1860 after expressing grave
concerns about his country’s dependence on coal (Smith, 1995). Through the course of
his research he was able to develop a one and a half horsepower steam engine to
pump water in 1872. By 1878 he had managed to redesign his invention which
increased the output to to produce 70 liters of water and 30 liters for steam. Though in
1881, the price of coal dropped due to the improvement of transporting it and therefore
the commissioners of the French Ministry of Public Works decided that his engine was
too costly to continue employment of the solar device.
Fast forward to the present after a several French and English inventors
furthering the advancement, building upon Mouchout’s steam engine, solar moved
across the Atlantic to the United States where it evolved into the systems and
applications of today by John Ericsson. Ericsson was one of the most influential and
controversial engineers of the nineteenth century (Smith, 1995). Ericsson claimed in
1870 that he had developed the first sola-powered steam engine, even though it was
modeled after that of Mouchout but to a much larger scale. As the advancement of
technology moves forward, the efficiency of the solar cells have become an asset to the
current electric grid in the United States. Today, there are a plethora of solar energy
companies growing and producing supplemental energy to help reduce the need for
fossil fuel reactors. Though they, in my opinion are still in their infancy, there are many
4. 3 | P a g e
areas that need to advance technologically speaking so that they can be referred to as
a primary power source vice a supplementary power source. This report will be
discussing the solar power plant that is part of the NextEra Energy company.
NextEra Energy
NextEra Energy is a primary power provider in the United States that employees
approximately 5,000 people with its headquarters located in Juno Beach, FL. Even
though the company is located in Florida, majority of their power plants are located in
western United States with the exception of the oil and nuclear plants. The remaining
plants, be it the solar or wind are located throughout the Central to the Western United
States and some in Canada. The company is comprised of a multitude of energy
producing technologies.
NextEra’s portfolio of generation methods includes wind, nuclear, natural gas,
solar, and oil. Of these methods, wind at 68% is their primary method, nuclear at 15%,
solar and natural gas tied at third with 7% of production, and the remaining 4% comes
from oil (Who We Are, 2016). By comparing the methods, the number of plants
compared the amount of power produced we can see the efficiency of each type:
Method of
Production
Number of
Producing Plants
Net Mega Watts
Produced
Power per Plant
(MW) Avg.
Gas 6 1,260.0 210
Nuclear 3 2,720.3 906.7
Solar 23 1,408.0 61.22
Wind 110 11,896.2 108.15
Figure 1NextEra Energy Resources Portfolio by Type
*See Appendix B for map of plant locations.
5. 4 | P a g e
NextEra is the largest wind and solar
generator in North America (Desert Sunlight
Solar Energy Cneter Fact Sheet). Among the
23 solar power plants, the Desert Sunlight
project will be the focus of the remainder of
this document.
Desert Sunlight
Desert Sunlight is a project developed
by First Solar at a cost of $1.5 Billion. This project is owned by Nextera Energy
Resources, GE Energy Financial Services, and Sumitomo Corporation of America.
Desert Sunlight is located in Riverside County, California. The project began the
planning phase in 2008 and became operational in 2015. The plant occupies an area of
approximately 7,600 hectares (19,000 acres). The solar farm and support facilities per
component is broken into separate acreage allocations. Figure 2 below illustrates the
land required for each component of the plant to include everything from access roads
to the land for the solar farm (solar panels).
Figure 2 - NextEra Energy Portfolio
6. 5 | P a g e
Figure 3 - Disturbance acreage for the Desert Sunlight Farm and SCE project components (Field Supervisor, 2011)
Benefits of Solar Production
The solar farm consists of 8.9 million solar panels which produces 550
megawatts of energy, 1,060,000 megawatt-hours. This is enough power to supply
ample amount of power to 160,000 homes. The basic concept of solar power is the
conversion of energy from the sun to electricity which we can use and apply to our
power grid. By producing energy by solar there are savings in other natural resources
that include fossil fuels and water. By saving on the need to use fossil fuels, they are
able to reduce the amount of carbon dioxide released into the atmosphere by 614,000
Metric Tons annually (Energy, 2015). The solar generation also does not require the
use of water, another extremely valuable resource especially today.
7. 6 | P a g e
The solar plant, during construction provided over 550 construction jobs over 26-
month period however, at 100% capability it only has fifteen full time employees. Due to
the lower number of employees required to maintain the facility, the long term overhead
is reduced providing a financial savings over time. In regards to financial benefits, the
additional new sales tax revenues $15 million and $12 million in new property tax
revenues for the county of Riverside. The construction of the plant provided an
estimated $336 million of indirect benefits to the county from engineering and design
firms to the support entities of the local area such as contractors and service providers.
The construction of Desert Sunlight sparked a new interest in solar energy in the
local schools which support the College of the Desert (COD) Renewable Energy training
and education programs (DesertSunlight Solar Farm, n.d.). This also includes new
interests at the local area elementary and high schools.
Figure 4 - Project Statistics
8. 7 | P a g e
Panel Physical Characteristics
The panels used in the construction of the Desert Sunlight project were
developed by First Solar. These panels are of the series 3 construction which today,
there have been steady advancements to the series 5 modules. The series 3 panel
modules were designed with high performance in mind.
Key Features of the Series 3 PV System
o Produces high energy output across a wide range of climate conditions
o Proven to perform as predicted with a high Performance Ratio (PR)
o Frameless laminate is robust, cost-effective and recyclable, and does not require
module grounding
o Manufactured in highly automated, state-of-the-art facilities certified to ISO
9001:2008 and ISO 14001:2004 quality and environmental management
standards
o Enhanced accelerated life testing performance and robustness in hot climates
and harsh operating conditions as demonstrated by Thresher and Long-Term
Sequential tests (Solar, 2014)
9. 8 | P a g e
Physical dimensions of the panels to include the connection type, cell type, cover type
and encapsulation are:
Series 3 vs. Series 5
Figure 5 - Series 3 vs Series 5
Panel Electrical Characteristics
Electrically, the series 3 modules were designed using a unique combination of
n-type and p-type materials. “CdS and CdTe are two promising photovoltaic materials
for thin film solar cells. CdS is a wide bandgap (~2.42 eV) n-type semiconductor, which
can act as a window layer, while CdTe (a p-type semiconductor) has a near optimum
bandgap of ~1.45 eV, to be an absorber layer. Furthermore, it has high optical
10. 9 | P a g e
coefficient, so that a thickness of ~ 2µm will absorb nearly 100% of the incident solar
radiation.” (Properties of CdS and CdTe thin films deposited by an electrochemical
technique, 2007).
This series was the leading photovoltaic cells during that time frame. Each panel
consists of 154 active cells that use the aforementioned semiconductor material which
allowed First Solar to set a new world record by achieving 16.1 percent of efficiency with
the series 3 modules (Wire, 2013). This is a substantial increase to their previous record
of 14.4 percent. In the more recent version of the panel configuration, the series 5, there
is an increase in number of active cells from 154 to 1092. The series 5 continues to use
the CdTe material and maintains the continued efficiency range of 16.1 to 16.8 percent.
With the increase of active cells per panel there is a substantial increase of power
production.
Figure 6 - Series 3 Module Ratings
11. 10 | P a g e
Figure 7 - Series 5 Module Ratings
In figures 6 and 7 we can see the impact that the additional active cells create while
maintaining the 16 percent efficiency of power production.
Simulation
When designed a project of such magnitude, it would be prudent to ensure that
the physical and electrical capability of the system will be a stable system. In doing so, a
MATLAB Simulink model was created to demonstrate an assumed configuration since
the actual data in regards to the Desert Sunlight project was not readily available. The
system that I designed is a transformerless grid-connected system. The PV array is
3130 parallel strings by 3130 series-connected modules per string. The number of
strings to modules were calculated to accommodate 9.8 million modules (panels) as per
the number of modules for the Desert Sunlight farm array. The modules are the First
Solar FS-385 modules that provide a maximum power of 85.36W per module with 77
cells per module. The voltage at the maximum power point is 48.5VMPP and a current of
1.76AMPP.
12. 11 | P a g e
Simulated System
Figure 8 - Desert Sunlight Assumed Configuration as Transformerless Grid-Connected PV Array
The over all system as mentioned above is using the FS-385 module and has 3130 parallel strings and 3130 series-
connected modules. This system is using an Irradiance (W/m2) limiter which keeps the output at zero until 0.4 seconds
after the initiation of the system. One reason for this is to prevent any unwanted damage to occur during start up. This
13. 12 | P a g e
keeps any unforeseen voltage spikes or current surges from entering into the remaining
part of the system. In the following scope illustrations, we can see the build up of
voltage and the initial surge of current. Then once everything has become stable, the
limiter allows for the output to flow.
Figure 9 – Irradiance (W/m2
), Vdc mean (V), Pdc mean (W)
In Figure 9, the Vdc mean level stabilize near the 0.4 second mark when the limiter
releases the output to the system. Notice in the Pdc mean graph (bottom graph) and in
14. 13 | P a g e
the Vdc mean graph (middle graph) that there is a slight surge in the Pdc and an increase
at Vdc. Then both become stable again.
Figure 10 - Grid Voltage and Current
In Figure 10, the voltage going to the grid is near ± 500 𝑉 with a grid current near zero.
This is extremely important that the current is low and the voltage is high. As we
covered in power distribution, if there is high grid or line current, then the amount of loss
between the source and the consumer is much higher. This would cause unwanted cost
to the supplier which in turn is passed on to the consumer in the form of higher power
costs.
Figure 11 – Ig (Leakage Current)
Figure 11 illustrates that the amount of current loss in the form of leakage is minimal as
the system becomes stable.
15. 14 | P a g e
Conclusion
In the world today, in a global effort, we are moving forward and making great
strides in the production of energy. Though the question still remains, are we doing
everything that we can with the highest level of available technology or are we still just
getting by? This is an important question because as we have seen in just this report,
the potential to create energy, well, to convert energy, from solar radiation to some
usable form whether it is concentrated heat to make steam or to have it absorbed into
photovoltaic cells to produce electrical power, there are many applications that can be
switched to or become more efficient if we apply the technology. The First Solar project,
Desert Sunlight is an excellent example and it started commercial operations in 2013
(DesertSunlight Solar Farm, n.d.). Though it is only three years into operations, the new
version of solar module, the series 5 has made significant advancements in enhancing
the collector modules from the previously used series 3 modules. By producing 500 MW
of power and serving approximately 160,000 homes, imagine what is possible if we
focus more in this area of power generation.
The issue that will need to be addressed in regards to solar power production will
be the real estate required to increase the footprint without a negative impact on the
environment. To aid in solving this dilemma, I suggest that for homes that are built
within the geographical areas that have prominent sun exposure, to have panels
included as part of the roofing on new homes being built and offer financial incentive for
homes to have systems retro-fitted which would not only benefit the consumer by
reducing the cost of electricity but it also reduces the need for fossil fuels to be used to
16. 15 | P a g e
generate power. A co-op as you will, where the consumer owns part or a share of the
production for their community and beyond.
So in conclusion, power production and distribution has come a long way and is
getting better. As engineers, it is our duty to continue searching for new and better ways
to generate and distribute power around the world. With the continuous advancement of
technology, the need for power is continuous growing at an exponential rate. Therefore,
the study of not only alternative or renewable energy production but the study of all
energy production is important because not all environments are suitable for solar or
wind which only leaves fossil fuels and nuclear methods to produce the needed energy.
17. 16 | P a g e
Appendix A
Reference Documents
Desert Sunlight BO BLM.pdf Desert Sunlight Fact Sheett.pdf
Nextera Energy Resources Loc-Mw.pdf First Solar series3Black-4.pdf
First Solar Series 5 Datasheet.pdf
18. 17 | P a g e
Appendix B Plant Locations
Figure 12 - Plant Location Map
Legend
19. 18 | P a g e
References
Desert Sunlight at Work in California. (2016). Retrieved from NEXTera Energy
Resources: http://webtest.nexteraenergyresources.com/what/desert-
sunlight.shtml
Desert Sunlight Solar Energy Cneter Fact Sheet. (n.d.). Retrieved from NextEra Energy
Resources:
https://www.nexteraenergyresources.com/pdf_redesign/desert_sunlight.pdf
DesertSunlight Solar Farm. (n.d.). Retrieved from First Solar:
http://www.firstsolar.com/en/About-Us/Projects/Desert-Sunlight-Solar-Farm
Energy, U. o. (2015, March). Loan Programs Office. Retrieved from Energy.Gov:
http://energy.gov/lpo/desert-sunlight
Field Supervisor, C. F. (2011, July 06). medialib. Retrieved from Bureau of Land
Management:
http://www.blm.gov/style/medialib/blm/ca/pdf/palmsprings/desert_sunlight.Par.83
759.File.dat/Desert%20Sunlight%20BO.pdf
Properties of CdS and CdTe thin films deposited by an electrochemical technique.
(2007, March). Retrieved from Indian Journal of Pure & Applied Physics:
http://nopr.niscair.res.in/bitstream/123456789/2311/1/IJPAP%2045(3)%20226-
230.pdf
Smith, C. (1995, July). Revisiting Solar Power's Past. Retrieved from Solar Energy.com:
http://solarenergy.com/info-history
Solar, F. (2014, January). First Solar Product Sheet. Retrieved from First Solar:
http://www.firstsolar.com/-/media/Documents/Data-Sheets/Products/Module-
Data-Sheet/PD-5-401-03_Series3Black-4.ashx
Who We Are. (2016, April 4). Retrieved from NextEraEnergy:
https://www.nexteraenergyresources.com/who/index.shtml#wind
Wire, B. (2013, April 09). First Solar Sets CDTE Module efficiency world record.
Retrieved from Investor First Solar:
http://investor.firstsolar.com/releasedetail.cfm?ReleaseID=755244