Download to read offline

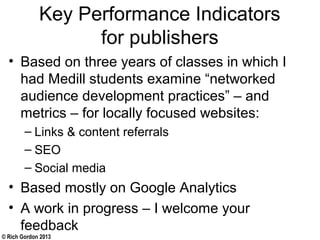
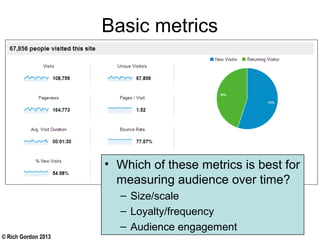


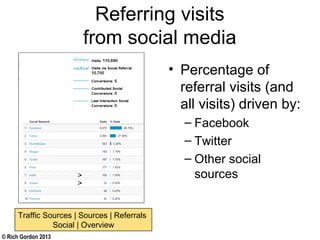
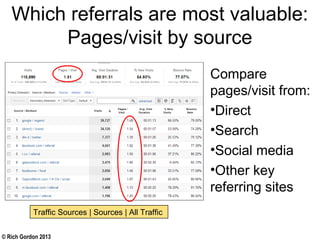
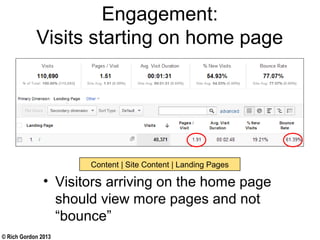
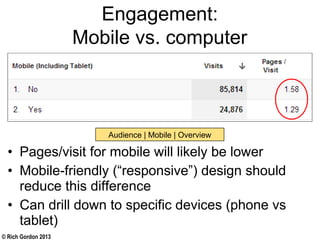
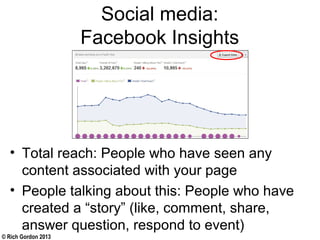
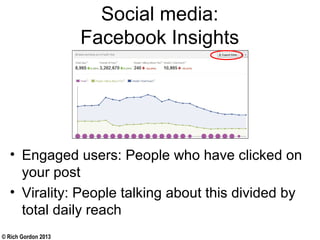
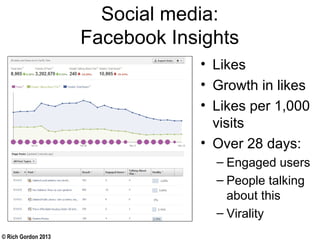
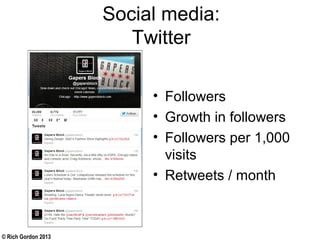
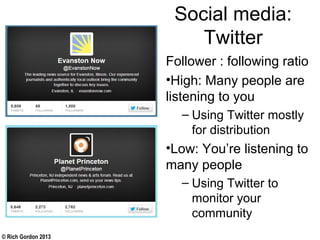


The document discusses key performance indicators (KPIs) that publishers should track to measure their online performance. It recommends tracking visits, new visits as a percentage of total visits to measure loyalty, and pages per visit to measure engagement. Other proposed KPIs include traffic sources like search, referral, social media and the number of pageviews from each. Social media metrics like followers, likes and engagement on Facebook and Twitter are also important. Consistently measuring and aligning KPIs to business goals can help publishers improve online performance over time.


![Google And The New SEO [WEBINAR]](https://cdn.slidesharecdn.com/ss_thumbnails/googleandthenewseo-131025175110-phpapp02-thumbnail.jpg?width=640&height=640&fit=bounds)


