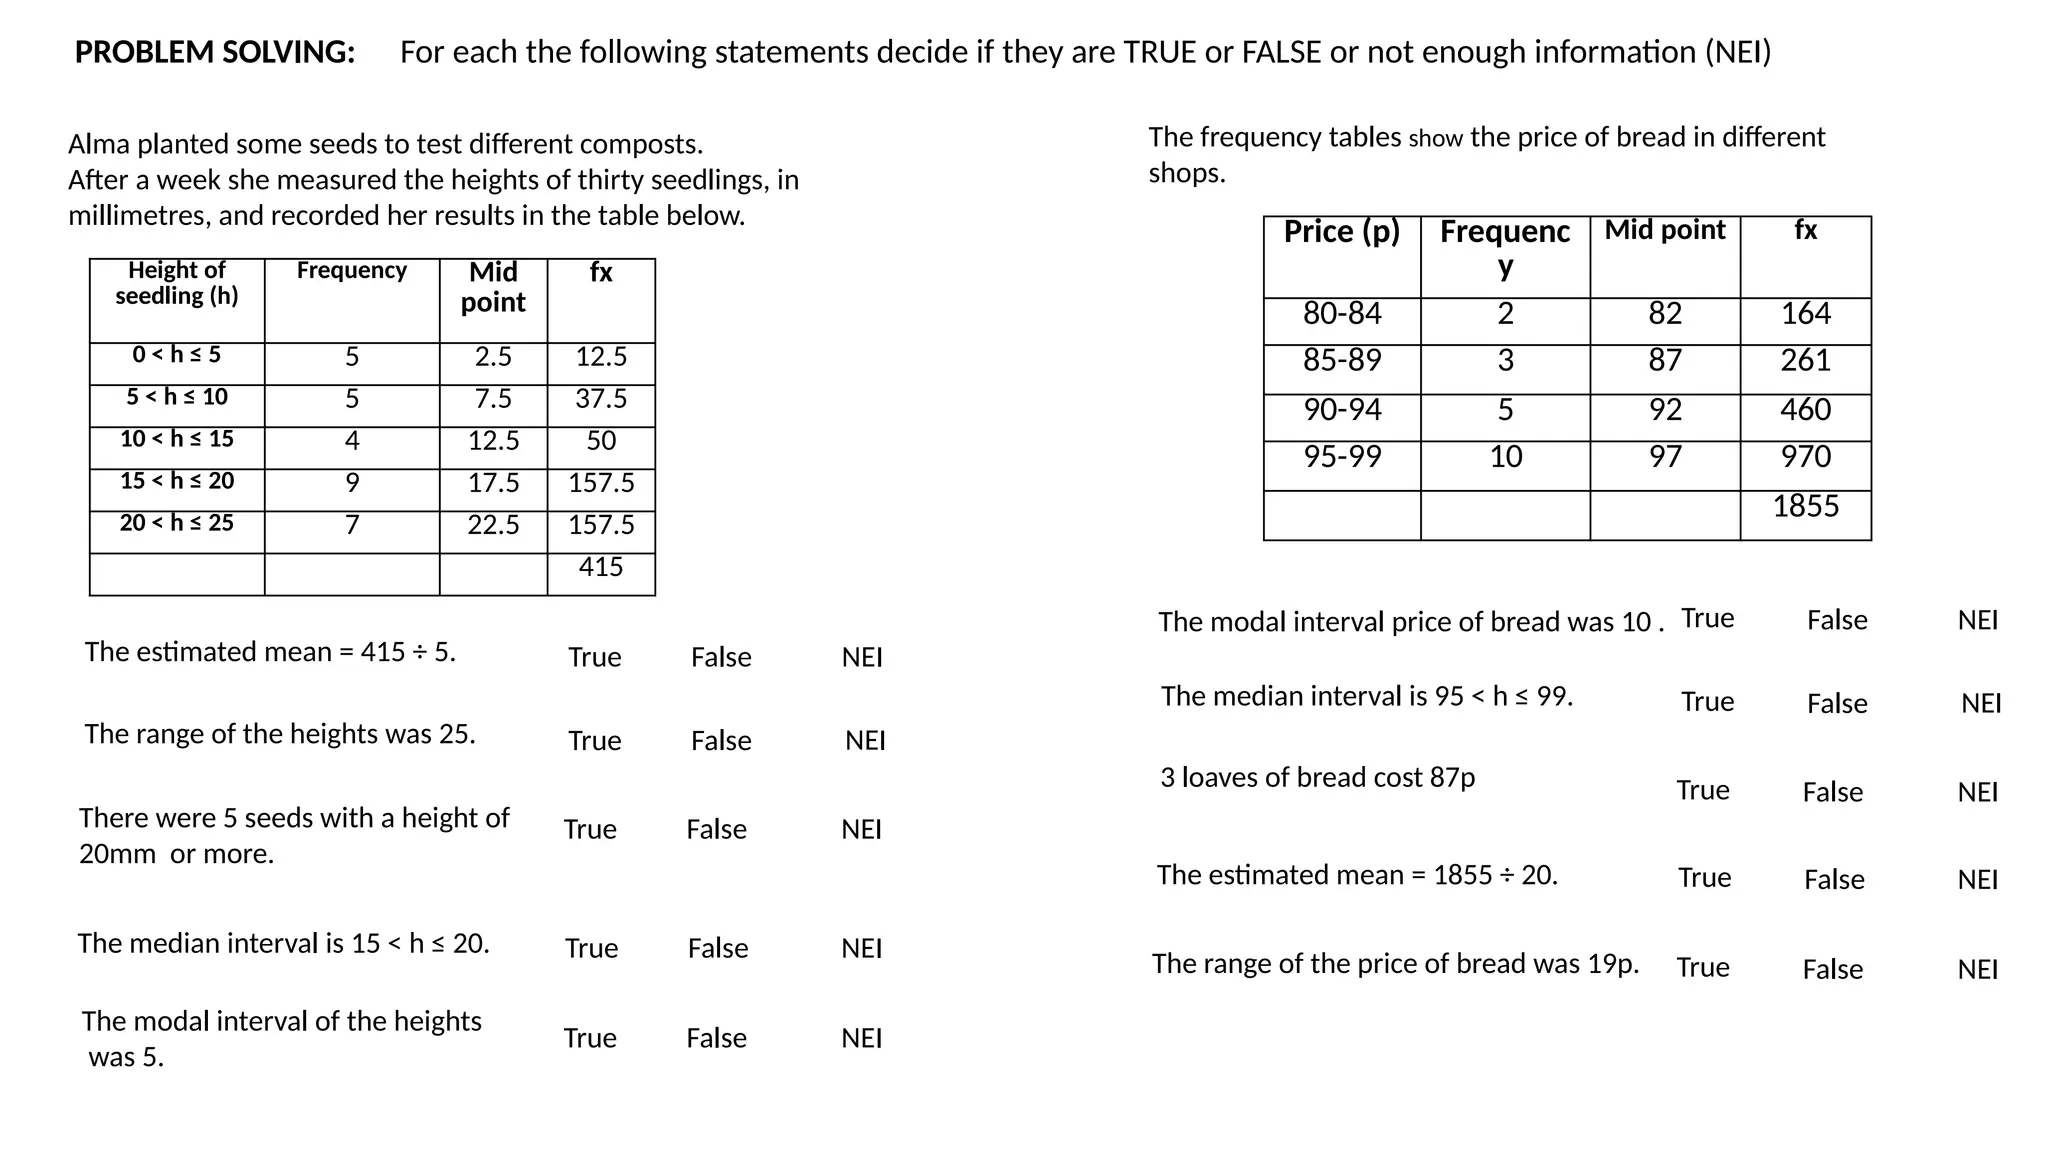
Averages from Grouped Data
0 < t ≤ 10
Jess says: the interval means all
the numbers from 0 to
10
Explain what the interval means:
Actually they start from
1 to 10 as it doesn’t
include 0
Chan says:
Who is correct? Explain your answer.
Height Frequency
20 ≤ h ≤ 30
30 ≤ h ≤ 40
40 ≤ h ≤ 50
50 ≤ h ≤ 60
60 ≤ h ≤ 70
Height Frequency
20 ≥ h > 30
30 ≥ h > 40
40 ≥ h > 50
50 ≥ h > 60
60 ≥ h > 70
Jess wrote the following tables:
Explain what Jess has done WRONG.
25 99 51 48 82
The data lists the height of corn crop (in cm)
95 89 21 73 94
33 71 62 66 102
109 94 42 70 35
101 109 83 47 60
27 104 44 29 38
31 119 90 87 115
54 59 48 47 95
81 76 22 83 92
99 65 52 44 96
85 22 53 56 49
70 89 57 68 32
How can we calculate the mean?
25 99 51 48 82
95 89 21 73 94
33 71 62 66 102
109 94 42 70 35
101 109 83 47 60
27 104 44 29 38
31 119 90 87 115
54 59 48 47 95
81 76 22 83 92
99 65 52 44 96
85 22 53 56 49
70 89 57 68 32
Height Frequency
20 ≤ h < 30
30 ≤ h < 40
40 ≤ h < 50
50 ≤ h < 60
60 ≤ h < 70
70 ≤ h < 80
80 ≤ h < 90
90 ≤ h < 100
100 ≤ h < 110
110 ≤ h < 120
Height Frequency
20 ≤ h < 40
40 ≤ h < 60
60 ≤ h < 80
80 ≤ h < 100
100 ≤ h < 120
Complete both tables.
6
5
7
8
5
5
8
9
5
2
25 99 51 48 82
89 21 73 94
33 71 62 66 102
109 94 42 70 35
101 109 83 47 60
27 104 44 29 38
31 119 90 87 115
54 59 48 47 95
81 76 22 83 92
99 65 52 44 96
85 22 53 56 49
70 89 57 68 32
Height Frequency
20 ≤ h < 30
30 ≤ h < 40
40 ≤ h < 50
50 ≤ h < 60
60 ≤ h < 70
70 ≤ h < 80
80 ≤ h < 90
90 ≤ h < 100
100 ≤ h < 110
110 ≤ h < 120
Height Frequency
20 ≤ h < 40
40 ≤ h < 60
60 ≤ h < 80
80 ≤ h < 100
100 ≤ h < 120
Does it matter which table we use to
calculate the mean?
Complete both tables.
6
5
7
8
5
5
8
9
5
2
11
15
10
17
7
95
Time Frequency (f)
0 - 4
5 - 9
10 - 14
15 - 19
Your Turn: Estimate the mean.
8
10
4
2
Time Frequency (f) Mid
point(x)
fx
0 - 4
5 - 9
10 - 14
15 - 19
Total
Your Turn: Estimate the mean.
24 168
Mean =
Mean = = 7
8
10
4
2
8 x 2 = 16
10 x 7 = 70
4 x 12 = 48
2 x 17 = 34
2
12
7
17
Length Frequency (f)
100 < m ≤ 200
200 < m ≤ 300
300 < m ≤ 400
400 < m ≤ 500
500 < m ≤ 600
What is the MODAL interval?
14
6
4
6
6
The mode is 6 so the
modal interval is 6
Explain why Chan is WRONG.
Time Frequency (f)
0 - 4
5 - 9
10 - 14
15 - 19
What is the MODAL interval of each of these tables?
8
10
4
2
Length Frequency (f)
100 < m ≤ 200
200 < m ≤ 300
300 < m ≤ 400
400 < m ≤ 500
500 < m ≤ 600
600 < m ≤ 700
700 < m ≤ 800
800 < m ≤ 900
9
10
9
25
Height Frequency (f)
1.0 < h ≤ 1.5
1.5 < h ≤ 2.0
2.0 < h ≤ 2.5
2.5 < h ≤ 3.0
3.0 < h ≤ 3.5
3.5 < h ≤ 4.0
1
0
2
1
12
9
8
9
1
1
(a) (b) (c)
5 - 9
400 < m ≤ 500
2.0 < h ≤ 2.5
Length Frequency (f)
100 < m ≤ 200
200 < m ≤ 300
300 < m ≤ 400
400 < m ≤ 500
500 < m ≤ 600
What is the MEDIAN interval?
14
6
4
6
6
The median is 4 as its in
the middle so the interval
is 300<m≤400
Explain why Jess is WRONG.
Length Frequency (f) Cumulative
Frequency
100 < m ≤ 200
200 < m ≤ 300
300 < m ≤ 400
400 < m ≤ 500
500 < m ≤ 600
What is the MEDIAN interval?
14
6
4
6
6
14
20
24
30
36
n = 36
Median value = 36÷2 = 18th
value
1st
- 14th
value
15th
- 20th
value
Median interval = 200 < m ≤ 300
Length Frequency (f)
1.0 < h ≤ 1.5
1.5 < h ≤ 2.0
2.0 < h ≤ 2.5
2.5 < h ≤ 3.0
3.0 < h ≤ 3.5
Your Turn: Work out the median interval.
15
11
19
8
2
Length Frequency (f) Cumulative
Frequency
1.0 < h ≤ 1.5
1.5 < h ≤ 2.0
2.0 < h ≤ 2.5
2.5 < h ≤ 3.0
3.0 < h ≤ 3.5
15
26
45
53
55
n = 55
Median value = 55÷2 = 27.5th
value
1st
- 15th
value
16th
- 26th
value
Median interval = 2.0 < m ≤ 2.5
Your Turn: Work out the median interval.
15
11
19
8
2
27th
- 45th
value
Alma planted some seeds to test different composts.
After a week she measured the heights of thirty
seedlings, in millimetres, and recorded her results in
the table below.
Height of
seedling (h)
Frequency Mid
point
fx
0 < h ≤ 5 5 2.5 12.5
5 < h ≤ 10 5 7.5 37.5
10 < h ≤ 15 4 12.5 50
15 < h ≤ 20 9 17.5 157.5
20 < h ≤ 25 7 22.5 157.5
415
For each the following statements decide if they are TRUE or
FALSE or not enough information (NEI)
The range of the heights was 25.
True False
The modal interval of the heights was 5.
True False
There were 5 seeds with a height of 20mm
or more.
The median interval is 15 < h ≤ 20.
True False
True False
The estimated mean = 415 ÷ 5.
True False
PROBLEM SOLVING:
NEI
NEI
NEI
NEI
NEI
The frequency tables show the price of bread in
different shops.
For each the following statements decide if they are TRUE or
FALSE or not enough information (NEI)
The range of the price of bread was 19p.
True False
The modal interval price of bread was 10 .
True False
3 loaves of bread cost 87p
The median interval is 95 < h ≤ 99.
NEI
True False
True False
The estimated mean = 1855 ÷ 20.
True False
YOUR TURN: PROBLEM SOLVING:
Price (p) Frequency Mid point fx
80-84 2 82 164
85-89 3 87 261
90-94 5 92 460
95-99 10 97 970
1855
NEI
NEI
NEI
NEI
a) Fiona works in a call centre. She records the length of each
phone call in the list below.
b) Anna planted some seeds to test different composts.
After a week she measured the heights of twenty seedlings, in
millimetres, and recorded her results in the table below.
For each of the following estimate the mean
Length of call (mins) Frequency Midpoint fx
0 ≤ t ≤ 5 3
5 < t ≤ 10 15
10 < t ≤ 15 8
15 < t ≤ 20 40
20 < t ≤ 25 20
Total
Height (mm) Frequency Midpoint fx
0 ≤ h ≤ 5
5 < h ≤ 10
10 < h ≤ 15
15 < h ≤ 20
20 < h ≤ 25
Total
1.3, 3.2, 5.4, 8.1, 11.7, 15.4, 13.9, 10.5, 2.8, 7.3, 10.0
22.4, 18.7, 24.5, 21.7, 19.8, 16.4, 17.5, 1.9, 15.3
86 570
3 x 2.5 = 7.5
112.5
100
700
2.5
12.5
7.5
17.5
22.5 450
Mean = = 6.63
20 250
3 x 2.5 = 10
30
37.5
105
2.5
12.5
7.5
17.5
22.5 67.5
4
4
3
6
3
Mean = = 12.5
Height (h cm) Frequency
120 < h ≤ 130 2
130 < h ≤ 150 5
150 < h ≤ 160 4
160 < h ≤ 165 10
165 < h ≤ 180 18
180 < h ≤ 200 7
Time (t mins) Frequency
0 ≤ t ≤ 5 19
5 < t ≤ 10 23
10 < t ≤ 20 7
20 < t ≤ 25 2
25 < t ≤ 40 3
40 < t ≤ 60 1
Distance (d metres) Frequency
1.00 < d ≤ 1.20 3
1.20 < d ≤ 1.30 4
1.30 < d ≤ 1.35 18
1.35 < d ≤ 1.50 15
1.50 < d ≤ 1.70 9
1.70 < d ≤ 2.00 6
Age (a years) Frequency
0 ≤ a ≤ 15 14
15 < a ≤ 25 20
25 < a ≤ 35 12
35 < a ≤ 40 18
40 < a ≤ 50 10
50 < a ≤ 60 14
60 < a ≤ 75 12
a) The heights of a class of Year 10 pupils were recorded as
follows:
b) In a Health Centre, the times patients had to wait was recorded
as follows:
c) Here are the long jump records for Year 11 pupils.
d) Here are the ages of 100 people in a village.
For each of the following: a) write the modal interval, b) estimate the mean and c) work out the median interval
46 7630
250
700
620
1625
125
155
140
162.5
172.5 3105
190 1330
Mean
=
= 165.87
midpoint fx
55 505
47.5
172.5
87.5
50
2.5
12.5
7.5
22.5
32.5 97.5
50 50
midpoint fx
Mean
=
= 9.18
55 79.025
3.3
5
23.85
21.375
1.1
1.325
1.25
1.425
1.6 14.4
1.85 11.1
midpoint fx
Mean
=
= 1.44
100 3570
105
400
360
675
7.5
30
20
37.5
45 450
55 770
midpoint fx
67.5 810
Mean
=
= 35.7
Extension Questions: Corbett Maths
1. Sally is raising money for charity for a fun run.
The table below has been given to her from the website.
Sally says the average donation is £10.
By calculating the estimated mean, decide if you agree
with Sally.
2. Nathan delivers pizzas.
The table below shows information about his delivery times.
The pizza company has a promotion that if the delivery time
a) Calculate an estimate for the mean delivery time.
b) What percentage of deliveries took over 30 minutes?
Nathan’s manager thinks that the promotion should be
changed to 40 minutes.
c) Do you agree? Explain your answer.
Finding the estimate of the Median – Using Interpolation
Number of
hours
Number of
girls (f)
Cumulative
Frequency
0 ≤ x ≤ 5 3
5 < x ≤ 10 7
10 < x ≤ 15 10
15 < x ≤ 20 15
3
10
20
24
n = 24
Median value = 24÷2 = 12th
value
1st
– 3rd
value
4th
- 10th
value
Median value lies in this interval
11th
- 20th
value
We are looking for the
2nd
value along this
interval of frequency 10
Start of interval Class width
11
+2
Your Turn: Finding the estimate of the Median – Using
Interpolation
Age (x) in years Number of
people (f)
10 < x ≤ 20 4
20 < x ≤ 30 18
30 < x ≤ 40 8
40 < x ≤ 50 10
Your Turn: Finding the estimate of the Median – Using
Interpolation
Age (x) in years Number of
people (f)
Cumulative
Frequency
10 < x ≤ 20 4
20 < x ≤ 30 18
30 < x ≤ 40 8
40 < x ≤ 50 10
4
22
30
40
n = 40
Median value = 40÷2 = 20th
value
1st
– 4th
value
5th
- 22th
value Median value lies in this interval
We are looking for the
16th
value along this
interval of frequency 18
Class width
28.9
Start of interval
+16
a) Fiona works in a call centre. She records the length of each
phone call in the list below.
b) Bob asked each of 40 friends how many minutes they took to get
to work. The table shows some information about his results
For each of the following estimate the median (using interpolation).
Length of call (mins) Frequency
0 ≤ t ≤ 5 7
5 < t ≤ 10 15
10 < t ≤ 15 8
15 < t ≤ 20 40
20 < t ≤ 25 20
Time taken (m minutes) Frequency
0 < m ≤ 10 3
10 < m ≤ 20 8
20 < m ≤ 30 11
30 < m ≤ 40 9
40 < m ≤ 50 9
Answers: Finding the estimate of the Median – Using Interpolation
Length of call
(mins)
Frequency Cumulative
Frequency
0 ≤ t ≤ 5 7
5 < t ≤ 10 15
10 < t ≤ 15 8
15 < t ≤ 20 40
20 < t ≤ 25 20
7
22
30
70
n = 90
Median value = 90÷2 = 45th
value
1st
– 7th
value
8th
- 22th
value
Median value lies in this interval
We are looking for the
15th
value along this
interval of frequency 40
Class width
16.875
90
23rd
- 30th
value
31st
- 70th
value
Start of interval
a) Fiona works in a call centre. She records the length of each
phone call in the list below.
+15
Answers: Finding the estimate of the Median – Using Interpolation
Time taken
(m minutes)
Frequency Cumulative
Frequency
0 < m ≤ 10 3
10 < m ≤ 20 8
20 < m ≤ 30 11
30 < m ≤ 40 9
40 < m ≤ 50 9
3
11
22
31
n = 40
Median value = 40÷2 = 20th
value
1st
– 3rd
value
4th
- 11th
value
Median value lies in this interval
We are looking for the
9th
value along this
interval of frequency 11
Class width
28.18
40
12th
– 22nd
value
Start of interval
b) Bob asked each of 40 friends how many minutes they took to get
to work. The table shows some information about his results
+9
25 99 51 48 82
95 89 21 73 94
33 71 62 66 102
109 94 42 70 35
101 109 83 47 60
27 104 44 29 38
31 119 90 87 115
54 59 48 47 95
81 76 22 83 92
99 65 52 44 96
85 22 53 56 49
70 89 57 68 32
25 99 51 48 82
95 89 21 73 94
33 71 62 66 102
109 94 42 70 35
101 109 83 47 60
27 104 44 29 38
31 119 90 87 115
54 59 48 47 95
81 76 22 83 92
99 65 52 44 96
85 22 53 56 49
70 89 57 68 32
Height Frequency
(f)
Mid
point(x)
fx
20 ≤ h < 30
30 ≤ h < 40
40 ≤ h < 50
50 ≤ h < 60
60 ≤ h < 70
70 ≤ h < 80
80 ≤ h < 90
90 ≤ h < 100
100 ≤ h < 110
110 ≤ h < 120
Total
Height Frequency
(f)
Mid
point(x)
fx
20 ≤ h < 40
40 ≤ h < 60
60 ≤ h < 80
80 ≤ h < 100
100 ≤ h < 120
Total
Time Frequency (f)
0 - 4
5 - 9
10 - 14
15 - 19
8
10
4
2
Your Turn: Calculate the mean.
Length Frequency (f)
100 < m ≤ 200
200 < m ≤ 300
300 < m ≤ 400
400 < m ≤ 500
500 < m ≤ 600
14
6
4
6
6
What is the MODAL interval?
Length Frequency (f)
1.0 < h ≤ 1.5
1.5 < h ≤ 2.0
2.0 < h ≤ 2.5
2.5 < h ≤ 3.0
3.0 < h ≤ 3.5
Your Turn: Work out the median interval.
15
11
19
8
2
Alma planted some seeds to test different composts.
After a week she measured the heights of thirty seedlings, in
millimetres, and recorded her results in the table below.
Height of
seedling (h)
Frequency Mid
point
fx
0 < h ≤ 5 5 2.5 12.5
5 < h ≤ 10 5 7.5 37.5
10 < h ≤ 15 4 12.5 50
15 < h ≤ 20 9 17.5 157.5
20 < h ≤ 25 7 22.5 157.5
415
For each the following statements decide if they are TRUE or FALSE or not enough information (NEI)
The range of the heights was 25.
True False
The modal interval of the heights
was 5.
True False
There were 5 seeds with a height of
20mm or more.
The median interval is 15 < h ≤ 20.
True False
True False
The estimated mean = 415 ÷ 5.
True False
PROBLEM SOLVING:
NEI
NEI
NEI
NEI
NEI
Price (p) Frequenc
y
Mid point fx
80-84 2 82 164
85-89 3 87 261
90-94 5 92 460
95-99 10 97 970
1855
The range of the price of bread was 19p.
The modal interval price of bread was 10 .
3 loaves of bread cost 87p
The median interval is 95 < h ≤ 99.
The estimated mean = 1855 ÷ 20.
The frequency tables show the price of bread in different
shops.
True False
True False
True False
True False
True False
NEI
NEI
NEI
NEI
NEI
a) Fiona works in a call centre. She records the length of each
phone call in the list below.
b) Anna planted some seeds to test different composts.
After a week she measured the heights of twenty seedlings, in
millimetres, and recorded her results in the table below.
For each of the following estimate the mean
Length of call (mins) Frequency Midpoint fx
0 ≤ t ≤ 5 3
5 < t ≤ 10 15
10 < t ≤ 15 8
15 < t ≤ 20 40
20 < t ≤ 25 20
Total
Height (mm) Frequency Midpoint fx
0 ≤ h ≤ 5
5 < h ≤ 10
10 < h ≤ 15
15 < h ≤ 20
20 < h ≤ 25
Total
1.3, 3.2, 5.4, 8.1, 11.7, 15.4, 13.9, 10.5, 2.8, 7.3, 10.0
22.4, 18.7, 24.5, 21.7, 19.8, 16.4, 17.5, 1.9, 15.3
Height (h cm) Frequency
120 < h ≤ 130 2
130 < h ≤ 150 5
150 < h ≤ 160 4
160 < h ≤ 165 10
165 < h ≤ 180 18
180 < h ≤ 200 7
Time (t mins) Frequency
0 ≤ t ≤ 5 19
5 < t ≤ 10 23
10 < t ≤ 20 7
20 < t ≤ 25 2
25 < t ≤ 40 3
40 < t ≤ 60 1
Distance (d metres) Frequency
1.00 < d ≤ 1.20 3
1.20 < d ≤ 1.30 4
1.30 < d ≤ 1.35 18
1.35 < d ≤ 1.50 15
1.50 < d ≤ 1.70 9
1.70 < d ≤ 2.00 6
Age (a years) Frequency
0 ≤ a ≤ 15 14
15 < a ≤ 25 20
25 < a ≤ 35 12
35 < a ≤ 40 18
40 < a ≤ 50 10
50 < a ≤ 60 14
60 < a ≤ 75 12
a) The heights of a class of Year 10 pupils were recorded as
follows:
b) In a Health Centre, the times patients had to wait was recorded
as follows:
c) Here are the long jump records for Year 11 pupils.
d) Here are the ages of 100 people in a village.
For each of the following: a) write the modal interval, b) estimate the mean and c) work out the median interval
Extension Questions: Corbett Maths
1. Sally is raising money for charity for a fun run.
The table below has been given to her from the website.
Sally says the average donation is £10.
By calculating the estimated mean, decide if you agree
with Sally.
2. Nathan delivers pizzas.
The table below shows information about his delivery times.
The pizza company has a promotion that if the delivery time
a) Calculate an estimate for the mean delivery time.
b) What percentage of deliveries took over 30 minutes?
Nathan’s manager thinks that the promotion should be
changed to 40 minutes.
c) Do you agree? Explain your answer.
Finding the estimate of the Median – Using Interpolation
Number of
hours
Number of
girls (f)
Cumulative
Frequency
0 ≤ x ≤ 5 3
5 < x ≤ 10 7
10 < x ≤ 15 10
15 < x ≤ 20 15
Age (x) in years Number of
people (f)
10 < x ≤ 20 4
20 < x ≤ 30 18
30 < x ≤ 40 8
40 < x ≤ 50 10
Example
Your turn
Finding the estimate of the Median – Using Interpolation
Number of
hours
Number of
girls (f)
Cumulative
Frequency
0 ≤ x ≤ 5 3
5 < x ≤ 10 7
10 < x ≤ 15 10
15 < x ≤ 20 15
Age (x) in years Number of
people (f)
10 < x ≤ 20 4
20 < x ≤ 30 18
30 < x ≤ 40 8
40 < x ≤ 50 10
Example
Your turn

Mean for Continuous Data mathematics .pptx

  • 1.
  • 2.
    0 < t≤ 10 Jess says: the interval means all the numbers from 0 to 10 Explain what the interval means: Actually they start from 1 to 10 as it doesn’t include 0 Chan says: Who is correct? Explain your answer.
  • 3.
    Height Frequency 20 ≤h ≤ 30 30 ≤ h ≤ 40 40 ≤ h ≤ 50 50 ≤ h ≤ 60 60 ≤ h ≤ 70 Height Frequency 20 ≥ h > 30 30 ≥ h > 40 40 ≥ h > 50 50 ≥ h > 60 60 ≥ h > 70 Jess wrote the following tables: Explain what Jess has done WRONG.
  • 4.
    25 99 5148 82 The data lists the height of corn crop (in cm) 95 89 21 73 94 33 71 62 66 102 109 94 42 70 35 101 109 83 47 60 27 104 44 29 38 31 119 90 87 115 54 59 48 47 95 81 76 22 83 92 99 65 52 44 96 85 22 53 56 49 70 89 57 68 32 How can we calculate the mean?
  • 5.
    25 99 5148 82 95 89 21 73 94 33 71 62 66 102 109 94 42 70 35 101 109 83 47 60 27 104 44 29 38 31 119 90 87 115 54 59 48 47 95 81 76 22 83 92 99 65 52 44 96 85 22 53 56 49 70 89 57 68 32 Height Frequency 20 ≤ h < 30 30 ≤ h < 40 40 ≤ h < 50 50 ≤ h < 60 60 ≤ h < 70 70 ≤ h < 80 80 ≤ h < 90 90 ≤ h < 100 100 ≤ h < 110 110 ≤ h < 120 Height Frequency 20 ≤ h < 40 40 ≤ h < 60 60 ≤ h < 80 80 ≤ h < 100 100 ≤ h < 120 Complete both tables. 6 5 7 8 5 5 8 9 5 2
  • 6.
    25 99 5148 82 89 21 73 94 33 71 62 66 102 109 94 42 70 35 101 109 83 47 60 27 104 44 29 38 31 119 90 87 115 54 59 48 47 95 81 76 22 83 92 99 65 52 44 96 85 22 53 56 49 70 89 57 68 32 Height Frequency 20 ≤ h < 30 30 ≤ h < 40 40 ≤ h < 50 50 ≤ h < 60 60 ≤ h < 70 70 ≤ h < 80 80 ≤ h < 90 90 ≤ h < 100 100 ≤ h < 110 110 ≤ h < 120 Height Frequency 20 ≤ h < 40 40 ≤ h < 60 60 ≤ h < 80 80 ≤ h < 100 100 ≤ h < 120 Does it matter which table we use to calculate the mean? Complete both tables. 6 5 7 8 5 5 8 9 5 2 11 15 10 17 7 95
  • 7.
    Time Frequency (f) 0- 4 5 - 9 10 - 14 15 - 19 Your Turn: Estimate the mean. 8 10 4 2
  • 8.
    Time Frequency (f)Mid point(x) fx 0 - 4 5 - 9 10 - 14 15 - 19 Total Your Turn: Estimate the mean. 24 168 Mean = Mean = = 7 8 10 4 2 8 x 2 = 16 10 x 7 = 70 4 x 12 = 48 2 x 17 = 34 2 12 7 17
  • 9.
    Length Frequency (f) 100< m ≤ 200 200 < m ≤ 300 300 < m ≤ 400 400 < m ≤ 500 500 < m ≤ 600 What is the MODAL interval? 14 6 4 6 6 The mode is 6 so the modal interval is 6 Explain why Chan is WRONG.
  • 10.
    Time Frequency (f) 0- 4 5 - 9 10 - 14 15 - 19 What is the MODAL interval of each of these tables? 8 10 4 2 Length Frequency (f) 100 < m ≤ 200 200 < m ≤ 300 300 < m ≤ 400 400 < m ≤ 500 500 < m ≤ 600 600 < m ≤ 700 700 < m ≤ 800 800 < m ≤ 900 9 10 9 25 Height Frequency (f) 1.0 < h ≤ 1.5 1.5 < h ≤ 2.0 2.0 < h ≤ 2.5 2.5 < h ≤ 3.0 3.0 < h ≤ 3.5 3.5 < h ≤ 4.0 1 0 2 1 12 9 8 9 1 1 (a) (b) (c) 5 - 9 400 < m ≤ 500 2.0 < h ≤ 2.5
  • 11.
    Length Frequency (f) 100< m ≤ 200 200 < m ≤ 300 300 < m ≤ 400 400 < m ≤ 500 500 < m ≤ 600 What is the MEDIAN interval? 14 6 4 6 6 The median is 4 as its in the middle so the interval is 300<m≤400 Explain why Jess is WRONG.
  • 12.
    Length Frequency (f)Cumulative Frequency 100 < m ≤ 200 200 < m ≤ 300 300 < m ≤ 400 400 < m ≤ 500 500 < m ≤ 600 What is the MEDIAN interval? 14 6 4 6 6 14 20 24 30 36 n = 36 Median value = 36÷2 = 18th value 1st - 14th value 15th - 20th value Median interval = 200 < m ≤ 300
  • 13.
    Length Frequency (f) 1.0< h ≤ 1.5 1.5 < h ≤ 2.0 2.0 < h ≤ 2.5 2.5 < h ≤ 3.0 3.0 < h ≤ 3.5 Your Turn: Work out the median interval. 15 11 19 8 2
  • 14.
    Length Frequency (f)Cumulative Frequency 1.0 < h ≤ 1.5 1.5 < h ≤ 2.0 2.0 < h ≤ 2.5 2.5 < h ≤ 3.0 3.0 < h ≤ 3.5 15 26 45 53 55 n = 55 Median value = 55÷2 = 27.5th value 1st - 15th value 16th - 26th value Median interval = 2.0 < m ≤ 2.5 Your Turn: Work out the median interval. 15 11 19 8 2 27th - 45th value
  • 15.
    Alma planted someseeds to test different composts. After a week she measured the heights of thirty seedlings, in millimetres, and recorded her results in the table below. Height of seedling (h) Frequency Mid point fx 0 < h ≤ 5 5 2.5 12.5 5 < h ≤ 10 5 7.5 37.5 10 < h ≤ 15 4 12.5 50 15 < h ≤ 20 9 17.5 157.5 20 < h ≤ 25 7 22.5 157.5 415 For each the following statements decide if they are TRUE or FALSE or not enough information (NEI) The range of the heights was 25. True False The modal interval of the heights was 5. True False There were 5 seeds with a height of 20mm or more. The median interval is 15 < h ≤ 20. True False True False The estimated mean = 415 ÷ 5. True False PROBLEM SOLVING: NEI NEI NEI NEI NEI
  • 16.
    Alma planted someseeds to test different composts. After a week she measured the heights of thirty seedlings, in millimetres, and recorded her results in the table below. Height of seedling (h) Frequency Mid point fx 0 < h ≤ 5 5 2.5 12.5 5 < h ≤ 10 5 7.5 37.5 10 < h ≤ 15 4 12.5 50 15 < h ≤ 20 9 17.5 157.5 20 < h ≤ 25 7 22.5 157.5 415 For each the following statements decide if they are TRUE or FALSE or not enough information (NEI) The range of the heights was 25. True False The modal interval of the heights was 5. True False There were 5 seeds with a height of 20mm or more. The median interval is 15 < h ≤ 20. True False True False The estimated mean = 415 ÷ 5. True False PROBLEM SOLVING: NEI NEI NEI NEI NEI
  • 17.
    The frequency tablesshow the price of bread in different shops. For each the following statements decide if they are TRUE or FALSE or not enough information (NEI) The range of the price of bread was 19p. True False The modal interval price of bread was 10 . True False 3 loaves of bread cost 87p The median interval is 95 < h ≤ 99. NEI True False True False The estimated mean = 1855 ÷ 20. True False YOUR TURN: PROBLEM SOLVING: Price (p) Frequency Mid point fx 80-84 2 82 164 85-89 3 87 261 90-94 5 92 460 95-99 10 97 970 1855 NEI NEI NEI NEI
  • 18.
    The frequency tablesshow the price of bread in different shops. For each the following statements decide if they are TRUE or FALSE or not enough information (NEI) The range of the price of bread was 19p. True False The modal interval price of bread was 10 . True False 3 loaves of bread cost 87p The median interval is 95 < h ≤ 99. NEI True False True False The estimated mean = 1855 ÷ 20. True False YOUR TURN: PROBLEM SOLVING: Price (p) Frequency Mid point fx 80-84 2 82 164 85-89 3 87 261 90-94 5 92 460 95-99 10 97 970 1855 NEI NEI NEI NEI
  • 19.
    a) Fiona worksin a call centre. She records the length of each phone call in the list below. b) Anna planted some seeds to test different composts. After a week she measured the heights of twenty seedlings, in millimetres, and recorded her results in the table below. For each of the following estimate the mean Length of call (mins) Frequency Midpoint fx 0 ≤ t ≤ 5 3 5 < t ≤ 10 15 10 < t ≤ 15 8 15 < t ≤ 20 40 20 < t ≤ 25 20 Total Height (mm) Frequency Midpoint fx 0 ≤ h ≤ 5 5 < h ≤ 10 10 < h ≤ 15 15 < h ≤ 20 20 < h ≤ 25 Total 1.3, 3.2, 5.4, 8.1, 11.7, 15.4, 13.9, 10.5, 2.8, 7.3, 10.0 22.4, 18.7, 24.5, 21.7, 19.8, 16.4, 17.5, 1.9, 15.3 86 570 3 x 2.5 = 7.5 112.5 100 700 2.5 12.5 7.5 17.5 22.5 450 Mean = = 6.63 20 250 3 x 2.5 = 10 30 37.5 105 2.5 12.5 7.5 17.5 22.5 67.5 4 4 3 6 3 Mean = = 12.5
  • 20.
    Height (h cm)Frequency 120 < h ≤ 130 2 130 < h ≤ 150 5 150 < h ≤ 160 4 160 < h ≤ 165 10 165 < h ≤ 180 18 180 < h ≤ 200 7 Time (t mins) Frequency 0 ≤ t ≤ 5 19 5 < t ≤ 10 23 10 < t ≤ 20 7 20 < t ≤ 25 2 25 < t ≤ 40 3 40 < t ≤ 60 1 Distance (d metres) Frequency 1.00 < d ≤ 1.20 3 1.20 < d ≤ 1.30 4 1.30 < d ≤ 1.35 18 1.35 < d ≤ 1.50 15 1.50 < d ≤ 1.70 9 1.70 < d ≤ 2.00 6 Age (a years) Frequency 0 ≤ a ≤ 15 14 15 < a ≤ 25 20 25 < a ≤ 35 12 35 < a ≤ 40 18 40 < a ≤ 50 10 50 < a ≤ 60 14 60 < a ≤ 75 12 a) The heights of a class of Year 10 pupils were recorded as follows: b) In a Health Centre, the times patients had to wait was recorded as follows: c) Here are the long jump records for Year 11 pupils. d) Here are the ages of 100 people in a village. For each of the following: a) write the modal interval, b) estimate the mean and c) work out the median interval 46 7630 250 700 620 1625 125 155 140 162.5 172.5 3105 190 1330 Mean = = 165.87 midpoint fx 55 505 47.5 172.5 87.5 50 2.5 12.5 7.5 22.5 32.5 97.5 50 50 midpoint fx Mean = = 9.18 55 79.025 3.3 5 23.85 21.375 1.1 1.325 1.25 1.425 1.6 14.4 1.85 11.1 midpoint fx Mean = = 1.44 100 3570 105 400 360 675 7.5 30 20 37.5 45 450 55 770 midpoint fx 67.5 810 Mean = = 35.7
  • 21.
    Extension Questions: CorbettMaths 1. Sally is raising money for charity for a fun run. The table below has been given to her from the website. Sally says the average donation is £10. By calculating the estimated mean, decide if you agree with Sally. 2. Nathan delivers pizzas. The table below shows information about his delivery times. The pizza company has a promotion that if the delivery time a) Calculate an estimate for the mean delivery time. b) What percentage of deliveries took over 30 minutes? Nathan’s manager thinks that the promotion should be changed to 40 minutes. c) Do you agree? Explain your answer.
  • 24.
    Finding the estimateof the Median – Using Interpolation Number of hours Number of girls (f) Cumulative Frequency 0 ≤ x ≤ 5 3 5 < x ≤ 10 7 10 < x ≤ 15 10 15 < x ≤ 20 15 3 10 20 24 n = 24 Median value = 24÷2 = 12th value 1st – 3rd value 4th - 10th value Median value lies in this interval 11th - 20th value We are looking for the 2nd value along this interval of frequency 10 Start of interval Class width 11 +2
  • 25.
    Your Turn: Findingthe estimate of the Median – Using Interpolation Age (x) in years Number of people (f) 10 < x ≤ 20 4 20 < x ≤ 30 18 30 < x ≤ 40 8 40 < x ≤ 50 10
  • 26.
    Your Turn: Findingthe estimate of the Median – Using Interpolation Age (x) in years Number of people (f) Cumulative Frequency 10 < x ≤ 20 4 20 < x ≤ 30 18 30 < x ≤ 40 8 40 < x ≤ 50 10 4 22 30 40 n = 40 Median value = 40÷2 = 20th value 1st – 4th value 5th - 22th value Median value lies in this interval We are looking for the 16th value along this interval of frequency 18 Class width 28.9 Start of interval +16
  • 27.
    a) Fiona worksin a call centre. She records the length of each phone call in the list below. b) Bob asked each of 40 friends how many minutes they took to get to work. The table shows some information about his results For each of the following estimate the median (using interpolation). Length of call (mins) Frequency 0 ≤ t ≤ 5 7 5 < t ≤ 10 15 10 < t ≤ 15 8 15 < t ≤ 20 40 20 < t ≤ 25 20 Time taken (m minutes) Frequency 0 < m ≤ 10 3 10 < m ≤ 20 8 20 < m ≤ 30 11 30 < m ≤ 40 9 40 < m ≤ 50 9
  • 28.
    Answers: Finding theestimate of the Median – Using Interpolation Length of call (mins) Frequency Cumulative Frequency 0 ≤ t ≤ 5 7 5 < t ≤ 10 15 10 < t ≤ 15 8 15 < t ≤ 20 40 20 < t ≤ 25 20 7 22 30 70 n = 90 Median value = 90÷2 = 45th value 1st – 7th value 8th - 22th value Median value lies in this interval We are looking for the 15th value along this interval of frequency 40 Class width 16.875 90 23rd - 30th value 31st - 70th value Start of interval a) Fiona works in a call centre. She records the length of each phone call in the list below. +15
  • 29.
    Answers: Finding theestimate of the Median – Using Interpolation Time taken (m minutes) Frequency Cumulative Frequency 0 < m ≤ 10 3 10 < m ≤ 20 8 20 < m ≤ 30 11 30 < m ≤ 40 9 40 < m ≤ 50 9 3 11 22 31 n = 40 Median value = 40÷2 = 20th value 1st – 3rd value 4th - 11th value Median value lies in this interval We are looking for the 9th value along this interval of frequency 11 Class width 28.18 40 12th – 22nd value Start of interval b) Bob asked each of 40 friends how many minutes they took to get to work. The table shows some information about his results +9
  • 30.
    25 99 5148 82 95 89 21 73 94 33 71 62 66 102 109 94 42 70 35 101 109 83 47 60 27 104 44 29 38 31 119 90 87 115 54 59 48 47 95 81 76 22 83 92 99 65 52 44 96 85 22 53 56 49 70 89 57 68 32 25 99 51 48 82 95 89 21 73 94 33 71 62 66 102 109 94 42 70 35 101 109 83 47 60 27 104 44 29 38 31 119 90 87 115 54 59 48 47 95 81 76 22 83 92 99 65 52 44 96 85 22 53 56 49 70 89 57 68 32
  • 31.
    Height Frequency (f) Mid point(x) fx 20 ≤h < 30 30 ≤ h < 40 40 ≤ h < 50 50 ≤ h < 60 60 ≤ h < 70 70 ≤ h < 80 80 ≤ h < 90 90 ≤ h < 100 100 ≤ h < 110 110 ≤ h < 120 Total Height Frequency (f) Mid point(x) fx 20 ≤ h < 40 40 ≤ h < 60 60 ≤ h < 80 80 ≤ h < 100 100 ≤ h < 120 Total
  • 32.
    Time Frequency (f) 0- 4 5 - 9 10 - 14 15 - 19 8 10 4 2 Your Turn: Calculate the mean. Length Frequency (f) 100 < m ≤ 200 200 < m ≤ 300 300 < m ≤ 400 400 < m ≤ 500 500 < m ≤ 600 14 6 4 6 6 What is the MODAL interval? Length Frequency (f) 1.0 < h ≤ 1.5 1.5 < h ≤ 2.0 2.0 < h ≤ 2.5 2.5 < h ≤ 3.0 3.0 < h ≤ 3.5 Your Turn: Work out the median interval. 15 11 19 8 2
  • 33.
    Alma planted someseeds to test different composts. After a week she measured the heights of thirty seedlings, in millimetres, and recorded her results in the table below. Height of seedling (h) Frequency Mid point fx 0 < h ≤ 5 5 2.5 12.5 5 < h ≤ 10 5 7.5 37.5 10 < h ≤ 15 4 12.5 50 15 < h ≤ 20 9 17.5 157.5 20 < h ≤ 25 7 22.5 157.5 415 For each the following statements decide if they are TRUE or FALSE or not enough information (NEI) The range of the heights was 25. True False The modal interval of the heights was 5. True False There were 5 seeds with a height of 20mm or more. The median interval is 15 < h ≤ 20. True False True False The estimated mean = 415 ÷ 5. True False PROBLEM SOLVING: NEI NEI NEI NEI NEI Price (p) Frequenc y Mid point fx 80-84 2 82 164 85-89 3 87 261 90-94 5 92 460 95-99 10 97 970 1855 The range of the price of bread was 19p. The modal interval price of bread was 10 . 3 loaves of bread cost 87p The median interval is 95 < h ≤ 99. The estimated mean = 1855 ÷ 20. The frequency tables show the price of bread in different shops. True False True False True False True False True False NEI NEI NEI NEI NEI
  • 34.
    a) Fiona worksin a call centre. She records the length of each phone call in the list below. b) Anna planted some seeds to test different composts. After a week she measured the heights of twenty seedlings, in millimetres, and recorded her results in the table below. For each of the following estimate the mean Length of call (mins) Frequency Midpoint fx 0 ≤ t ≤ 5 3 5 < t ≤ 10 15 10 < t ≤ 15 8 15 < t ≤ 20 40 20 < t ≤ 25 20 Total Height (mm) Frequency Midpoint fx 0 ≤ h ≤ 5 5 < h ≤ 10 10 < h ≤ 15 15 < h ≤ 20 20 < h ≤ 25 Total 1.3, 3.2, 5.4, 8.1, 11.7, 15.4, 13.9, 10.5, 2.8, 7.3, 10.0 22.4, 18.7, 24.5, 21.7, 19.8, 16.4, 17.5, 1.9, 15.3
  • 35.
    Height (h cm)Frequency 120 < h ≤ 130 2 130 < h ≤ 150 5 150 < h ≤ 160 4 160 < h ≤ 165 10 165 < h ≤ 180 18 180 < h ≤ 200 7 Time (t mins) Frequency 0 ≤ t ≤ 5 19 5 < t ≤ 10 23 10 < t ≤ 20 7 20 < t ≤ 25 2 25 < t ≤ 40 3 40 < t ≤ 60 1 Distance (d metres) Frequency 1.00 < d ≤ 1.20 3 1.20 < d ≤ 1.30 4 1.30 < d ≤ 1.35 18 1.35 < d ≤ 1.50 15 1.50 < d ≤ 1.70 9 1.70 < d ≤ 2.00 6 Age (a years) Frequency 0 ≤ a ≤ 15 14 15 < a ≤ 25 20 25 < a ≤ 35 12 35 < a ≤ 40 18 40 < a ≤ 50 10 50 < a ≤ 60 14 60 < a ≤ 75 12 a) The heights of a class of Year 10 pupils were recorded as follows: b) In a Health Centre, the times patients had to wait was recorded as follows: c) Here are the long jump records for Year 11 pupils. d) Here are the ages of 100 people in a village. For each of the following: a) write the modal interval, b) estimate the mean and c) work out the median interval
  • 36.
    Extension Questions: CorbettMaths 1. Sally is raising money for charity for a fun run. The table below has been given to her from the website. Sally says the average donation is £10. By calculating the estimated mean, decide if you agree with Sally. 2. Nathan delivers pizzas. The table below shows information about his delivery times. The pizza company has a promotion that if the delivery time a) Calculate an estimate for the mean delivery time. b) What percentage of deliveries took over 30 minutes? Nathan’s manager thinks that the promotion should be changed to 40 minutes. c) Do you agree? Explain your answer.
  • 37.
    Finding the estimateof the Median – Using Interpolation Number of hours Number of girls (f) Cumulative Frequency 0 ≤ x ≤ 5 3 5 < x ≤ 10 7 10 < x ≤ 15 10 15 < x ≤ 20 15 Age (x) in years Number of people (f) 10 < x ≤ 20 4 20 < x ≤ 30 18 30 < x ≤ 40 8 40 < x ≤ 50 10 Example Your turn Finding the estimate of the Median – Using Interpolation Number of hours Number of girls (f) Cumulative Frequency 0 ≤ x ≤ 5 3 5 < x ≤ 10 7 10 < x ≤ 15 10 15 < x ≤ 20 15 Age (x) in years Number of people (f) 10 < x ≤ 20 4 20 < x ≤ 30 18 30 < x ≤ 40 8 40 < x ≤ 50 10 Example Your turn