This document defines and provides background information on indicators to monitor progress toward the United Nations Millennium Development Goals. It was produced through interagency collaboration led by the United Nations Population Fund and involving the UN Development Programme, UN Statistics Division, World Bank, and others. The document introduces 48 quantitative indicators grouped under the 8 Millennium Goals covering issues such as poverty, education, gender equality, health, environment and global partnership. For each indicator, definitions are provided as well as the rationale, concepts, and data sources to help monitor progress toward achieving the Goals.
![Definitions, Rationale, Concepts and Sources
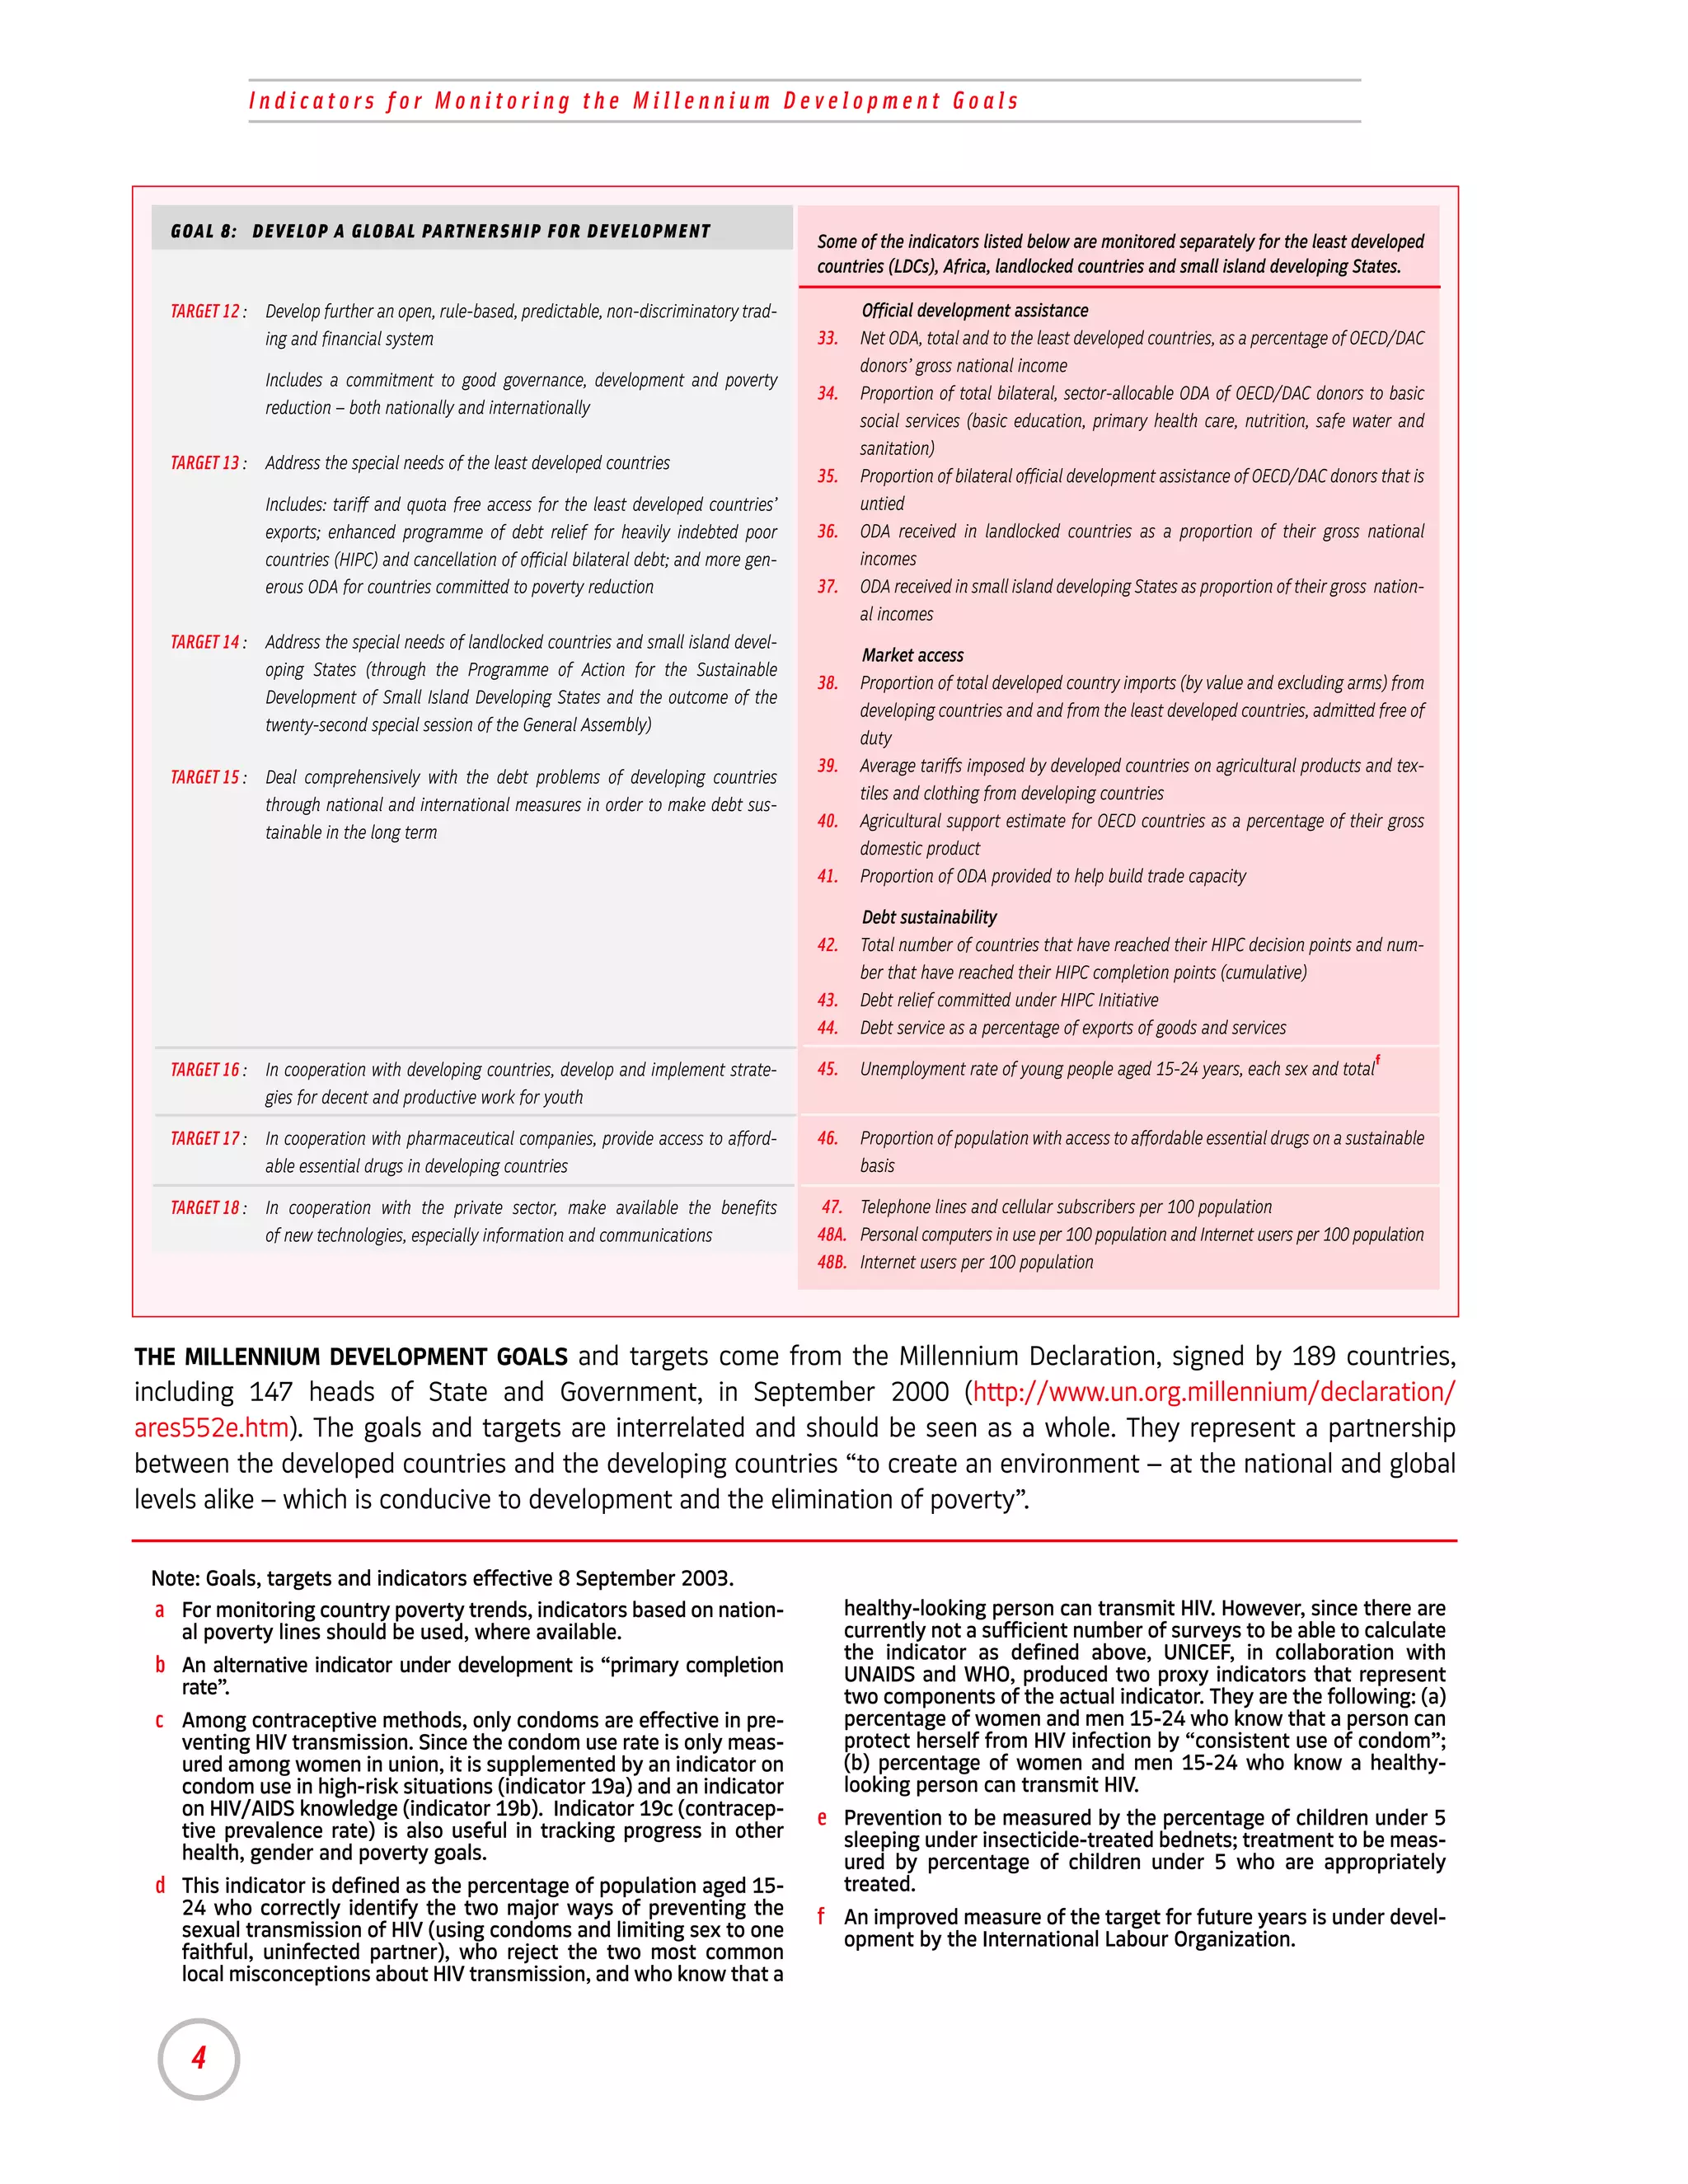
Goals, targets and indicators
GOALS AND TARGETS INDICATORS FOR MONITORING PROGRESS
FROM THE MILLENNIUM DECLARATION
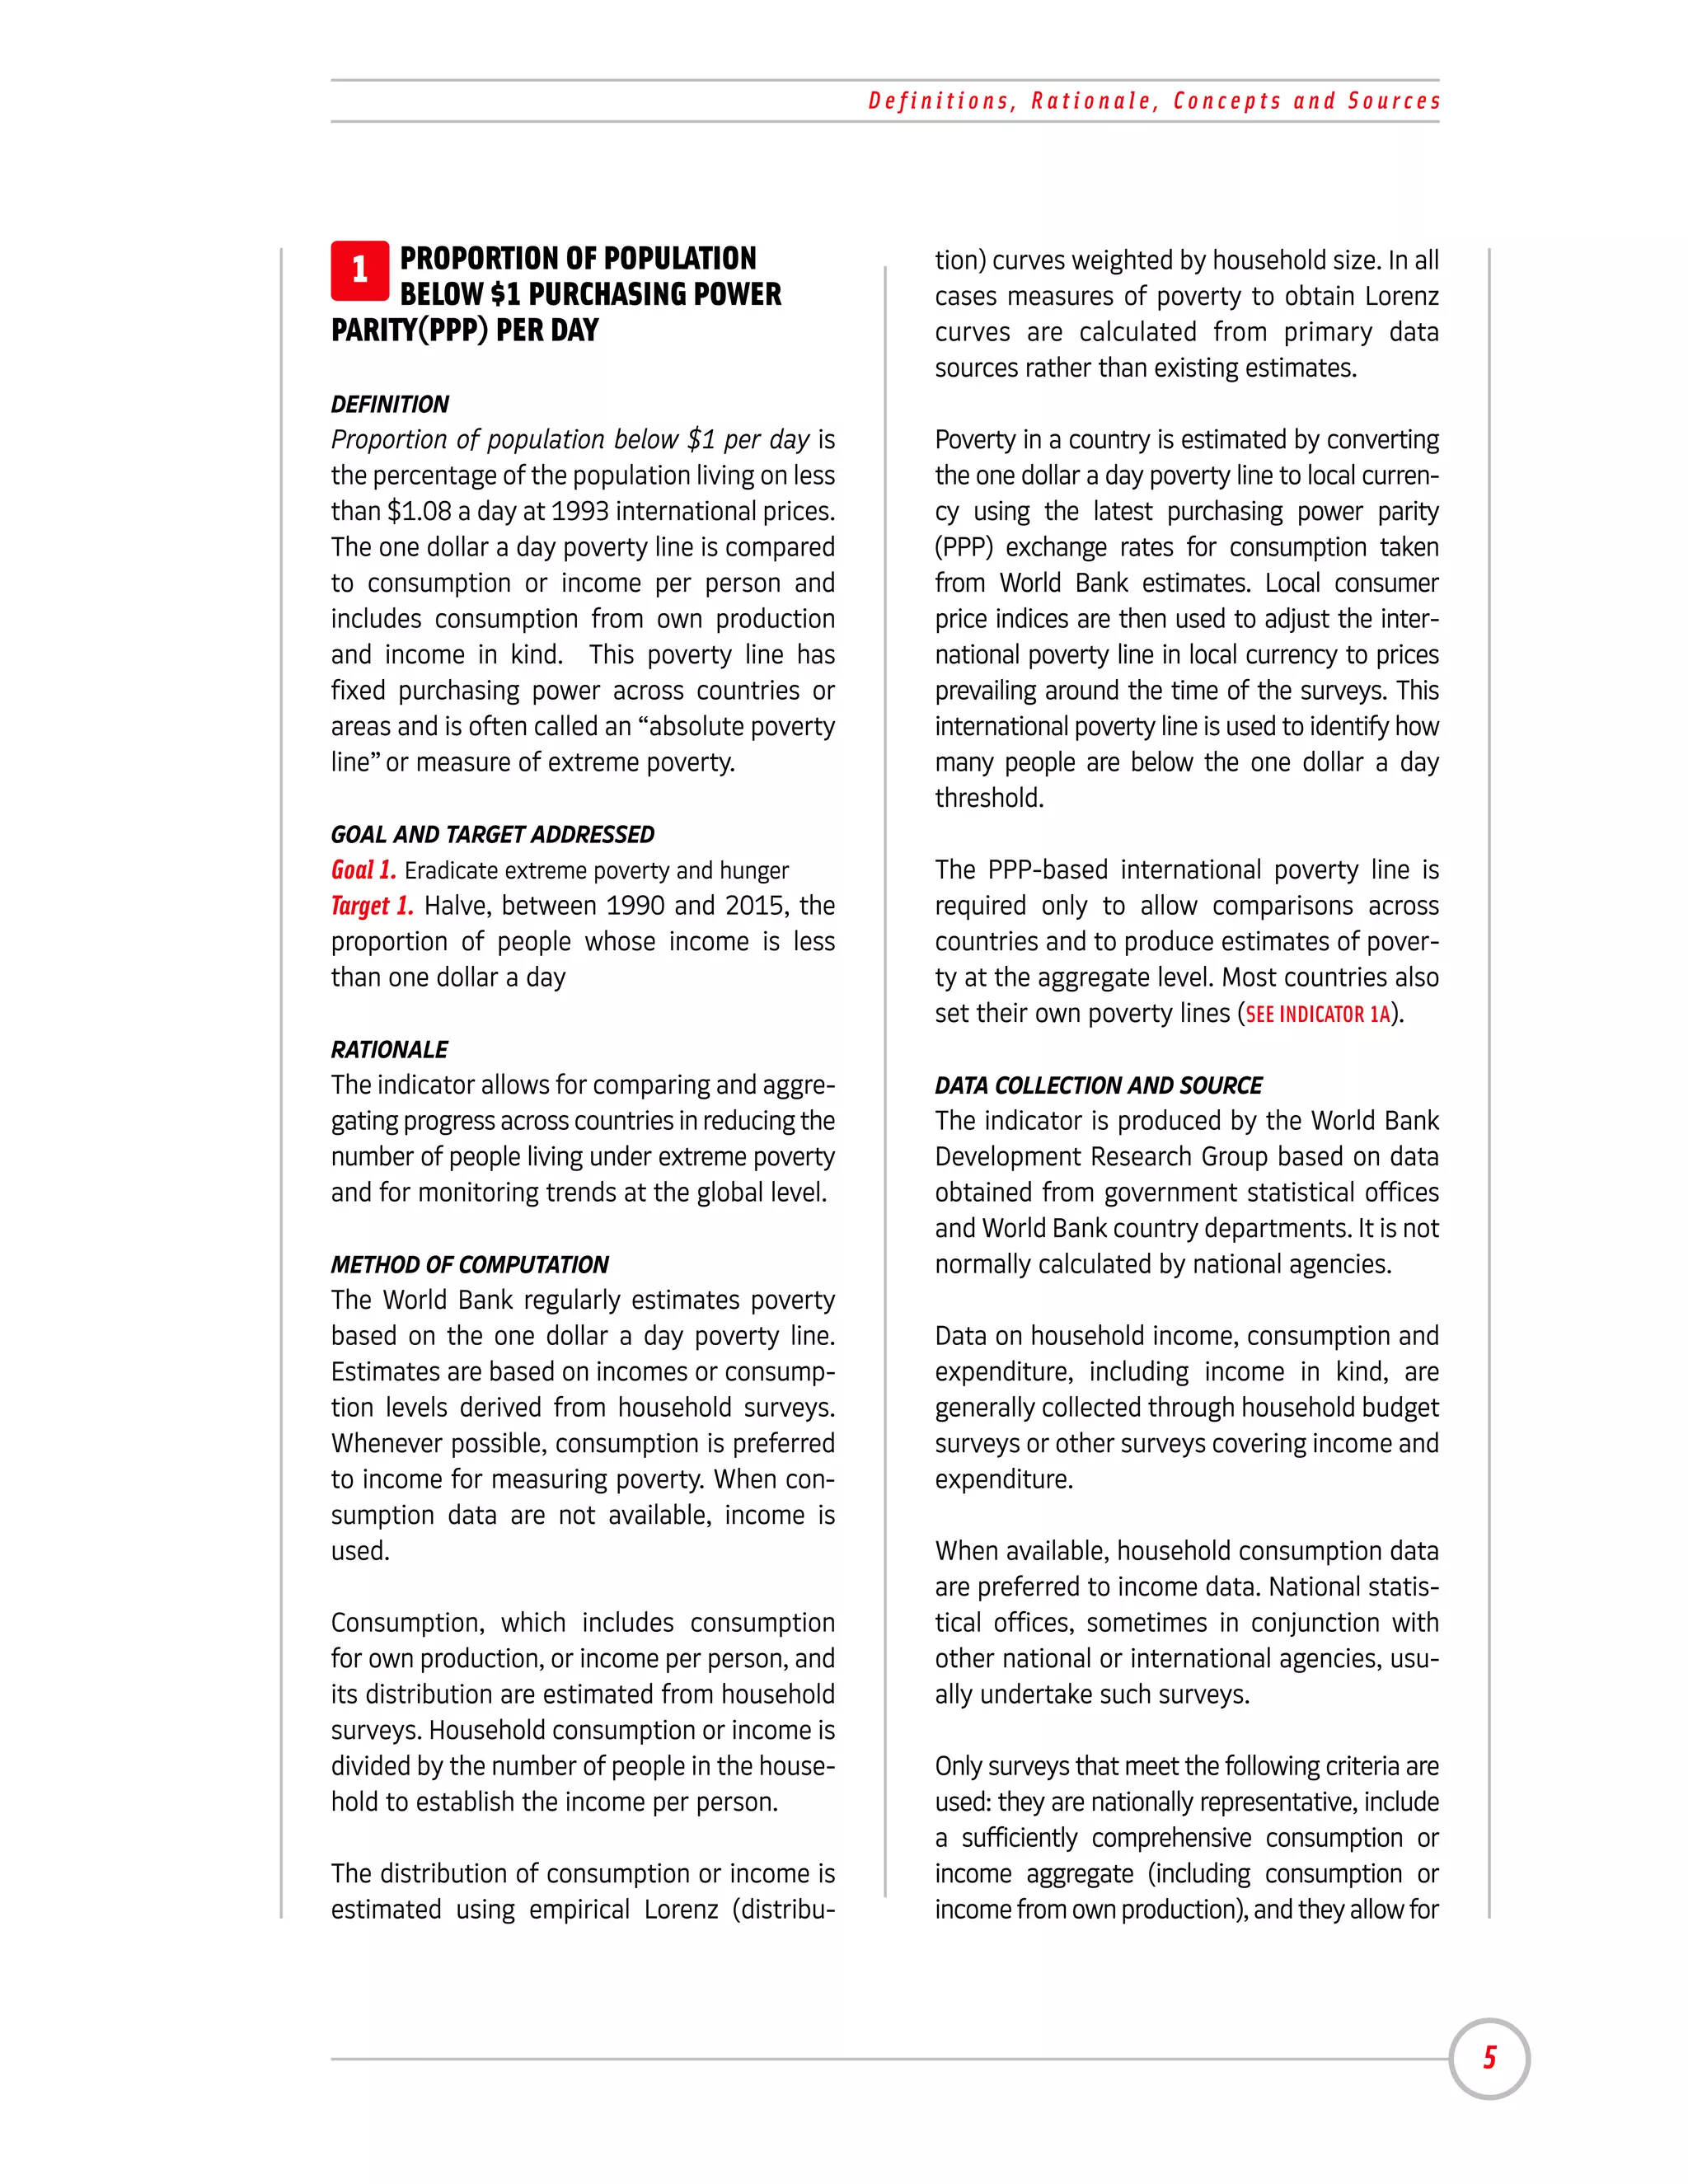
GOAL 1: ERADICATE EXTREME POVERTY AND HUNGER
a
TARGET 1: Halve, between 1990 and 2015, the proportion of people whose income is 1. Proportion of population below $1 (PPP) per day
less than one dollar a day 1A. Poverty headcount ratio (percentage of population below the national poverty
line)
2. Poverty gap ratio [incidence x depth of poverty]
3. Share of poorest quintile in national consumption
TARGET 2: Halve, between 1990 and 2015, the proportion of people who suffer from 4. Prevalence of underweight children under 5 years of age
hunger 5. Proportion of population below minimum level of dietary energy consumption
GOAL 2: ACHIEVE UNIVERSAL PRIMARY EDUCATION
TARGET 3: Ensure that, by 2015, children everywhere, boys and girls alike, will be able 6. Net enrolment ratio in primary education
b
to complete a full course of primary schooling 7. Proportion of pupils starting grade 1 who reach grade 5
8. Literacy rate of 15–24 year-olds
GOAL 3: PROMOTE GENDER EQUALITY AND EMPOWER WOMEN
TARGET 4 : Eliminate gender disparity in primary and secondary education, preferably 9. Ratio of girls to boys in primary, secondary and tertiary education
by 2005, and in all levels of education no later than 2015 10. Ratio of literate women to men, 15–24 years old
11. Share of women in wage employment in the non-agricultural sector
12. Proportion of seats held by women in national parliament
GOAL 4: REDUCE CHILD MORTALITY
TARGET 5 : Reduce by two thirds, between 1990 and 2015, the under-five mortality rate 13. Under-five mortality rate
14. Infant mortality rate
15. Proportion of 1 year-old children immunized against measles
GOAL 5: IMPROVE MATERNAL HEALTH
TARGET 6 : Reduce by three quarters, between 1990 and 2015, the maternal 16. Maternal mortality ratio
mortality ratio 17. Proportion of births attended by skilled health personnel
GOAL 6: COMBAT HIV/AIDS, MALARIA AND OTHER DISEASES
TARGET 7 : Have halted by 2015 and begun to reverse the spread of HIV/AIDS 18. HIV prevalence among pregnant women aged 15–24 years
c
19. Condom use rate of the contraceptive prevalence rate
19A. Condom use at last high-risk sex
19B. Percentage of population aged 15-24 years with comprehensive correct knowl-
d
edge of HIV/AIDS
19C. Contraceptive prevalence rate
20. Ratio of school attendance of orphans to school attendance of non-orphans
aged 10–14years
TARGET 8 : Have halted by 2015 and begun to reverse the incidence of malaria and 21. Prevalence and death rates associated with malaria
other major diseases 22. Proportion of population in malaria-risk areas using effective malaria prevention
e
and treatment measures
23. Prevalence and death rates associated with tuberculosis
24. Proportion of tuberculosis cases detected and cured under DOTS
GOAL 7: ENSURE ENVIRONMENTAL SUSTAINABILITY
TARGET 9 : Integrate the principles of sustainable development into country policies 25. Proportion of land area covered by forest
and programmes and reverse the loss of environmental resources 26. Ratio of area protected to maintain biological diversity to surface area
27. Energy use (kg oil equivalent) per $1 GDP (PPP)
28. Carbon dioxide emissions per capita and consumption of ozone-depleting CFCs
(ODP tons)
29. Proportion of population using solid fuels
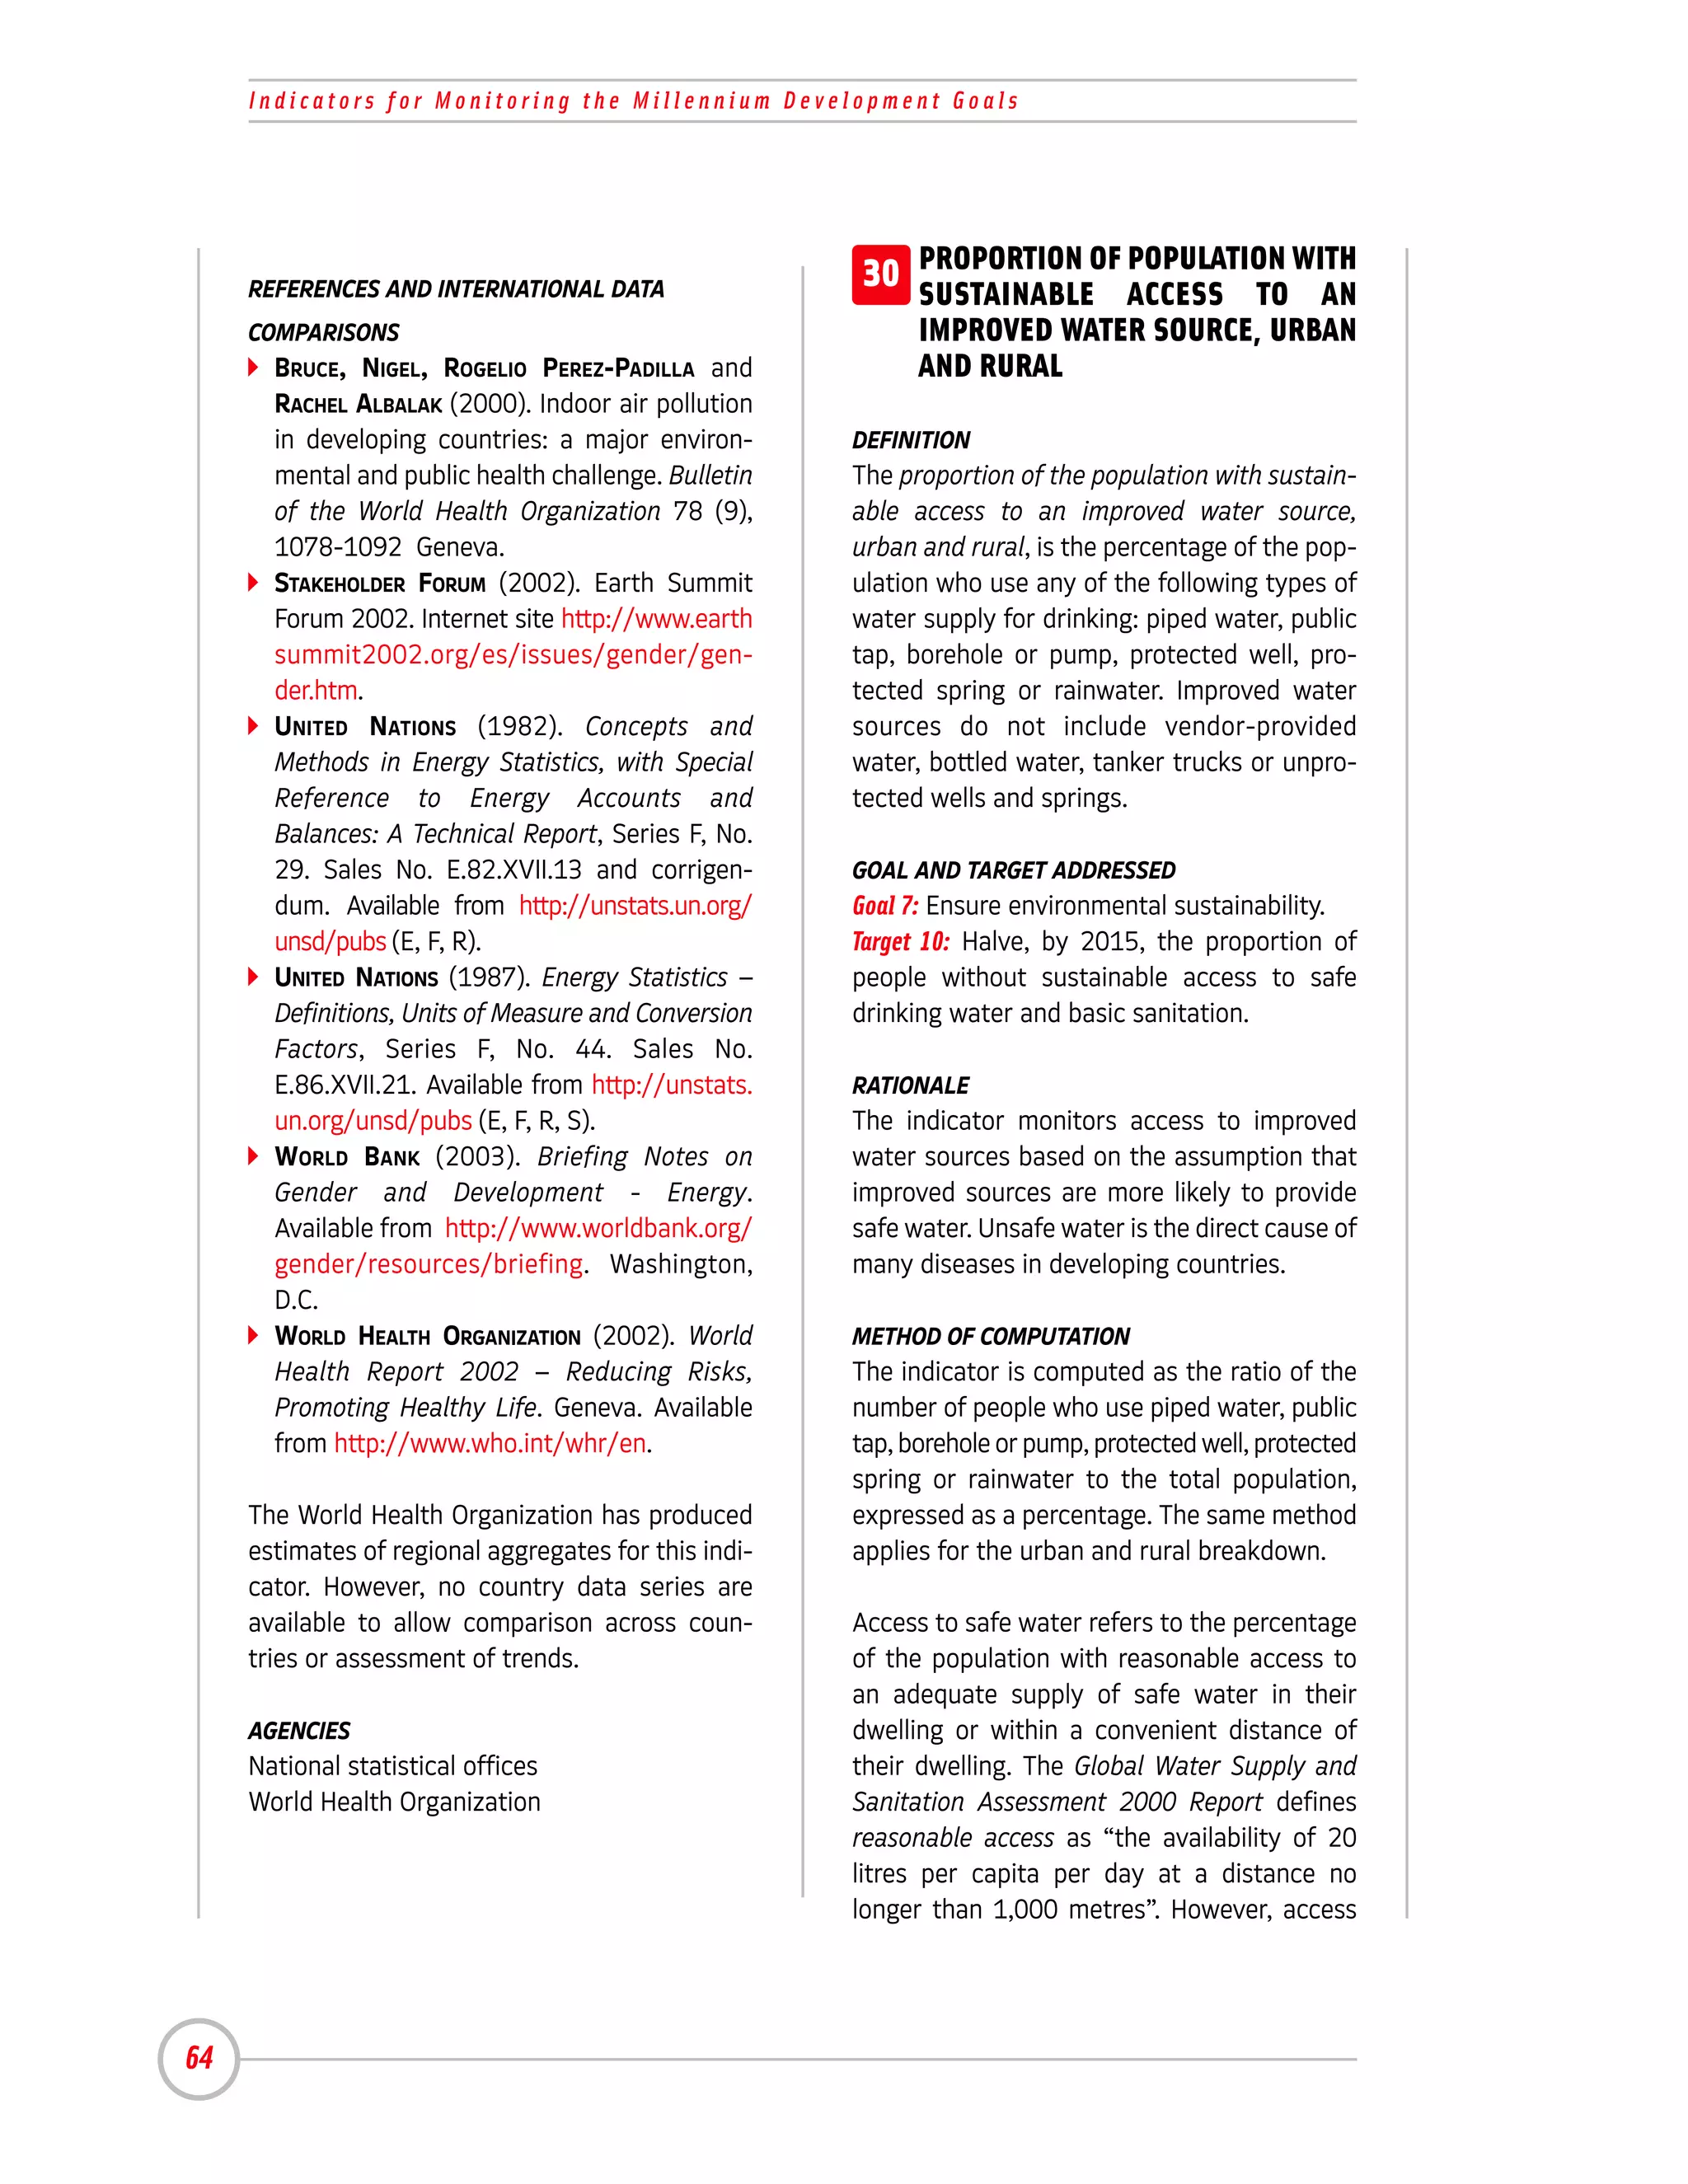
TARGET 10 : Halve, by 2015, the proportion of people without sustainable access to safe 30. Proportion of population with sustainable access to an improved water
drinking water and basic sanitation source, urban and rural
31. Proportion of population with access to improved sanitation, urban and rural
TARGET 11 : By 2020, to have achieved a significant improvement in the lives of at least 32. Proportion of households with access to secure tenure
100 million slum dwellers
3](https://image.slidesharecdn.com/mdganddevelopment-120530205610-phpapp02/75/Mdg-and-development-11-2048.jpg)
![Definitions, Rationale, Concepts and Sources
out ad hoc, often with intervals of five or AGENCY
more years. Labour force surveys tend to be International Labour Organization
conducted more frequently, generally every
three to five years in developing countries.
CCA NUMBER OF PERSONS PER ROOM, OR
GENDER ISSUES 41 AVERAGE FLOOR AREA PER PERSON
There are large gender-specific differences in
informal sector employment in most countries. DEFINITION
Number of persons per room, or average floor
INTERNATIONAL DATA COMPARISONS area per person, is a measure of crowding.
Major limitations on the international compa- Number of persons per room is the number of
rability of data result from the inclusion or rooms in the living quarters of a household
exclusion of agricultural activities from the per person in the household. Average floor area
scope of the informal sector, the inclusion or (in square metres) per person is the median
exclusion of informal sector activities under- usable floor area per person.
taken as second jobs, differences in the geo-
graphical coverage of informal sector surveys The number of rooms excludes kitchens,
and similar factors. bathrooms, toilets, verandas, rooms used for
business and rooms let to tenants.
COMMENTS AND LIMITATIONS
Statistics on employment in the informal sec- Floor area includes kitchens, bathrooms,
tor tend to be available only for developing internal corridors and closets. Covered, semi-
countries and transition countries, where the private spaces such as corridors, inner court-
informal sector plays a significant role in yards or verandas are included in the floor
employment and income generation. Informal area if they are used for cooking, eating,
employment outside informal sector enter- sleeping or other domestic activities.
prises is not covered by the enterprise-based
definition of the informal sector. Although GOAL AND TARGET ADDRESSED
there are international standards, definitions Goal. Adequate shelter for all
may vary among countries. Target. Provision of sufficient living space and
avoidance of overcrowding (United Nations
REFERENCES AND INTERNATIONAL DATA Conference on Human Settlements, [Habitat II],
COMPARISONS 1996)
INTERNATIONAL LABOUR OFFICE (2002). Women
and Men in the Informal Economy: A statis- RATIONALE
tical picture. Geneva. available from Crowding, or housing density, is a key meas-
http://www.ilo.org/public/english/employ- ure of housing quality. The three most com-
ment/gems/download/women.pdf. monly used measures of crowding are per-
INTERNATIONAL LABOUR ORGANIZATION (annual). sons per room, floor area per person and
Key Indicators of the Labour Market. Table households per dwelling unit. Surveys have
7. Geneva. Available in part from shown that floor area per person is the more
http://www.ilo.org/kilm. precise and more policy sensitive of the three.
INTERNATIONAL LABOUR ORGANIZATION (2000).
Current International Recommendations on METHOD OF COMPUTATION
Labour Statistics, 2000 Edition. Geneva. The number of persons per room is calculated
by dividing the number of people who live in
the household by the total number of rooms
97](https://image.slidesharecdn.com/mdganddevelopment-120530205610-phpapp02/75/Mdg-and-development-105-2048.jpg)
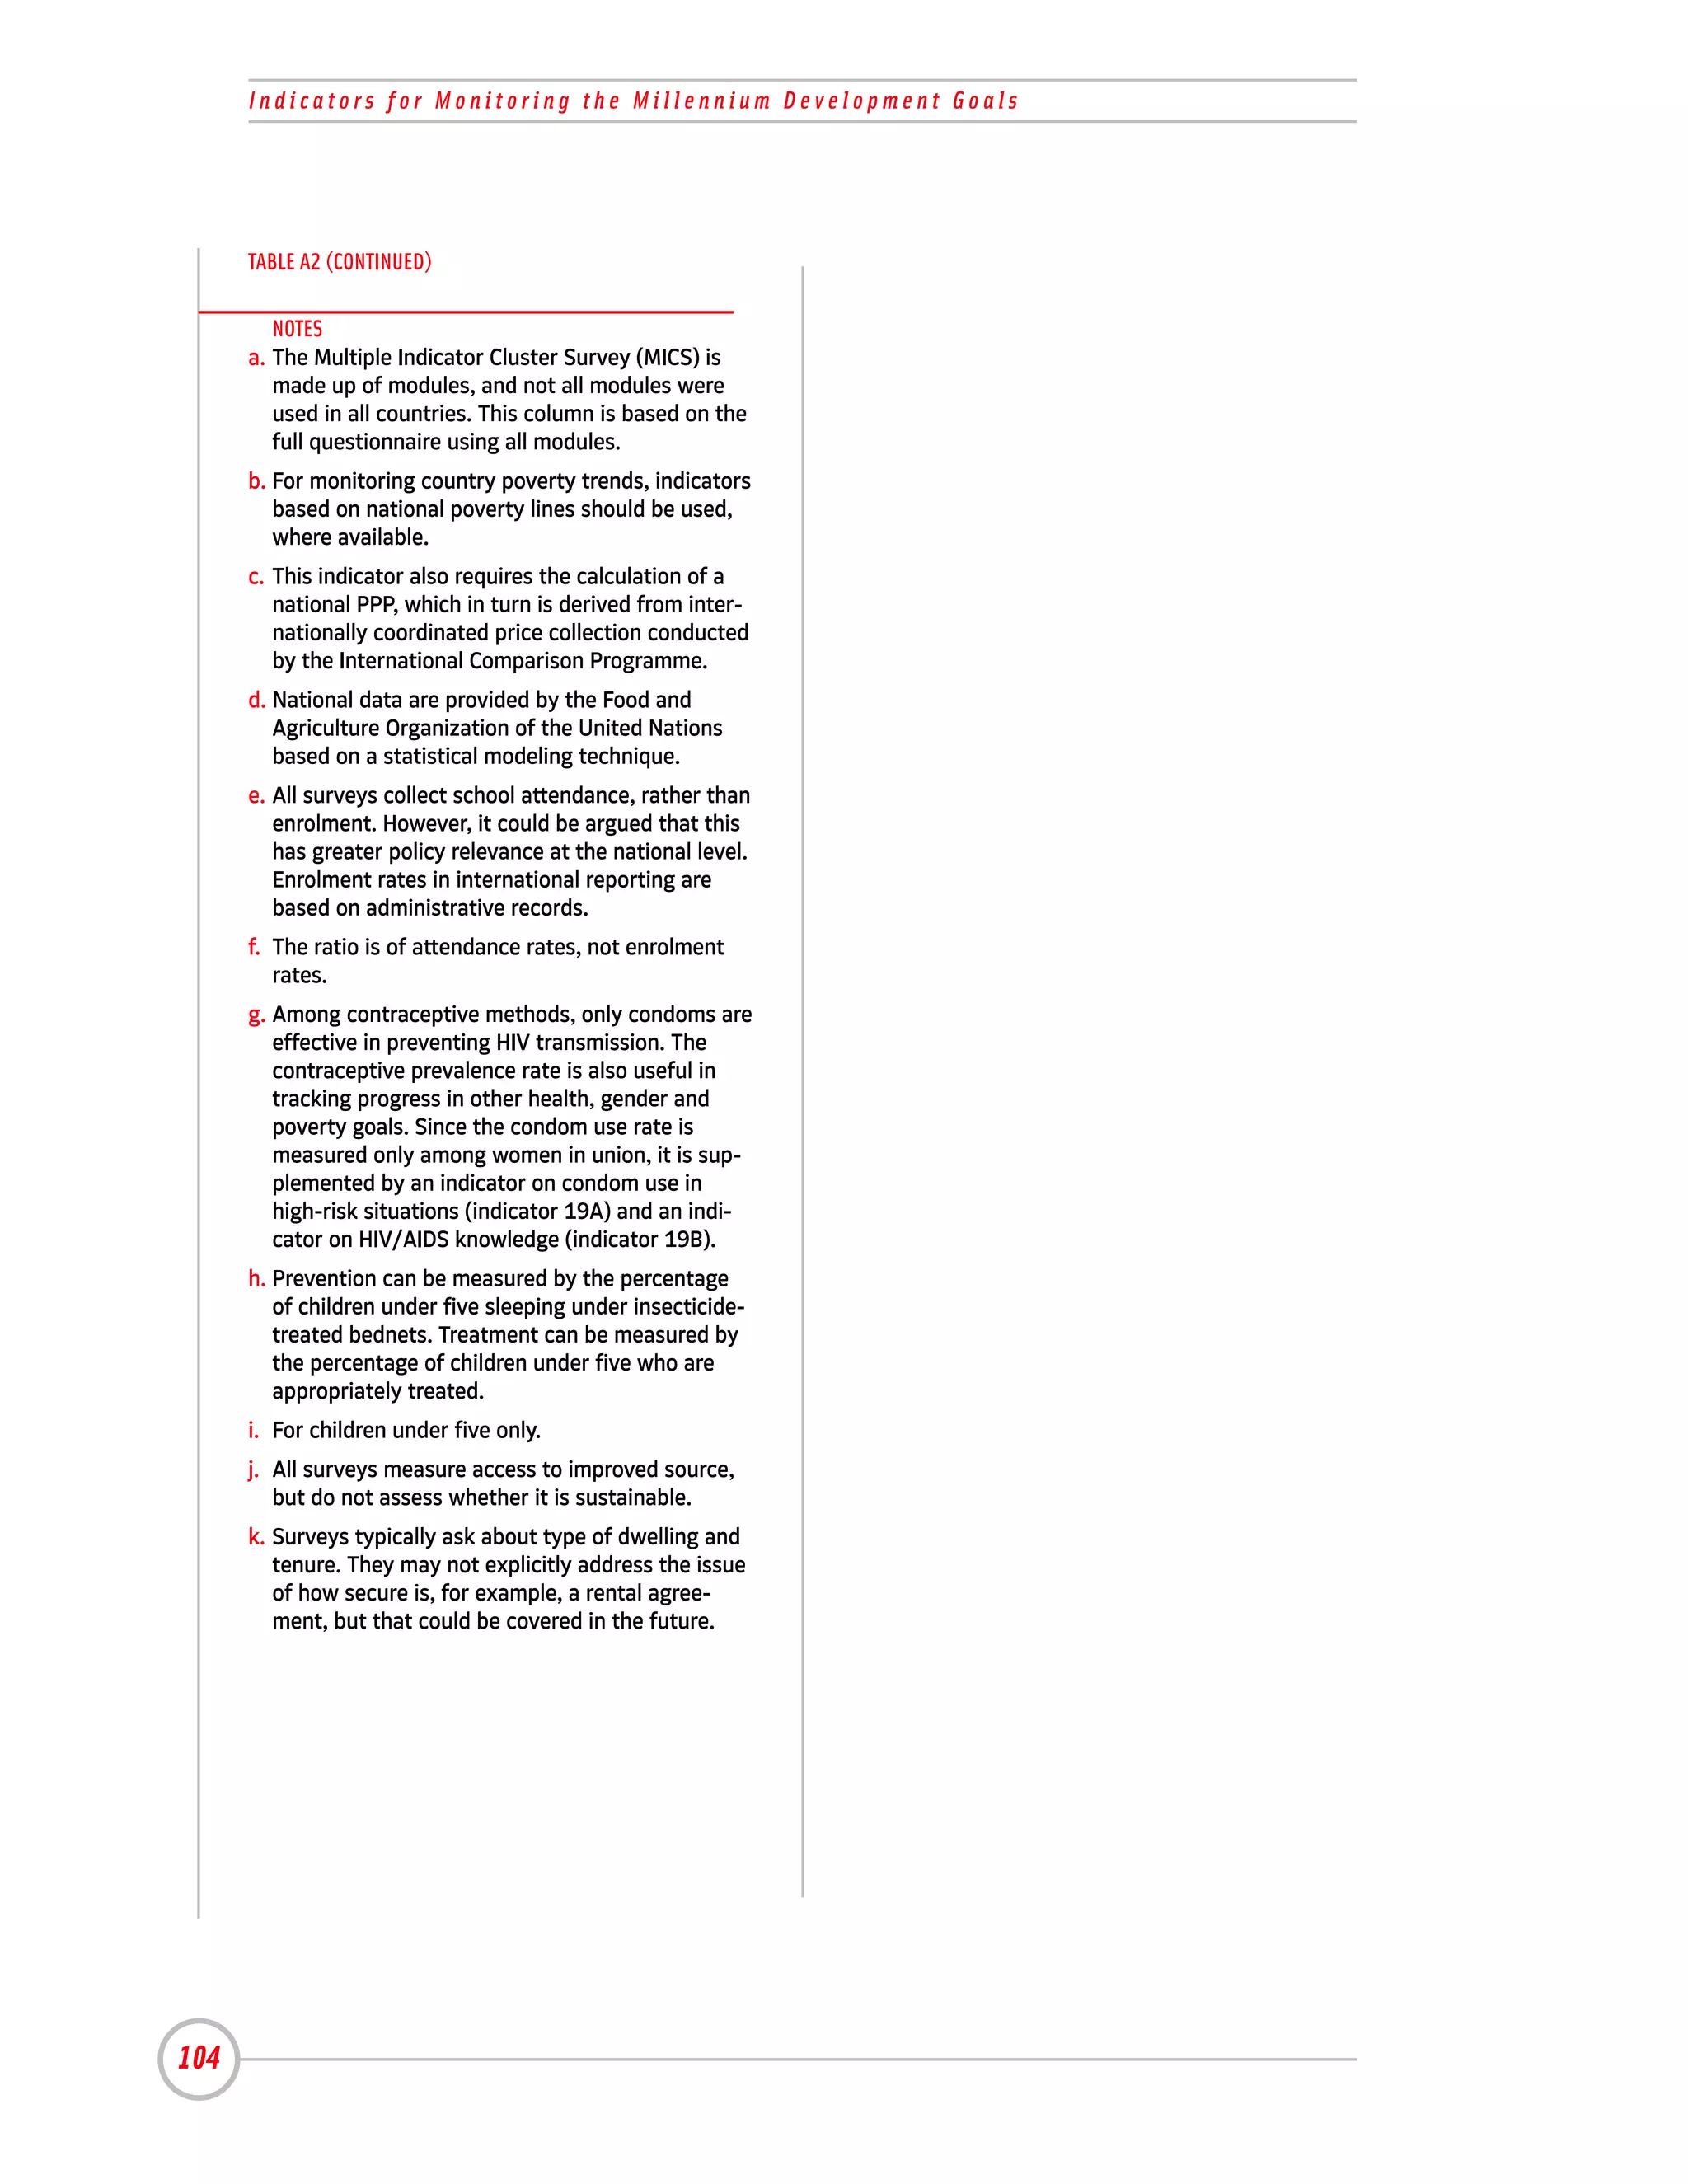
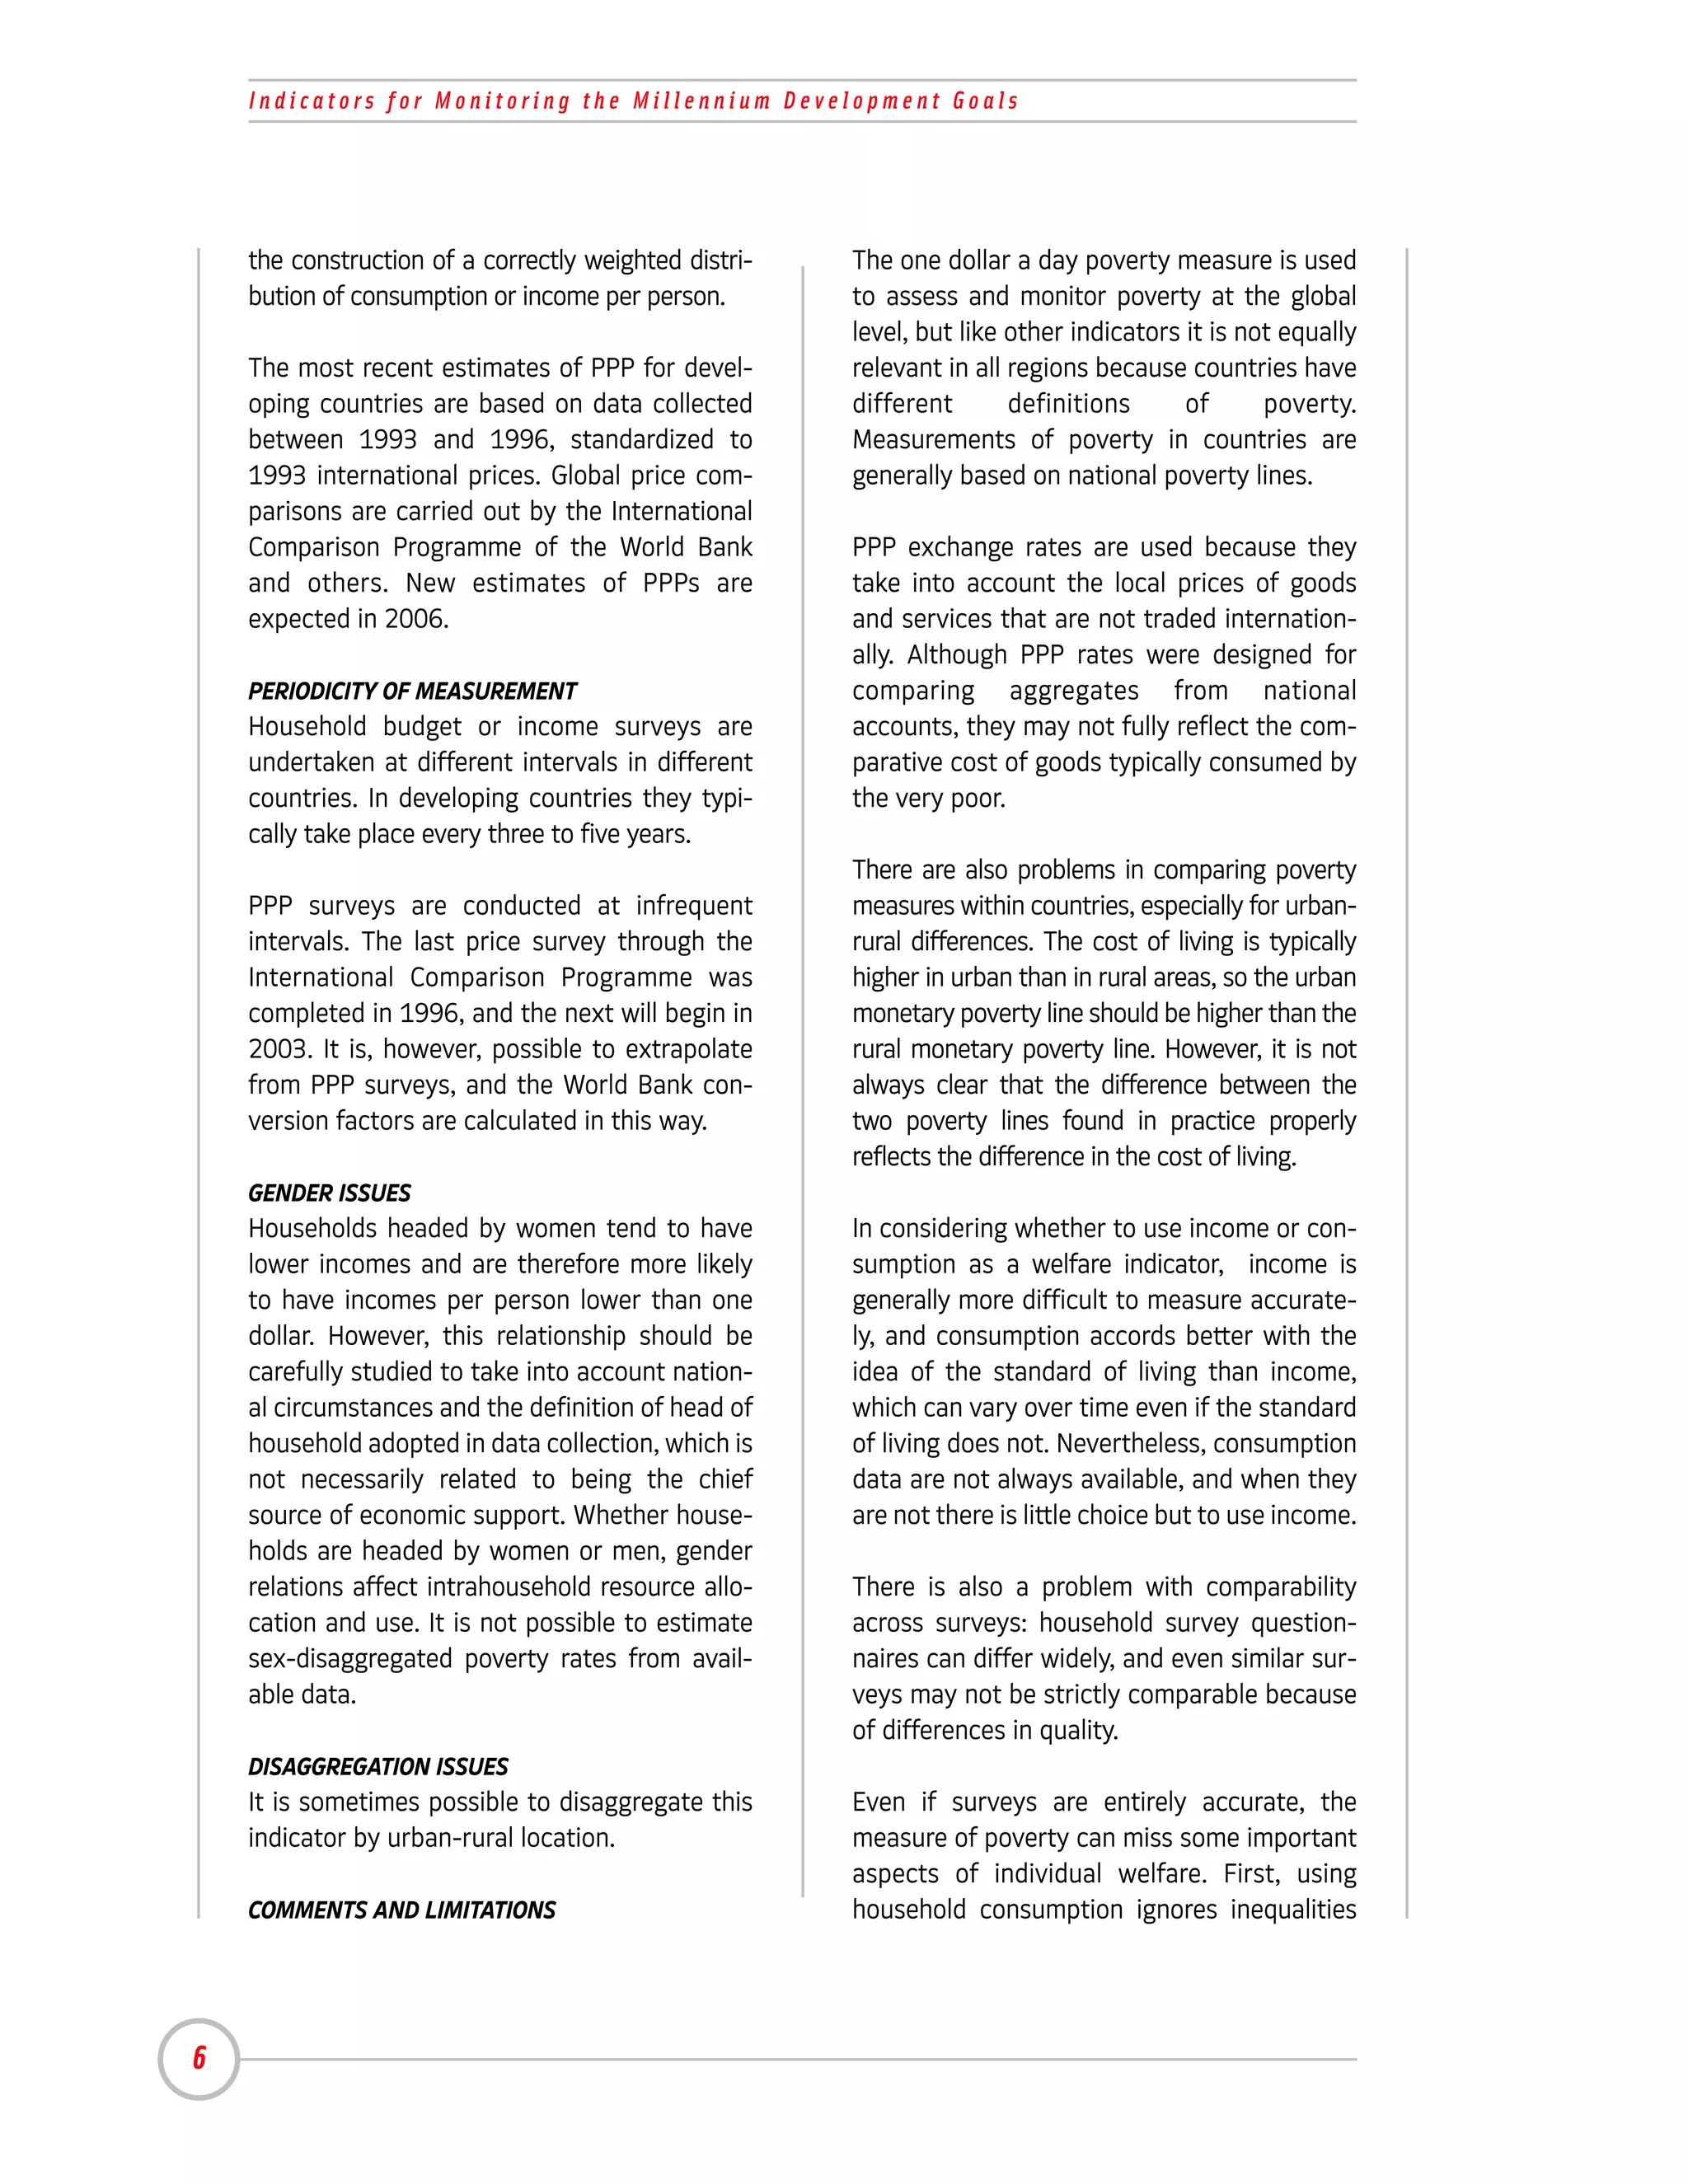
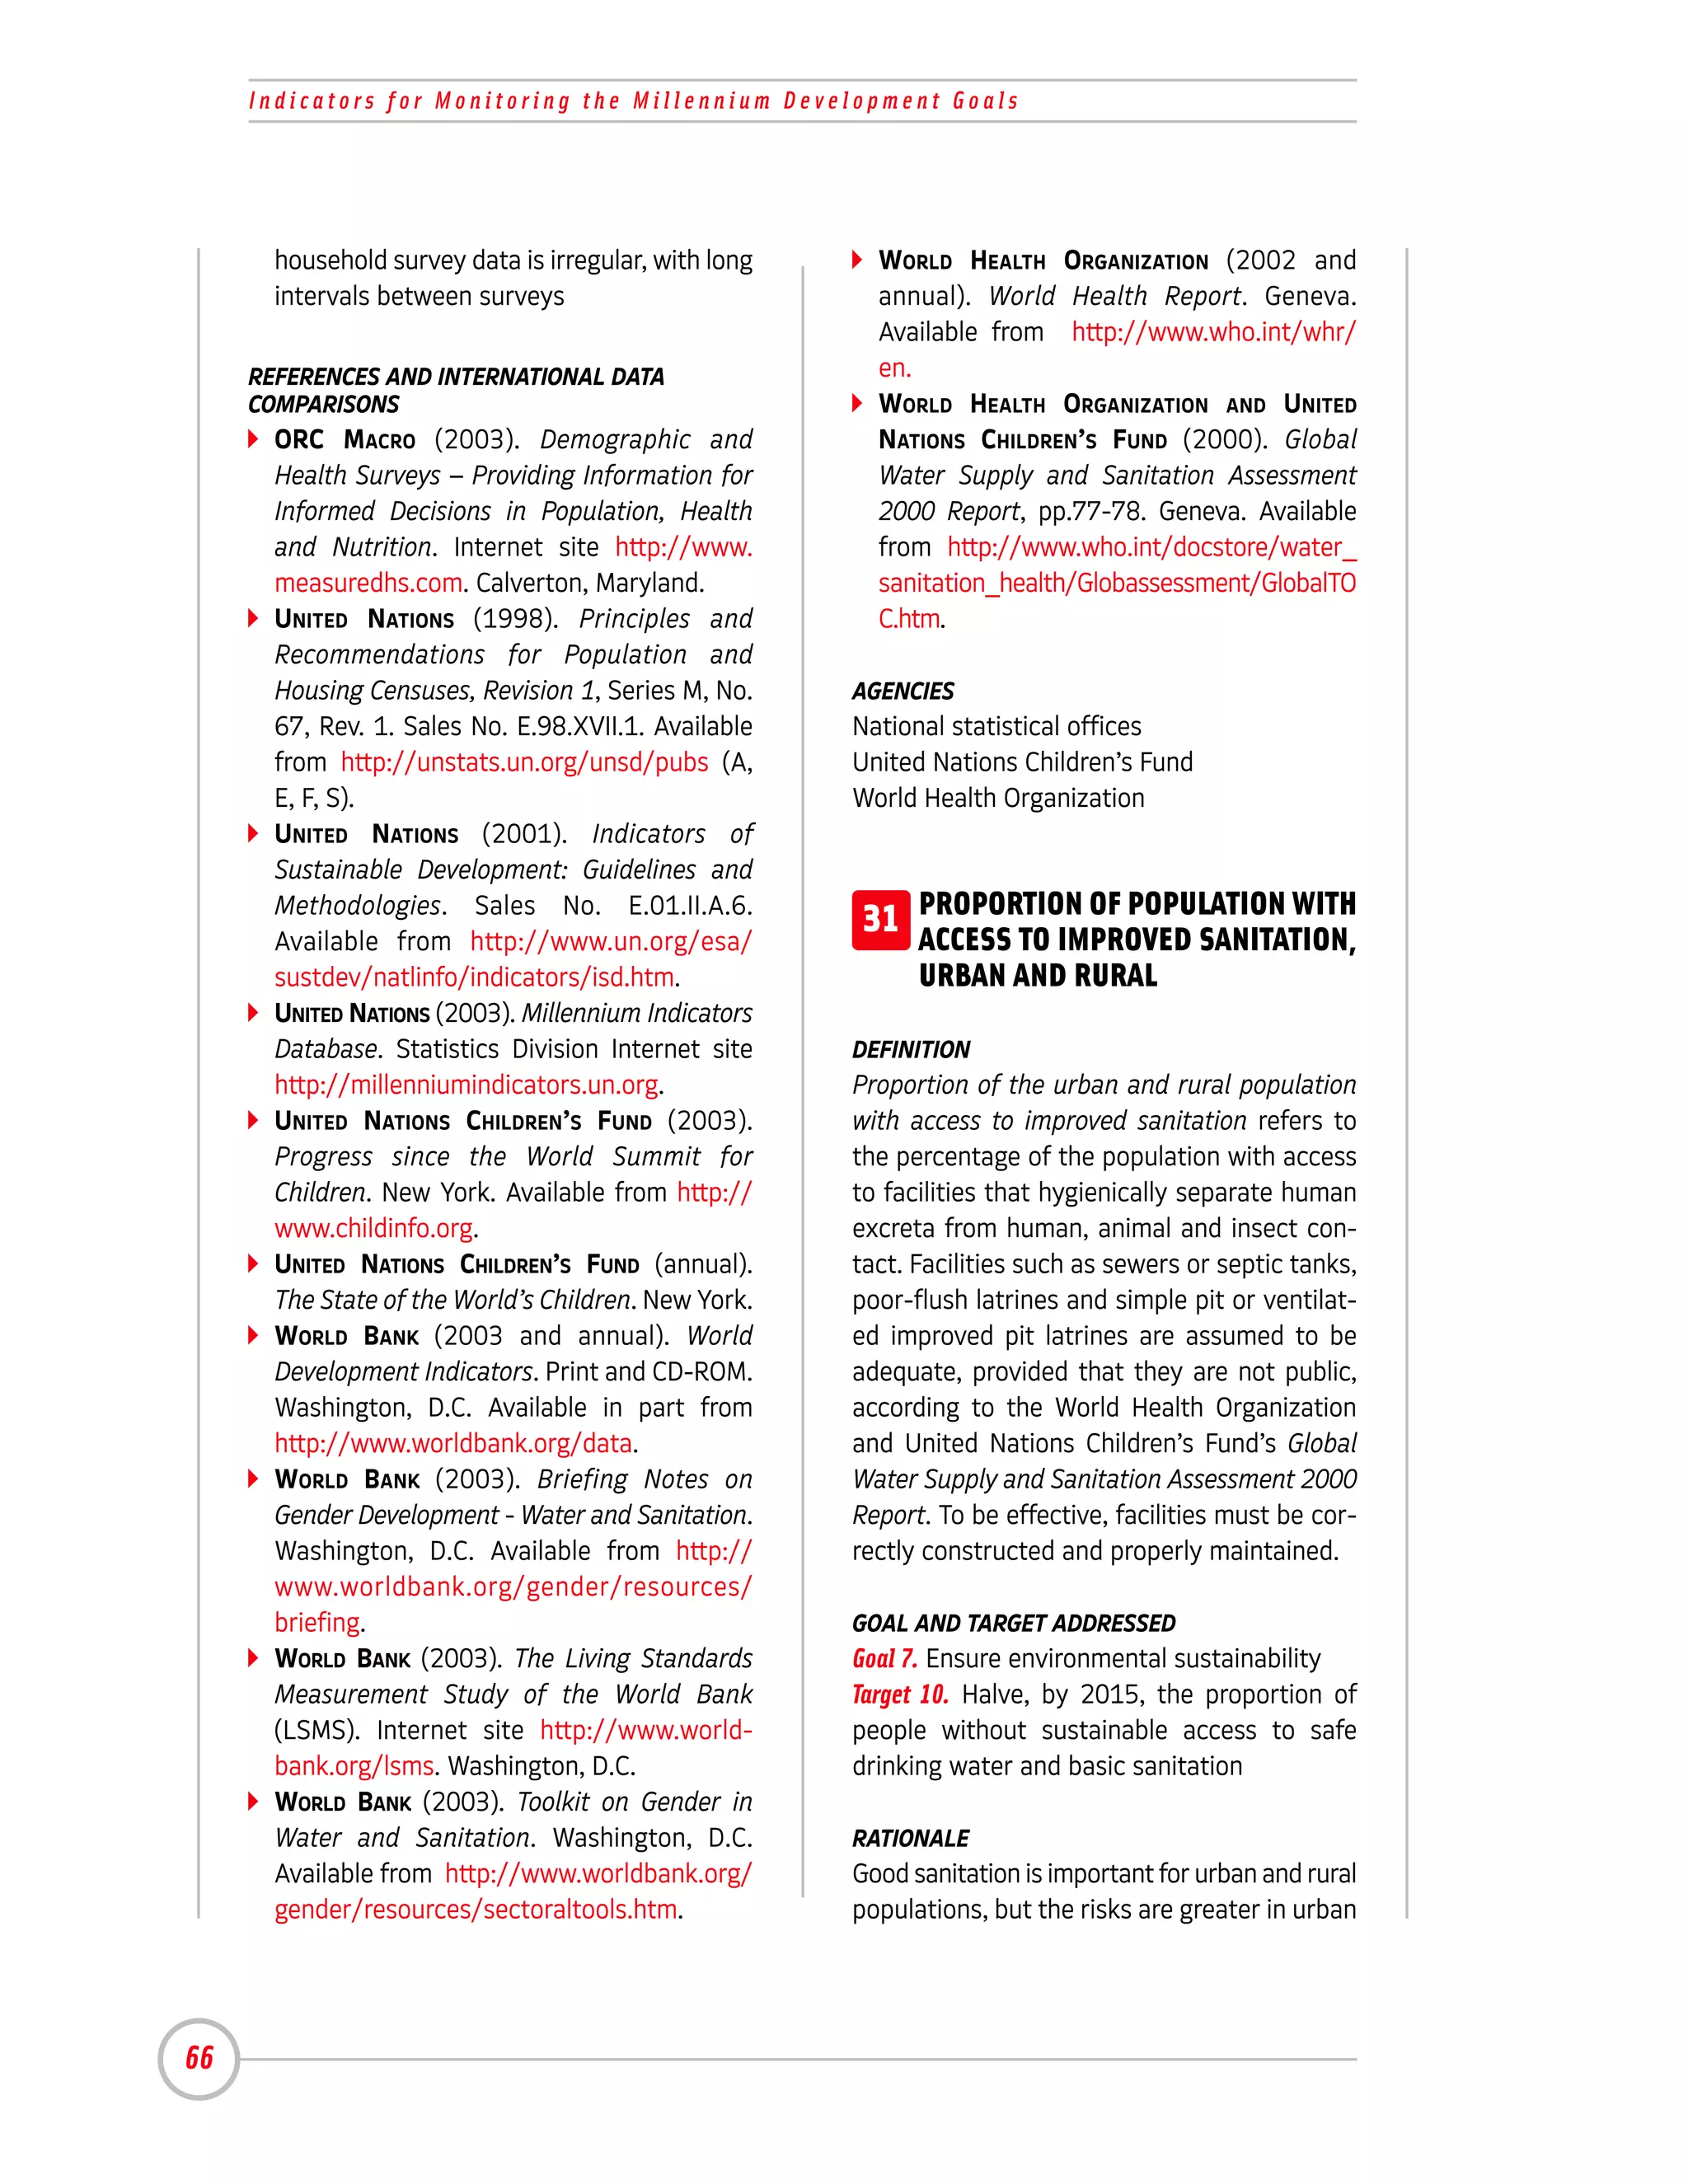
![TABLE A2. Comparison of indicator coverage of four survey types
a
GOALS LSMS DHS CWIQ MICS
GOAL 1: ERADICATE EXTREME POVERTY AND HUNGER
Proportion of population below $1 per day b •c
Poverty gap ratio [incidence x depth of poverty] •
Share of poorest quintile in national consumption •
Prevalence of underweight children under 5 years of age • • • •
Proportion of population below minimum level of dietary energy
consumption d
GOAL 2: ACHIEVE UNIVERSAL PRIMARY EDUCATION
Net enrolment ratio in primary education e ( •) ( •) ( •) ( •)
Proportion of pupils starting grade 1 who reach grade 5 • • • •
Literacy rate of 15–24 year-olds • • • •
GOAL 3: PROMOTE GENDER EQUALITY AND EMPOWER WOMEN
Ratio of girls to boys in primary, secondary and tertiary education f ( •) ( •) ( •) ( •)
Ratio of literate women to men, 15–24 years old
Share of women in wage employment in the non-agricultural sector • • • •
Proportion of seats held by women in national parliament • •
GOAL 4: REDUCE CHILD MORTALITY
Under-five mortality rate • •
Infant mortality rate • •
Proportion of 1-year-old children immunized against measles • •
GOAL 5: IMPROVE MATERNAL HEALTH
Maternal mortality ratio • •
Proportion of births attended by skilled health personnel • •
GOAL 6: COMBAT HIV/AIDS, MALARIA AND OTHER DISEASES
HIV prevalence among aged pregnant women 15–24 years
Contraceptive prevalence rate g • •
Number of children orphaned by HIV/AIDS
Prevalence and death rates associated with malaria •i
Proportion of population in malaria-risk areas using effective
malaria prevention and treatment measures h
Prevalence and death rates associated with tuberculosis
Proportion of tuberculosis cases detected and cured under DOTS
GOAL 7: ENSURE ENVIRONMENTAL SUSTAINABILITY
Proportion of land area covered by forest
Ratio of area protected to maintain biological diversity
to surface area
Energy use (kg oil equivalent) per $1 GDP (PPP)
Carbon dioxide emissions per capita and consumption of
ozone-depleting CFCs (ODP tons)
Proportion of population using solid fuels
Proportion of population with sustainable access to an
improved water source, urban and rural j • • • •
Proportion of urban and rural population with access to
improved sanitation • • • •
Proportion of households with access to secure tenure ( • )k
103](https://image.slidesharecdn.com/mdganddevelopment-120530205610-phpapp02/75/Mdg-and-development-111-2048.jpg)